LSAT TECHNICAL REPORT SERIES
Predictive Validity of the LSAT: A National Summary of the 2009 and 2010 LSAT Correlation Studies Lisa Anthony Stilwell Susan P. Dalessandro Lynda M. Reese
Law School Admission Council LSAT Technical Report 11-02 October 2011
A Publication of the Law School Admission Council
The Law School Admission Council (LSAC) is a nonprofit corporation that provides unique, state-of-theart admission products and services to ease the admission process for law schools and their applicants worldwide. More than 200 law schools in the United States, Canada, and Australia are members of the Council and benefit from LSAC's services.
© 2011 by Law School Admission Council, Inc.
LSAT, The Official LSAT PrepTest, The Official LSAT SuperPrep, ItemWise, and LSAC are registered marks of the Law School Admission Council, Inc. Law School Forums, Credential Assembly Service, CAS, LLM Credential Assembly Service, and LLM CAS are service marks of the Law School Admission Council, Inc. 10 Actual, Official LSAT PrepTests; 10 More Actual, Official LSAT PrepTests; The Next 10 Actual, Official LSAT PrepTests; 10 New Actual, Official LSAT PrepTests with Comparative Reading; The New Whole Law School Package; ABA-LSAC Official Guide to ABA-Approved Law Schools; Whole Test 2 Prep Packages; The Official LSAT Handbook; ACES ; ADMIT-LLM; FlexApp; Candidate Referral Service; DiscoverLaw.org; Law School Admission Test; and Law School Admission Council are trademarks of the Law School Admission Council, Inc. All rights reserved. No part of this work, including information, data, or other portions of the work published in electronic form, may be reproduced or transmitted in any form or by any means, electronic or mechanical, including photocopying and recording, or by any information storage and retrieval system without permission of the publisher. For information, write: Communications, Law School Admission Council, 662 Penn Street, PO Box 40, Newtown PA, 18940-0040. LSAC fees, policies, and procedures relating to, but not limited to, test registration, test administration, test score reporting, misconduct and irregularities, Credential Assembly Service (CAS), and other matters may change without notice at any time. Up-to-date LSAC policies and procedures are available at LSAC.org.
Table of Contents Executive Summary ........................................................................................................1 Introduction .....................................................................................................................1 The Criterion Variable .....................................................................................................2 The Predictor Variables ..................................................................................................3 Estimating Validity ..........................................................................................................3 Results .............................................................................................................................6 Summary Data........................................................................................................6 Correlation Coefficients ..........................................................................................8 Factors Influencing the Magnitude of the Correlation Coefficients........................ 12 Cross-Validation Studies ...................................................................................... 15 Accounting for Variance ....................................................................................... 16 Trends Over Time................................................................................................. 17 Conclusion ..................................................................................................................... 18 References ..................................................................................................................... 18
i
Executive Summary Since the Law School Admission Test (LSAT) was first administered, the sponsors of the test have carried out predictive validity studies to evaluate the effectiveness of the test as well as other predictors in determining first-year law school performance. Over the years, increasingly large numbers of law schools have participated in these studies, commonly called correlation studies. This report presents a summary of results for the 2009 and 2010 LSAT Correlation Studies. This summary can serve as documentation of the generalizability of the claim of the validity of LSAT scores for use in the law school admission process. More importantly, this study provides national longitudinal data for law schools to examine against their school-specific results to increase understanding of their own admission process. Since correlation studies are conducted for individual schools and schoolspecific results are reported only to the schools whose data were analyzed, the results reported in this study may be used by schools as a benchmark in evaluating their own results. The effectiveness of LSAT scores alone, undergraduate grade point average (UGPA) alone, and the combination of these two variables for predicting first-year average (FYA) in law school is evaluated. Results reported in the current study indicate that LSAT scores alone tend to be a better predictor of law school performance compared to UGPA alone. The combination of LSAT scores and UGPA, however, continues to be superior to either predictor variable alone for predicting FYA. These results, combined with similar results from previous studies, support the validity of the LSAT for use in the law school admission process.
Introduction For approximately 63 years, the sponsors of the Law School Admission Test (LSAT) have offered to conduct studies on the effectiveness of the test as well as other predictors of law school performance used in the admission process. These studies are offered by the Law School Admission Council (LSAC) free of charge to participating law schools, and schools have been encouraged to avail themselves of the service. Over the years, increasingly large numbers of law schools have participated in the correlation studies. During the period from 2009 to 2010, 204 schools participated in the studies and 396 correlation studies were conducted. Of the 204 schools, 173 schools participated for both years (2009 and 2010). Since 3 law schools were omitted from this study based on evidence suggesting that preselection effects distorted their results, the summary data presented in this report are only from the remaining 170 schools. Canadian schools were excluded from this report because they did not participate in LSAC’s Credited Assembly Service (CAS). Schools not accredited by the American Bar Association (ABA) and some schools that had grading scale changes were also excluded from this report. In addition, only fall-entering full-time students with complete data were included. Note that this report is largely a replication of earlier national summaries of multiple correlation studies: 1990–1992 (Wightman, 1993); 1995–1996 (Anthony, Harris, &
1
Pashley, 1997); 1997–1998 (Anthony, Duffy, & Reese, 1999); 1999–2000 (Thornton, Suto, Anthony, & Liu, 2005); 2001–2002 (Stilwell, Diamond-Dalessandro, & Reese, 2005); 2003–2004 (Diamond-Dalessandro, Stilwell, & Reese, 2005); 2005–2006 (Stilwell et al., 2007); and 2007–2008 (Stilwell et al., 2009). The LSAT scores available at the time of the Wightman study were from the 10–48 score scale, while the seven later studies analyzed LSAT scores on the 120–180 score scale. One purpose of this study is to summarize data across schools in order to provide documentation on the generalizability of the claim of validity of LSAT scores for use in the admission process. A more important purpose is to provide national longitudinal data for law schools to examine against their school-specific data to increase understanding of their own admission process. Correlation studies are conducted for individual schools, and school-specific results are reported exclusively to the schools whose data were analyzed. Thus, schools know how well the test and other predictors are performing within their own admission process, but they have no benchmark against which to evaluate their results. The correlation studies provide valuable information to LSAT score users. One task frequently assigned to those responsible for law school admission is that of identifying from large groups of law school applicants those who are most likely to succeed in law school. A limited amount of information usually is available from which to make that decision. Almost universally across all ABA-accredited law schools and English language common-law law schools in Canada, both LSAT score and undergraduate grade point average (UGPA) are among the available data. Both are quantifiable measures that are potentially useful in making admission decisions, and many schools use this information extensively. If this (or any other) quantifiable information is relied on in the selection process, the burden is on the score user to obtain evidence that there is a relationship between the quantified variables and the outcome of interest to the admission committee—usually, success in law school. The correlation studies can provide that evidence for participating schools. An additional value of the correlation studies is that they provide score users with quantifiable information about how their admission process is working and about the makeup of their entering class.
The Criterion Variable Academic success in law school is typically among the important outcomes that those responsible for admission would like to predict. To be sure, there exist other admission goals within individual law schools, but the LSAT purports to be useful for the limited purpose of predicting academic success, so a criterion related to academic success is the most appropriate one for validating the LSAT as a predictor. In the correlation studies, the variable used to represent academic success is first-year average (FYA) in law school. Using FYA as the criterion variable is not unique to LSAT validity studies. A variable based on first-year grades is the most typical criterion used to validate almost all admission tests. FYA is not the only criterion that could be used, but it has several advantages that have shown it to be a useful criterion. First, it represents a composite of the academic performance of a student after 1 year of law school. Some of the courses taken may have been easier than others, some professors
2
more lenient in grading than others. By using the average of all the grades received, these differences in course difficulty and grading stringency tend to average out. Second, for law students, the FYA tends to represent basically the same curriculum for all of the students in the school. In subsequent years, different elective choices are represented in the composite average. Third, FYA data are available within 1 year, whereas other criteria might require a delay of 2, 3, or more years before a study can be conducted.
The Predictor Variables Two predictor variables are used in the correlation studies: UGPA and LSAT score. Individual schools may use other predictors in their admission process, but these two are available for every school. The UGPA used in the correlation studies is the same as the UGPA that LSAC provided to the law school from the CAS, and thus is the UGPA that was available to the law school at the time the admission decision was made. The UGPA is computed by the CAS, according to CAS procedures. Grades computed in this manner are expressed on a scale from 0.00 to 4.33. LSAT scores available for the correlation studies reported here are all on the 120–180 score scale that was introduced in June 1991. The scores used in this study reflect an average of the three most recent LSAT scores. The 1995 studies were the first to be based on 3 years of data for LSAT scores on the 120–180 score scale. The 1995–1996 through 2007–2008 LSAT Correlation Studies were the subjects of previous reports (Anthony et al., 1997, 1999; Diamond-Dalessandro et al., 2005; Stilwell et al., 2005, 2007, 2009; and Thornton et al., 2005). The current study is based on the 2009 and 2010 LSAT Correlation Studies. The 2009 LSAT Correlation Studies report data for the 2006, 2007, and 2008 fall entering classes, as available. The 2010 LSAT Correlation Studies report data for the 2007, 2008, and 2009 fall entering classes. Data accumulated over 3 years provide more stable parameter estimates because a small number of outliers have less influence on prediction weights when the sample sizes are larger. This is particularly important for schools that use the compensatory admission model (this will be discussed in greater detail later in this report). When schools allow a high test score to compensate for a low UGPA or vice versa, the range of LSAT score or UGPA can change dramatically from year to year, particularly when the size of the school is relatively small. Fluctuation in range causes fluctuation over time in the estimates of the raw regression weights. Aggregating data helps stabilize the weights.
Estimating Validity The general concept of validity is a broad one, encompassing the accumulation of data to support a particular use of a test. The particular type of evidence obtained from the correlation studies is referred to as predictive validity. This is so because law school applicants’ FYAs are predicted from their LSAT scores and UGPAs. The statistical procedure used in these studies to predict law school performance from one or both of 3
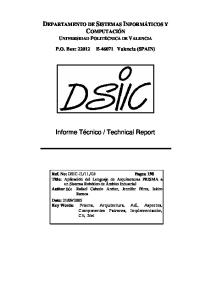
the prediction variables is linear regression. When a single predictor is used to predict the criterion, the prediction equation can be represented by a straight line on a graph that shows for every student a single point that represents both the score on the predictor variable (e.g., LSAT score) and the criterion score (e.g., FYA). The exact position of the line on the graph is calculated so as to minimize the (squared) distance of every point from the line. A statistic known as the correlation coefficient provides an estimate of how well the line represents the points on the graph. The correlation coefficient varies from –1 to 1. A correlation of 1 indicates a perfect positive linear relationship (i.e., high values of one variable are indicative of high values on the other variable), whereas a correlation of –1 indicates a perfect negative linear relationship (i.e., low values on one variable are indicative of high values on the other variable). A correlation of 0 indicates that there is no relationship between the variables being studied. When the correlation coefficients are high, the points are close to the prediction line; when the coefficient is close to 0, there is little relationship between the points and the line. The closer the points are to the regression line (or the higher the correlation coefficient), the more accurately the predictor predicts the criterion. Figures 1–3 show three examples of prediction lines and the relative positions of data points for some sample law school data. In Figure 1, LSAT score is the predictor variable, FYA is the criterion variable, and the correlation coefficient is 0.62. In Figure 2, LSAT score and FYA are again the predictor and criterion variables, respectively, and the correlation coefficient is 0.01. In Figure 3, LSAT score is the predictor variable, UGPA is the criterion variable, and the correlation coefficient is −0.44. The figures are provided to illustrate the relative accuracy of different sized correlation coefficients, as well as both positive and negative linear relationships.
FIGURE 1. Best regression line for LSAT/FYA data, r = 0.62
4
FIGURE 2. Best regression line for LSAT/FYA data, r = 0.01
FIGURE 3. Best regression line for LSAT/UGPA data, r = −0.44
5
LSAT score users should not expect to find perfect correlations between LSAT scores and the law school performance criterion. Many factors other than the acquired academic skills measured by the LSAT contribute to academic achievement. In addition, there is a certain amount of measurement error inherent in the test. When test scores and UGPAs are factors that influence the admission process, the range among admitted students becomes restricted relative to the applicant pool. The issue of restricted range draws our attention to the behavior of both the selected and unselected groups. The selected group comprises the students for each school who have been admitted and have an FYA. This group tends to be more homogeneous than the entire applicant pool. The selected group also tends to exhibit less variance in both predictor variables. The unselected group comprises the students for each school who applied to a particular school during the relevant application years. Not all of these students have an FYA because not all of them were admitted to a particular law school. A common observation of higher validity coefficients with the unselected group will also be examined in this report. Further, because the UGPA is influenced by factors such as the leniency of the graders, the rigor of the curriculum represented by the grades, and the students’ motivation and application, UGPA also should not be expected to be a perfect predictor. In fact, experience shows UGPA alone typically to be a fairly poor predictor of academic achievement in law school.
Results Summary Data Descriptive statistics for schools participating in the 2009 and 2010 LSAT Correlation Studies are presented in Table 1. These data confirm that the average sample size for each correlation study is quite large. The size of the samples is primarily a consequence of including the most recent 3 years of student data in the study when it is available; however, 3 years of data are not always available, and therefore not all of the studies included in this report include 3 years of accumulated data. Schools participating for the first time may only be able to provide data for 1 year. More commonly, the correlation study is based on a single year of data when a school introduces a grading-scale change. As evidenced by the minimum sample size of 142, even when only 1 year of data is available for analysis, the sample sizes are large enough to produce stable least-squares regression results. The advantage gained from using 3 years of data is found in the stability of the weights applied to the two predictor variables rather than in the magnitude of the correlation coefficients. The data in Table 1 show that the mean and median LSAT scores of enrolled students were slightly lower for the 2010 versus the 2009 LSAT Correlation Studies. The standard deviation increased slightly from 2009 to 2010. Stilwell et al. (2009) reported LSAT mean (standard deviation) values of 156.88 (5.44) for the 2007 LSAT Correlation Studies and 156.79 (5.58) for the 2008 LSAT Correlation Studies. The mean and median UGPAs reported in Table 1 are approximately equal for 2009 and 2010, and these values are also similar to those observed for earlier correlation studies. The range of average LSAT scores across
6
schools is fairly substantial, varying from a low mean of 144.38 for the 2009 LSAT Correlation Studies to a high mean of 170.48 for the 2009 LSAT Correlation Studies. The size of the range is approximately equal for 2009 and 2010, but narrower than that observed by Stilwell et al. (2009). The range and standard deviation of mean LSAT scores reported in Table 1 suggest that the differing characteristics of law schools are well represented in this report. TABLE 1 a Descriptive statistics for 170 schools participating in the 2009 and 2010 LSAT Correlation Studies Study Period Variable Sample size
Statistic
2009
2010
576.04 282.96
603.08 289.71
142 2,029
197 2,431
406 518 691
427 540 698
Mean SD Range
156.68 5.05
156.60 5.09
Minimum Maximum Percentiles 25th 50th (median) 75th
144.38 170.48
144.94 170.24
153.00 156.23 160.07
153.01 156.17 159.89
Mean SD Range
3.38 0.17
3.38 0.17
Minimum Maximum Percentiles 25th 50th (median) 75th
2.93 3.77
2.93 3.78
3.28 3.38 3.50
3.28 3.38 3.50
Mean SD Range Minimum Maximum Percentiles 25th 50th (median) 75th
LSAT
UGPA
a
Of the 173 schools that participated for both years, 3 were omitted from this study based on evidence suggesting that preselection effects distorted their results.
7
Correlation Coefficients As discussed earlier, the correlation between predictor and criterion provides an indication of the usefulness of the predictor(s). The correlations presented in Table 2 show that for each of the study years, LSAT score is a substantially better predictor of first-year performance in law school than is UGPA. The data also show that the combination of LSAT score and UGPA provides better prediction than either predictor alone. These results are consistent with findings from earlier LSAT validity summary reports (Anthony et al., 1997, 1999; Diamond-Dalessandro et al., 2005; Evans, 1982; Schrader, 1976; Stilwell et al., 2005, 2007, 2009; Thornton et al., 2005; Wightman, 1993). TABLE 2 Summary correlations between and among predictor and criterion variables for law schools participating in the 2009 and 2010 LSAT Correlation Studies: Selected first-year student results Percentiles
Range
Year
Mean
SD
25th
50th
75th
Minimum
Maximum
Zero-Order Correlations LSAT/FYA 2009 2010
0.36 0.36
0.08 0.07
0.31 0.31
0.35 0.36
0.42 0.42
0.04 0.16
0.56 0.56
2009 2010
0.29 0.28
0.07 0.07
0.24 0.23
0.29 0.28
0.34 0.33
0.07 0.09
0.52 0.45
2009 2010 Multiple Correlations
−0.06 −0.06
0.13 0.13
−0.15 −0.14
−0.04 −0.05
0.02 0.02
−0.56 −0.56
0.22 0.21
0.47 0.47
0.07 0.06
0.43 0.43
0.47 0.47
0.52 0.52
0.25 0.30
0.62 0.62
Variables
UGPA/FYA LSAT/UGPA
LSAT & UGPA/FYA
2009 2010
Comparing the 2009 and 2010 correlation values for each combination of variables reveals that the size of the median correlation coefficients is virtually identical for both years. This consistency is attributable partly to the amount of overlap in the data resulting from the accumulation of 3 years of data for each study by most participating schools. The magnitude of the median correlations between LSAT score and FYA is slightly higher than that reported for the 2007 and 2008 LSAT Correlation Studies. The median correlation between UGPA and FYA is consistent with that reported previously. That is, Stilwell et al. (2009) reported median validity coefficients (correlations) of 0.32 for LSAT score for 2007 and 0.33 for LSAT score for 2008, and 0.28 for UGPA for 2007 and 0.29 for UGPA for 2008. Stem and leaf plots provide a graphical illustration of the correlation coefficients reported in Table 2. Six separate stem and leaf plots are provided in Figures 4 and 5. Separate plots are provided for each of the predictor combinations of LSAT score and UGPA combined, LSAT score alone, and UGPA alone, in that order, across each row. Figures 4 and 5 show the separate distributions for 2009 and 2010, respectively. The stem (the left column of each plot) is the first digit of the correlation coefficient. The leaf (the row of numbers separated from the stem by a single space) shows the second digit of the correlation coefficient for each school that produced a correlation coefficient in the
8
group defined by the stem. For example (see the 2009 data in Figure 4), in the stem group between 0.55 and 0.59 on the plot of correlation coefficients resulting from the combined LSAT score and UGPA predictors, seven schools had correlation coefficients of 0.55. Thus, seven 5’s are printed in the row across from the 5. Likewise, the two 6’s represent the schools that had correlation coefficients of 0.56, the five 7’s represent the schools that had coefficients of 0.57, and so on. Notice that there are two rows that begin with a 5. The leaves in one row range from 0.50 to 0.54; the leaves in the other row range from 0.55 to 0.59. This pattern holds for every pair of rows in the figures. The right-hand column of each plot shows the number of schools represented in each stem and leaf (row) of the plot. If the stem and leaf plot is rotated 90º to the left, it can be viewed as a histogram of the distribution of correlation coefficients. Examination of the stem and leaf plots reveals that the coefficients are not widely variable across schools and the histograms are very peaked. Looking across the three plots within a single year affords an informative picture of the usefulness of the different predictors in providing information about first-year performance in law school. The correlation coefficients derived from the combined predictors are concentrated at the highest section of the plot because the combined predictors produce the highest correlation with FYA. Moving from top to bottom on the page, the concentration of correlation coefficients steps down the stem axis, indicating slightly lower correlations resulting from using LSAT score alone, and considerably lower correlations resulting from using UGPA alone. The stepdown pattern is consistent across each of the 2 years of study and, of course, is consistent with the summary data reported in Table 2. Individual schools might want to locate their own correlation coefficient on each of the three stem and leaf plots for the relevant study year. By marking or circling their own coefficient, the schools will have an indication of how well the predictor or combined predictors are working for them relative to other law schools. This information needs to be evaluated in the context of other pertinent information, particularly the variability of the predictor(s) in the entering class(es) upon which the analyses are based and the correlation between LSAT score and UGPA for members of the analysis class(es). The impact of each of these factors is discussed in later sections of this report.
9
Variable=LSAT and UGPA combined Stem Leaf 6 6 00000222 5 555555566777778899 5 00000011111111111122233333333444444 4 5555555566666666777777777777778888888889999999999 4 0000000011111222222222223333333333444444444 3 57777899999999 3 4 2 57 2 1 1 0 0 Variable=LSAT alone Stem Leaf 6 6 5 6 5 00233 4 55555667788999 4 0001111111222223333333333444444444 3 55555555566667777777788888888899999 3 00000011111111222222222222333333333344444444444 2 555577778888889999 2 123333334444 1 569 1 0 0 4 Variable=UGPA alone Stem Leaf 6 6 5 5 2 4 56 4 0000001233 3 555555666666677777788899 3 000000000001111122222222222333333333444444 2 55555555566666666677777777778899999999 2 0000011111112222223333333444444444444 1 5566678999999 1 34 0 7 0
# 8 18 35 49 43 14 1 2
#
1 5 14 34 35 47 18 12 3
1
#
1 2 10 24 42 38 37 13 2 1
Note. Multiply Stem.Leaf by 0.1.
FIGURE 4. Stem and leaf plots for prediction of FYA from LSAT score and UGPA in combination and alone, 2009 LSAT Correlation Study data
10
Variable=LSAT and UGPA combined Stem Leaf 6 6 0112 5 55555666778888999 5 00000001111122222222333333333444444 4 55555555566666666666777777788888888888899999999999999999 4 00011111222222222222223333333334444444444 3 55567777889999 3 033 2 2 1 1 0 0 Variable=LSAT alone Stem Leaf 6 6 5 6 5 03 4 5555555566666778899 4 0000000000011111112222222222333333344444 3 5555555556666667777788888889999999 3 001111111222222222333344444444444444 2 555566677778888888999999999 2 223344 1 68889 1 0 0
# 4 17 35 56 41 14 3
#
1 2 19 40 34 36 27 6 5
Variable=UGPA alone Stem Leaf 6 6 5 5 4 55 4 0000124 3 555555666667777777778888889 3 0000000011111111122222222223333344444 2 555555555555666666777777778888888999999999 2 000000001111222223333333444444444 1 556667778888999999 1 023 0 9 0 ___________________________________________________________ Note. Multiply Stem.Leaf by 0.1.
#
2 7 27 37 42 33 18 3 1
FIGURE 5. Stem and leaf plots for prediction of FYA from LSAT score and UGPA in combination and alone, 2010 LSAT Correlation Study data
11
Factors Influencing the Magnitude of the Correlation Coefficients The correlation coefficients reported in Table 2 most likely are an underestimate of the true validity of the test. That is, the correlations are based on LSAT scores, UGPAs, and FYAs only for those students who were accepted to and attended the studied law school. Most applicants with low test scores and low UGPAs are not admitted and thus there are no FYAs for them. As a consequence, those applicants cannot be included in the study. Because there is less variability in the scores of admitted students than in the scores of all applicants, correlations are smaller than they would have been had the class been admitted randomly from the total applicant pool. Thus, correlations obtained from matriculated students tend to underestimate the true validity of the test. Even so, they are the best information we have available, and even as underestimates they are quite reputable. Two sets of correlations are used for our correlation studies: the correlations for the matriculant study group and the correlations for the applicant pool group. In this study, complete data for LSAT, UGPA, and FYA are available for the matriculant study group, and Pearson correlations can be calculated between pairs of variables. Within the larger applicant pool group, only the admitted applicants who enroll full time and complete their first year (i.e., matriculants) will have FYA data. To estimate the correlation coefficients with FYA for the entire applicant group, a statistical adjustment for restriction of range is applied to the data that are available for the group of students who matriculate. The applicant pool correlations are adjusted based on Pearson–Lawley formulas. Beginning with the 2010 LSAT Correlation Studies, Pearson–Lawley formulas were applied to produce the applicant pool correlations. For the purposes of this report, this same adjustment has been applied to both the 2009 and 2010 data to allow comparisons between the two study years. However, comparison of these results to previous replications of this report that covered study years prior to 2009 could be misleading since they were based on a different statistical method. Table 3 presents estimated and actual correlation coefficients for the unselected population of applicants. As expected, the validity coefficients are consistently higher for the unselected group than for the selected group represented in Table 2. For example, a comparison of the selected and unselected groups for the 2009 and 2010 study years shows that the validity coefficients for LSAT/FYA increased 0.22 for both years. Between the 2 study years, the minimum and maximum values of the correlation coefficients for each combination of variables tended to be stable. For example, in 2009 the range of the correlation coefficient for UGPA/FYA was 0.29–0.69. In 2010, the range was 0.31–0.64. For each combination of variables, the mean and median values of the validity coefficients tended to be similar, if not equal. In 2009 and 2010, mean LSAT/UGPA correlation coefficients of 0.25 and 0.26, respectively, were observed. Median LSAT/UGPA correlation coefficients were 0.24 (2009) and 0.25 (2010).
12
TABLE 3 Summary correlations between and among predictor and criterion variables for law schools participating in the 2009 and 2010 LSAT Correlation Studies: Unselected results Percentiles
Range
Mean
SD
25th
50th
75th
Minimum
Maximum
2009 0.58 2010 0.58 a UGPA/FYA 2009 0.44 2010 0.44 b LSAT/UGPA 2009 0.25 2010 0.26 a Adjusted for restriction of range. b Based on all applicants.
0.06 0.06 0.06 0.06 0.06 0.06
0.54 0.55 0.40 0.40 0.21 0.22
0.58 0.58 0.44 0.44 0.24 0.25
0.62 0.63 0.47 0.48 0.29 0.29
0.40 0.42 0.29 0.31 0.11 0.12
0.71 0.73 0.69 0.64 0.40 0.41
Variables
Year a
LSAT/FYA
In addition to the problem of reduced variability, matriculated students include some who are admitted as a result of a special consideration. That is, some students with low test scores or low UGPAs are admitted to law school, but usually they are not typical of the low-scoring applicants who are rejected. Instead, they are admitted because the school has some other evidence of their ability to do well in law school. Law schools that practice this type of admission are following what is frequently referred to as a compensatory admission model. This model allows, for example, a high LSAT score to compensate for a low UGPA or, conversely, a high UGPA to compensate for a low LSAT score when schools are making admission decisions. One way to determine whether a compensatory admission model for LSAT scores and UGPAs is in place at a particular law school is to look at the correlation between LSAT score and UGPA. In a random group of applicants, this correlation would be fairly high, indicating that applicants with high LSAT scores also had high UGPAs, while applicants with low LSAT scores also had low UGPAs. When a compensatory admission model is used, the correlation between LSAT score and UGPA frequently is negative because a large number of students with high LSAT scores have low UGPAs and vice versa. The average correlations between LSAT score and UGPA reported in Table 2 are close to 0. Across the 2 years, the correlations range from −0.56 to 0.22, suggesting that a number of law schools are to some degree employing a compensatory admission model. The data presented in Table 4 show the effect of employing this model on the estimates of the validity coefficients. Schools that rely heavily on a compensatory admission model tend to have negative correlations between LSAT score and UGPA and are represented in the rows labeled “Less than 0” in Table 4. For the 2009 study year, 66% of schools fell into this category; for the 2010 study year it was 65%. The data show that the correlations for either predictor alone and for the two predictors combined are consistently higher for schools where the correlation between LSAT score and UGPA is positive. For example, looking at the 2010 LSAT Correlation Study data, the average correlation between LSAT score and FYA is 0.33 for schools that have a negative correlation between LSAT score and UGPA, but it increases to 0.38 for schools that show a positive correlation greater than 0.2 between those variables. A similar pattern exists for UGPA alone and for LSAT score and UGPA combined. The pattern is evidenced across both years. In a previous report, Stilwell et al. (2009) observed that 131 of 165 schools (79%) fell into the “Less than 0” category in 2007, and 121 of 165 (73%) fell into this category in 2008. 13
TABLE 4 Average correlations of LSAT scores and UGPA with FYA in law schools, grouped by the correlation between LSAT score and UGPA Predictor Variables Year 2009
2010
Correlation of LSAT with UGPA Less than 0 (number of schools)
LSAT & UGPA Combined 0.45 (113)
LSAT Alone 0.33 (113)
UGPA Alone 0.26 (113)
0.0 to 0.2 (number of schools)
0.52 (55)
0.41 (55)
0.34 (55)
Greater than 0.2 (number of schools) Less than 0 (number of schools)
0.53 (2) 0.45 (110)
0.39 (2) 0.33 (110)
0.42 (2) 0.25 (110)
0.0 to 0.2 (number of schools)
0.51 (58)
0.40 (58)
0.33 (58)
Greater than 0.2 (number of schools)
0.51 (2)
0.38 (2)
0.41 (2)
One observation of note from the data presented in Table 2 is that the range of correlation coefficients for any of the prediction models varies substantially from law school to law school. For example, the correlations between LSAT score and FYA vary from a low of 0.04 to a high of 0.56. The cause of this amount of variation in what should be expected to be a stable environment was studied extensively by Linn (e.g., Linn, 1982; Linn, Harnish, & Dunbar, 1981). In analyzing the validity summary data reported by Schrader (1976), Linn determined that as much as 34% of the variance in observed validities could be predicted from observed standard deviations and variances of the LSAT scores. That is, the larger the variation (range) in the predictor, the higher the correlation with the criterion. Because so much variation is observed in the correlation coefficients for the validity studies summarized in this report, Linn’s procedures were replicated using data from the 2009 and 2010 LSAT Correlation Studies. For each study year, the multiple correlations between the observed validities and observed standard deviations and variances of the LSAT scores were calculated. (Recall that the variance is equal to the square of the standard deviation.) Similarly, the same calculations were made using observed standard deviations and variances of UGPA as well as the combined LSAT score and UGPA standard deviations and variances. The results are presented in Table 5. The amount of variance in observed validities predicted by the LSAT scores is similar to the results reported by Linn. For the 2009 data, 36% of the variance (0.602) is accounted for, and for the 2010 data, 35% of the variance (0.592) is accounted for. These values are higher than those reported by Stilwell et al. (2009) for 2007 (35%, or 0.592) and 2008 (27%, or 0.522), and this difference may be attributable to the tighter LSAT distributions observed in this study. For LSAT score alone and for LSAT score and UGPA combined, there is a substantial relationship between variability among validity coefficients across law schools and variability in the predictors within law schools. In contrast, the variance in UGPA
14
accounted for approximately 10% of the variance in the UGPA validity coefficient for 2009 and about 8% of the variance in the UGPA validity coefficient for 2010. Even so, the relationship between validity and UGPA variability is larger than the 0.05 correlation reported by Linn and Hastings (1983). TABLE 5 Multiple correlations of validity coefficients with standard deviations and variances of predictor variables
Year 2009 2010
LSAT Alone 0.60 0.59
Predictor UGPA Alone 0.31 0.29
LSAT & UGPA Combined 0.53 0.56
Cross-Validation Studies A primary purpose of conducting validity studies for most schools is to obtain the best possible prediction weights so that they can be applied to the application credentials of the next year’s applicant pool to aid in the decision process. That is, data from past experience are used to make future predictions. When the results from the correlation studies are used in this way, the most relevant question to ask is: How well do the equations from previous first-year classes predict the performance of future firstyear classes? To answer this question, a cross-validation study was conducted. Specifically, the prediction equations calculated from the 2009 LSAT Correlation Studies (i.e., the 2006–2008 first-year class data) were used to predict an FYA for each member of the 2009 fall first-year class. Then, the correlation between the predicted FYA and the actual FYA earned by the members of the 2009 fall entering class was calculated. These calculations were performed separately for each school, using each school’s unique least-squares prediction model. The results of these cross-validations (Table 6) are similar to the correlation coefficients reported in Table 2. When the equations from the immediately preceding year were used to predict FYA, the correlation between predicted and actual FYA exceeded 0.4 for approximately 80% of the schools. These results are similar to the results reported in previous studies The following studies reported on the percentage of schools that exceeded the correlation coefficient of 0.4, as follows:
Evans (1982), 1977, 1978, and 1979 LSAT Correlation Studies: 73%, 74%, and 82% of schools, respectively
Wightman (1993), summary of the 1990–1992 LSAT Correlation Studies: 86% of schools
Anthony et al. (1997), summary of the 1995 and 1996 LSAT Correlation Studies: 75% of schools
15
Anthony et al. (1999), summary of the 1997 and 1998 LSAT Correlation Studies: slightly more than 82% of schools
Thornton et al. (2005), summary of the 1999 and 2000 LSAT Correlation Studies: more than 81% of schools
Stilwell et al. (2005), summary of the 2001 and 2002 LSAT Correlation Studies: more than 82% of schools
Diamond-Dalessandro et al. (2005), summary of the 2003 and 2004 LSAT Correlation Studies: more than 70% of schools
Stilwell et al. (2007), summary of the 2005 and 2006 LSAT Correlation Studies: more than 68% of schools
Stilwell et al. (2009), summary of the 2007 and 2008 LSAT Correlation Studies: more than 77% of schools
TABLE 6 Cross-validated multiple correlations for 2009 prediction equations using 2010 class data Correlations Between Actual FYA and Predicted FYA Mean SD Range Minimum Maximum Percentiles 25th 50th 75th Percentage > 0.4
2009 Equations Using 2010 Class Data 0.46 0.08 0.21 0.67 0.41 0.46 0.52 80.00
Accounting for Variance The data in Table 2 show that the best model for predicting FYA is consistently the model that combines LSAT score and UGPA, where best model is defined as the model that provides the highest correlation between the predictors and the criterion. On average, LSAT score accounts for more of the variance predicted by the model than does UGPA, although there are some schools for which this is not the case. As shown in Table 7, the mean variance accounted for by LSAT score was approximately 55%, and the mean variance accounted for by UGPA was approximately 45% for 2009 and 2010. Another way of interpreting the percentage of variance accounted for is to look at the relative weights of the two predictors. That is, LSAT score is weighted 55% and the UGPA 45% on average in order to obtain optimal prediction of FYA. The percentage of
16
variance accounted for by LSAT score and by UGPA can vary considerably for individual schools. The variability of LSAT scores and UGPAs, the correlation between LSAT score and UGPA, and the amount of variability in the FYAs all influence the amount of variance that will be accounted for by the two predictor variables in the model that provides optimal prediction of FYA. In the results presented here, the mean proportion of variance accounted for by LSAT score was similar to values observed in previous studies. TABLE 7 Summary of percentage of variance accounted for by predictor variables in multiple regression prediction equations Range
Percentiles
Variable LSAT
Year 2009 2010
Mean 54.92 55.52
SD 6.65 6.50
Min 30.90 34.32
Max 81.51 78.69
25th 51.43 51.58
50th 54.75 55.87
75th 59.40 59.46
UGPA
2009 2010
45.08 44.48
6.65 6.50
18.49 21.31
69.10 65.68
40.60 40.54
45.25 44.13
48.57 48.42
Trends Over Time The data presented in Tables 2–7 suggest that the results from the validity studies conducted for each of the 170 law schools that participated in the two most recent study cycles are very consistent with each other. Table 8 provides analyses to examine data consistency across years more specifically. The average difference between validity coefficients of studies conducted for 2009 and 2010 is very close to 0. Additionally, the distribution of differences is fairly tight, as evidenced by the difference values that mark the 25th and 75th percentiles. Again, these results are somewhat influenced by the inclusion of 3 years of data. For each subsequent year, the oldest data year is dropped and the most recent is added. Although this data design will minimize the influence of individual anomalies, systematic shifts in the data over time would be evidenced should they occur. The data reported in this study indicate that a reduction in the variability of LSAT scores has resulted in a suppression of the correlation between LSAT score and FYA. However, LSAT score alone is still a stronger predictor of FYA compared to UGPA alone, and the combination of LSAT score and UGPA is an even more superior predictor of FYA than either variable alone. TABLE 8 Average size of year differences in validity coefficients by type of prediction model: 2009–2010 Differences
LSAT & UGPA Combined
LSAT Alone
UGPA Alone
Mean SD Percentiles 25th 50th 75th
0.00 0.03
0.00 0.04
0.01 0.04
−0.02 0.00 0.02
−0.03 −0.01 0.02
−0.02 0.00 0.03
17
Conclusion This national summary of the 2009 and 2010 LSAT Correlation Studies lends continued support for the validity of LSAT scores in the law school admission process. Major findings from this study are summarized as follows:
The combination of LSAT score and UGPA is a useful predictor of academic performance in the first year of law school. The average multiple correlation between FYA in law school and the combined predictors of LSAT score and UGPA is 0.47 for both 2009 and 2010 study years. This value is high, and it is similar to multiple correlation coefficients reported for previous correlation study years. As has always been the case, these combined predictors continue to be superior to either predictor alone for predicting FYA.
LSAT score alone continues to be a better predictor of law school performance than UGPA alone. The median validity for LSAT score alone is 0.35 for 2009 and 0.36 for 2010, compared to mean validity values of 0.29 for 2009 and 0.28 for 2010 for UGPA alone.
When schools are grouped by the correlation between LSAT score and UGPA, the validity coefficients increase when the correlations between the predictors increase. This relationship provides some indication of the impact of the restriction of range resulting from using only matriculated students on the estimates of validity, particularly in schools that are using a compensatory admission model.
A substantial amount of the variability in validity coefficients obtained among different law schools is directly attributable to the amount of variation in LSAT scores and UGPAs in the data used to estimate the validity.
Cross-validation studies support the use of regression equations based on previous first-year classes to predict future performance of law school applicants.
References Anthony, L. C., Duffy, J. R., & Reese, L. M. (1999). Predictive validity of the LSAT: A national summary of the 1997–1998 Correlation Studies (LSAT Technical Report 99-01). Newtown, PA: Law School Admission Council. Anthony, L. C., Harris, V. F., & Pashley, P. J. (1997). Predictive validity of the LSAT: A national summary of the 1995–1996 Correlation Studies (LSAT Technical Report 97-01). Newtown, PA: Law School Admission Council.
18
Diamond-Dalessandro, S. P., Stilwell, L. A., & Reese, L. M. (2005). Predictive validity of the LSAT: A national summary of the 2003–2004 Correlation Studies (LSAT Technical Report 05-02). Newtown, PA: Law School Admission Council. Evans, F. R. (1982). Recent trends in law school validity studies (LSAC-82-1). In Law School Admission Council, Reports of LSAC sponsored research: Volume IV, 1978– 1983 (pp. 347–361). Newtown, PA: Law School Admission Council. Linn, R. L. (1982). Admissions testing on trial. American Psychologist, 37, 279–291. Linn, R. L., Harnish, D. L., & Dunbar, S. B. (1981). Validity generalization and situational specificity: An analysis of the prediction of first-year grades in law school. Applied Psychological Measurement, 5, 281–289. Linn, R. L., & Hastings, C. N. (1983). A meta analysis of the validity of predictors of performance in law school (LSAC-83-1). In Law School Admission Council, Reports of LSAC sponsored research: Volume IV 1978–1983 (pp. 507–544). Newtown, PA: Law School Admission Council. Schrader, W. B. (1976). Summary of law school validity studies, 1948–1975 (LSAC-76-8). In Law School Admission Council, Reports of LSAC sponsored research: Volume III, 1975–1977 (pp. 519–550). Princeton, NJ: Law School Admission Council. Stilwell, L. A., Diamond-Dalessandro, S. P., & Reese, L.M. (2005). Predictive validity of the LSAT: A national summary of the 2001–2002 Correlation Studies (LSAT Technical Report 03-01). Newtown, PA: Law School Admission Council. Stilwell, L. A., Diamond-Dalessandro, S. P., & Reese, L. M. (2007). Predictive validity of the LSAT: A national summary of the 2005–2006 Correlation Studies (LSAT Technical Report 07-02). Newtown, PA: Law School Admission Council. Stilwell, L. A., Diamond-Dalessandro, S. P., & Reese, L. M. (2009). Predictive validity of the LSAT: A national summary of the 2007–2008 Correlation Studies (LSAT Technical Report 09-03). Newtown, PA: Law School Admission Council. Thornton, A. E., Suto, D., Anthony, L. C., & Liu, M. (2005). Predictive validity of the LSAT: A national summary of the 1999–2000 Correlation Studies (LSAT Technical Report 01-02). Newtown, PA: Law School Admission Council. Wightman, L. F. (1993). Predictive validity of the LSAT: A national summary of the 1990–1992 Correlation Studies (LSAC Research Report 93-05). Newtown, PA: Law School Admission Council.
19