Long-term Issues for Fiscal Sustainability in Emerging Asia Masahiro Kawai and Peter J. Morgan Asian Development Bank Institute ADBI-MoF (PRI) Conference “Fiscal Rule or Fiscal Crisis?: Challenges to Fiscal Consolidation from a Global Perspective” Tokyo, 17 January 2013
Outline I. Objectives of study II. Current fiscal conditions in emerging Asia III. Fiscal expenditure management issues in emerging Asia IV. Fiscal sustainability challenges in emerging Asia V. Conclusions 2
I. Objectives of Study • Identify long-term issues of fiscal sustainability
risk for emerging Asian economies
Subsidies Infrastructure investment Aging and social welfare benefits Contingent liabilities Interest rate repression/banking sector exposure
• Recommend policies to reduce sustainability
risk Improve balance of revenues and expenditures More explicit fiscal rules Stronger fiscal surveillance at the regional level 3
II. Current Fiscal Conditions in Emerging Asia • Review of recent experience Asian financial crisis and global financial crisis experiences Current fiscal balance and debt levels
• Composition of revenues and expenditures by country • Near-term sustainability analysis • Identification of issues for long-term sustainability and classification of countries
Subsidies Infrastructure investment Aging and/or social benefit increases Contingent liabilities Interest rate repression / banking sector exposure 4
Asian financial crisis experience • Excess private demand, not fiscal profligacy, was source of current account imbalances in crisis countries (Indonesia, Korea, Malaysia, Thailand) • Rise in fiscal deficits during crisis period reflected combination of: Higher interest rates Cyclically weak domestic demand Banking sector recapitalization (esp. Indonesia and Thailand)
• Fiscal balances were restored relatively quickly via devaluation-induced economic recoveries and fiscal retrenchment, while debt ratios were contained Only Indonesia saw government debt ratio rise to 100% of GDP 5
Fiscal balances in Asian crisis-affected countries improving, while India’s not
Source: ADB Statistical Database System
6
Government debt ratios in Asian crisisaffected countries generally well-behaved
Source: IMF World Economic Outlook Database
7
Global financial crisis experience • A number of Asian countries implemented expansionary fiscal policy to offset sharp drop in import demand from advanced economies • Absence of domestic financial crises meant call on fiscal resources more limited than elsewhere • Prudent fiscal management after the Asian financial crisis meant most economies had plenty of fiscal space • Fiscal balances improved rapidly, with relatively modest accumulation of government debt Only India’s debt level remains above 60% of GDP Less positively, interest rate repression contributed significantly to debt improvement
8
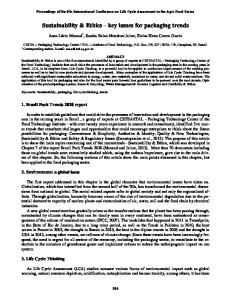
Interest rate repression a major contributor to debt stability in Asia %
Emerging Asia
10 8 6 4 2 0 -2 -4 -6 -8
Real effective interest rate (r)
Real GDP growth (g)
Source: IMF, Fiscal Monitor (Oct. 2012)
9
Interest rate–growth differential (r–g)
VNM
PRC
THA
IDN
HKG
IND
SNG
MYS
KOR
PHL
-10
Composition of expenditures and revenues • Expenditures Many low income economies have low investment rates in infrastructure Social sector-related expenditures tend to grow rapidly with income
• Revenues As expenditures tend to rise more than proportionately with income, adequate revenue sources must be generated to cover this Many low income countries have narrow revenue bases Greater reliance on indirect taxes (VAT or GST) could increase revenues in a relatively non-distorting way 10
Composition of expenditures by country
Note: Japan social protection is general government basis Source: ADB Statistical Database System 11
Balanced composition of revenues desirable Composition of Tax Revenue, % of total revenue, 2010
Taxes on goods and Country services PRC
Taxes on income, profits and Taxes on capital internatio gains nal trade
Other taxes
Tax revenue (% of GDP)
58.9
24.6
3.7
1.2
10.5
8.5
35.8
0.4
16.1
13.5
India
23.3
47.0
12.8
0.1
9.7
Indonesia
29.4
36.5
4.8
4.1
10.9
Japan
34.4
39.9
1.4
4.1
16.8
Korea
26.7
28.1
4.0
8.0
15.1
Malaysia
16.7
45.6
4.1
3.9
13.8
Philippines
26.8
42.1
19.5
--
12.3
Singapore
25.3
34.4
--
17.4
14.1
Thailand
39.4
38.0
4.4
0.6
17.6
Hong Kong, China
Note: PRC, 2009; Philippines, Singapore and Thailand, 2011. Source: World Bank WDI, available at: http://databank.worldbank.org/ddp/home.do?Step=1&id=4, accessed 15.01.2013, and OECD
Source: World Bank World Development Indicators
12
Near-term sustainability analysis Progress in Fiscal Consolidation through 2013 (Percent of GDP) Benchmark: Adjustment to Stabilize Debt 1 CAPB needed to stabilize debt 1 PRC India Indonesia Korea Malaysia Philippines Thailand
-0.3 1.8 0.2 -0.4 1.2 -0.2 1.4
CAPB change, 2009–13 2.8 0.7 -0.6 2.1 2.1 0.8 -1.7
Further adjustment needed
Progress through 20132
-1.1 6.9 0.8 -4.4 3.0 -0.8 4.2
Source: IMF Fiscal Monitor, Oct. 2012. 1 The cyclically adjusted primary balance (CAPB) needed to stabilize debt is the CAPB required in 2020 to allow the debt-to-GDP ratio to return to 2011 levels by 2030, based on the methodology and interest rate-growth differential assumptions used in Statistical Tables 13a and 13b. 2
Progress is visually portrayed as share of total adjustment; an empty circle means that no substantial progress is projected to materialize until end-2013, and a completely darkened circle means that the target is projected to be met by 2013.
13
Issues for long-term sustainability and classification of countries • Subsidies (PRC, India, Indonesia, Philippines) • Infrastructure investment (Indonesia, India, Philippines) • Social sector protection spending: Aging and/or social welfare benefit increases (PRC, Hong Kong, Korea, Singapore, Taipei,China, Thailand) • Contingent liabilities (PRC, India, Indonesia, Viet Nam) • Interest rate repression (potential ending) (PRC, India, Indonesia, Thailand, Viet Nam) 14
III. Fiscal Expenditure Management Issues in Emerging Asia • Subsidies • Infrastructure investment • Social sector protection
15
Subsidies large in India, Indonesia, Malaysia and Philippines Asian Food and Fuel Subsidy Programs % of Total % of GDP Total Subsidy Expenditure PRC 1.9 9.5 India 4.1 Indonesia 2.9 13.7 Korea 0.4 1.5 Malaysia 3.3 13.0 Philippines 3.6 4.3 Taipei,China 1.3 6.8 Thailand 0.9 2.5 Source: CEIC Database Co., UOB. 16
Fuel 1.5 1.6 2.7 0.4 2.6 0.2 1.3 0.8
Food 0.4 2.5 0.2 0.0 0.7 3.4 0.0 0.1
Infrastructure investment levels diverge widely within Asia Infrastructure investment, % of GDP 0–4% 4–7% More than 7% Cambodia Lao PDR PRC Indonesia Mongolia Thailand Philippines India Viet Nam Sources: ADB, JBIC, World Bank (2005), FICCI (2012) Note: GDP means gross domestic product.
17
Measures to encourage infrastructure investment • Financial market development Promotion of local-currency bond market as source of long-term financing
• Promotion of public-private partnerships (PPP) Develop legal and financial infrastructure for this, including risk- and revenue-sharing arrangements
• Encourage cross-border investment Asian infrastructure fund Sovereign wealth funds Intra-regional market integration
18
Asian infrastructure investment needs estimated at $8.3 trillion (2010-2020) Sector/Subsector
Energy (Electricity) Telecommunications Transport Airports Ports Railways Roads Water & Sanitation Water Sanitation Total
National Infrastructure New ReplaceSum Capacity ment 3,176.4 325.4 1,761.7 6.5 50.3 2.7 1,702.2 155.5 47.6 107.9 5,418.9
912.2 730.3 704.5 4.7 25.4 35.9 638.4 225.8 106.2 119.6 2,572.8
4,088.6 1,055.7 2,466.1 11.3 75.7 38.6 2,340.5 381.3 153.8 227.5 7,991.7
Source: ADB and ADBI, Infrastructure for a Seamless Asia (2009)
Crossborder Infrastructure
Total
82.4 -204.6
4,171.0 1,055.7 2,670.8
--
381.3
287.0
8,278.7
Social sector protection • Demographic trends • Social safety net coverage and benefit levels
Pensions Health Unemployment Income transfer
• Implications for fiscal sustainability: Identification of countries with relatively high risk
20
History/projections of dependency ratio (age 65+/age 15-64)—highest in the Asian NIEs, followed by PRC and Thailand 70
60
PRC Hong Kong,China
50
India
Indonesia Japan
40
Korea Malaysia
30
Philippines Singapore
20
Thailand Taipei,China
10
Viet Nam 0 1990
1995
2000
2005
2010
2015
2020
2025
2030
2035
2040
2045
2050
Sources: World Population Prospects: The 2010 Revision of the United Nations Population Division, available at: http://data.un.org/Data.aspx?q=dependency+ratio&d=PopDiv&f=variableID%3a44 and Council for economic planning and development (Taipei,China), available at: http://www.cepd.gov.tw/encontent/m1.aspx?sNo=0001457, accessed 28.12.2012
21
Coverage of the social safety net rises rapidly in line with per capita income
Note: SPCOV is aggregate indicator of coverage of social protection programs Source: ADB (2008) 22
Social insurance expenditures show a broad range in terms of GDP share 0
2
4
Percent of GDP 6 8
Japan Uzbekistan Kyrgyzstan Mongolia Rep. of Korea Sri Lanka Bangladesh PRC Kazakhstan Armenia Viet Nam India Malaysia Philippines Indonesia Pakistan Cambodia Lao Peoples… Tajikistan
10
12
14
Social insurance Social assistance Labour market Micro area based Child protection
Source: ADB (2008)
23
16
Social protection expenditures (% of GDP) rise sharply with income levels
Source: ADB (2008), CEIC Data Co.
24
Identification of countries with relatively high medium-term fiscal sustainability risk • Subsidies (3% or more of GDP)
Indonesia India Malaysia Philippines
• Demographic and social welfare coverage Asian NIEs: Hong Kong, Korea, Singapore, and Taipei,China PRC, Thailand (later)
25
Policy recommendations to reduce medium-term fiscal risk • Subsidies Phase out subsidies and replace with targeted income support programs
• Investment Encourage PPP investment Reduce reliance on contingent liabilities, e.g., loss-sharing arrangements
• Aging and social welfare coverage increase
Increase premiums, and ensure obligatory premium payments Increase retirement age Cut benefits (replacement ratio) Means testing Taxation of benefits (if not done already) Shift from defined benefits to defined contributions 26
IV. Fiscal Sustainability Challenges in Emerging Asia • Contingent liabilities (PRC) • Potential end of interest rate repression and bank exposure to government debt • Role of fiscal rules • Role of debt management office • Regional fiscal surveillance 27
Estimate of PRC contingent liabilities PRC Government Liabilities, 2009 Category
% of GDP
Official government debt
17.7
Local government debt
25.5
Ministry of Railways liabilities
3.8
Total government debt
47.0
Commercial bank NPLs
4.0
Asset management company bonds
2.9
Policy bank bonds
13.3
PBOC bonds
12.4
Local investment company debt
33.5
Total contingent liabilities
66.1
Total government liabilities
113.1
Source: Based on Hemming (2012)
28
Potential ending of interest rate repression • A large negative gap of the interest rate with the nominal GDP growth rate suggests a high degree of financial repression in the government bond market • Though the correlation is loose, the interest rate gap tends to narrow as incomes rise, in line with greater financial liberalization and openness (Hong Kong and Singapore are major exceptions, though) • A narrowing of the interest rate gap will make it more difficult for countries to “inflate away” their debt burdens, putting a greater burden on adjustment in the primary balance to achieve debt sustainability • High holdings of government bonds by the banking sector could raise the risk of a “doom loop” of a sovereign debt and banking crisis • This will require greater reliance on fiscal discipline, supported by fiscal rules 29
PRC also has very high bank holdings of government debt Share of Government Bond Holdings, %
Country PRC Indonesia Japan Korea Malaysia Thailand
Banks 77.0 39.1 38.4 18.8 44.1 15.8
Other domestic financial Govern Central Foreign institutions ment Banks holdings Others 10.5 0.0 0.0 -13.3 17.8 -0.6 29.6 42.7 27.6 9.6 10.2 8.7 14.2 43.3 23.2 2.8 10.0 31.2 71.6 1.0 0.4 27.1 27.1 51.6 1.0 6.2 15.0 10.4
Notes: the category "other domestic financial institutions" may also include Contractual Savings Institutions, such as insurance, pension and other funds institutions. Source: Asian Bonds On-line, available at: http://asianbondsonline.adb.org/regional.php, accessed 15.1.2013
30
Need for fiscal management framework • Coordinated, well-defined and distinct roles should be set for central and local governments, state-owned commercial banks and state-owned enterprises Clear rules for funding of infrastructure projects Avoid use of commercial banks for fiscal policy purposes
• Establishment of fiscal rules • Debt management office • Strengthening of fiscal surveillance National level: Finance ministry, central bank, financial supervisors Regional level: AMRO can play role 31
Role of fiscal rules in Asia
32
Fiscal (compact) indicators for Asia Country Japan China Hong Kong, China Korea Taipei,China Singapore Brunei Darussalam Cambodia Indonesia Lao PDR Malaysia Myanmar Philippines Thailand Viet Nam India
General Interest Rate General government on Time government fiscal CPI Inflation Deposits, 12 gross debt balance rate Months % of GDP 229.6 25.8 33.8 34.2 40.5 107.6 0.0 28.5 24.5 55.9 52.9 53.5 41.9 41.7 50.4 67.0
% of GDP -9.8 -1.2 4.1 1.8 -3.6 7.3 30.2 -4.1 -0.8 -2.9 -6.9 -5.9 -0.8 -1.6 -3.2 -9.0
% change -0.3 5.4 5.3 4.0 1.4 5.2 2.0 5.5 5.4 7.6 3.2 4.0 4.7 3.8 18.7 8.9
% 0.07 3.29 0.15 4.15 1.30 0.32 ... 6.16 7.06 ... 3.22 ... 2.03 2.85 13.00 8.95
Lending Rate % 1.50 6.56 5.00 5.76 2.88 5.38 5.50 15.22 12.40 … 4.92 16.33 6.66 6.91 16.95 10.17
Notes: Public sector debt refers to consolidated government debt except for Indonesia and Korea, while the Philippines refers to nonfinancial public sector debt. Sources: IMF, WEO and International Financial Statistics; ADB, Key Indicators, 2011 data.
33
Role of debt management offices in emerging Asia Objectives of the Public Debt Management Offices Country Objectives Indonesia 1. To establish government debt portfolio management in an effective, transparent and accountable manner 2. To control debt issuance and procurement by maintain a borrowing capacity that supports fiscal sustainability 3. To establish development financing independence by prioritizing domestic financing sources and developing an efficient and stable domestic market 4. To establish international cooperation in obtaining alternative financing sources as well as supporting regional financial market stability Thailand
1. Manage public debt to achieve low costs subject to acceptable risks (Strategy 1) 2. Develop the domestic bond market to be one of the three main pillars of the financial market (Strategy 2) 3. Evaluate and mobilize feasible funds to finance government’s infrastructure products (Strategy 3) 4. Modernize Technology to support PDMO’s operations (Strategy 4)
Sources: Ministry of Finance of the Republic of Indonesia. The presentation of Mr. Widjanarko Director, Directorate General of Debt Management on 8th UNCTAD Debt Management Conference Geneva, 14 - 16 November 2011 and Public Debt Management Office of Thailand, available at: http://www.pdmo.go.th/en/about.php?m=about
34
V. Conclusions • •
Fiscal sustainability conditions in Asia ex Japan are generally benign—only India among major countries has a debt-to-GDP ratio above 60% However, future developments may undermine this rosy picture:
Indonesia, India, Malaysia and the Philippines have high subsidy levels that contribute substantially to fiscal deficits— these should be replaced by targeted income transfer programs The Asian NIEs and (to a lesser extent) the PRC and Thailand have rapidly aging populations and widening social benefit coverage ratios that point to rapidly rising entitlements India, Indonesia and the Philippines have inadequate levels of infrastructure investment—greater fiscal space needs to be created to support necessary investments for growth The PRC has large contingent liabilities The PRC, India, Indonesia, Thailand and Viet Nam have high levels of interest rate repression that may not be sustainable The PRC has very high bank holdings of government debt 35
Conclusions (2) • Medium-term fiscal sustainability risk can be reduced by:
Replacing subsidies with targeted income transfer programs Containing social protection program costs and raising premiums to provide adequate funding Promoting financial development to widen channels of funding for infrastructure investment, including encouragement of PPP financing Considering contingent liabilities in a more transparent way and eliminating use of commercial banking sector for fiscal policy implementation Establishing rational framework for allocating expenditures Achieving more balanced sources of direct and indirect revenue, and strengthening tax collection Adopting fiscal rules Establishing a debt management office Strengthening fiscal surveillance by national as well as regional bodies (AMRO) 36
Thank you For more information: Masahiro Kawai, PhD Dean & CEO
Peter J. Morgan, PhD Senior Consultant for Research
Asian Development Bank Institute
[email protected],
[email protected] +81 3 3593 5527 www.adbi.org 37