Kinetic ArticleSpectrophotometric Method for the Estimation of Ofloxacin in Pharmaceutical Formulations
J. Mex. Chem. Soc. 2012, 56(4), 355-361 355 © 2012, Sociedad Química de México ISSN 1870-249X
Kinetic Spectrophotometric Method for the Estimation of Ofloxacin in Pharmaceutical Formulations Lalit Kishore, Ashok Kumar,* Anroop Nair, and Navpreet Kaur M.M. College Of Pharmacy, M.M. University, Mullana, Ambala, Haryana-133207, India
[email protected] Received November 26, 2011; accepted May 23, 2012 Abstract. The objective of the current study was to develop a direct, sensitive spectrophotometric method based on the oxidation of Ofloxacin using potassium permanganate in alkaline medium. The rate of change of absorbance was measured at 603 nm. The initial rate method and fixed time method (at 4 min) are utilised to construct calibration graphs for calculating the concentration of the drug. The results were validated through inter day and intraday precision assays according to the ICH guidelines and also through recovery studies. Statistical comparison of the proposed methods with that of reference method shows excellent agreement and indicates no significant difference in their accuracy and precision. Key words: Ofloxacin, Initial Rate Method, Fixed Time Method.
Resumen. Se desarrolla un método espectrofotométrico directo y sensible basado en la oxidación de ofloxacina con permanganato de potasio en medio alcalino. La velocidad de cambio de la absorbancia fue de 603 nm. Fueron utilizados los métodos de velocidad inicial y el método de tiempo fijo (4 min) para construir las gráficas de calibración para calcular la concentración del fármaco. Los resultados fueron validados inter e intra- días por ensayos de precisión según las pautas ICH y por estudios de recuperación. La comparación estadística de los métodos propuestos con el método de referencia muestra una excelente concordancia y no existe diferencia significativa de su exactitud y precisión. Palabras clave: Ofloxacina, método de velocidad inicial, método de tiempo fijo.
Introduction
Reagents and standards
Ofloxacin is a synthetic fluoroquinolone antibiotic [1] and is chemically (RS)-7-fluoro-2-methyl-6-(4-methylpiperazin-1-yl)10-oxo-4-oxa-1-azatricyclo [7.3.1.05, 13] trideca-5(13),6,8,11tetraene-11-carboxylic acid. It is prescribed for urinary tract infection, bronchitis, pneumonia, prostatitis, syphilis and infections of reproductive organs. Literature survey revealed the estimation of Ofloxacin has been determined along with other drugs by UV [2-4], HPLC [5-13], electrophoresis [14], HPTLC [15] and voltammetrically [16]. Kinetic spectrophotometric methods became of great interest in chemical and pharmaceutical analysis because of some specific advantages of the method, such as selectivity due to the measurements based on the absorbance with time of reaction, easily applicable, sensitive and the processing cost is low as the reagents used are commonly available in laboratories. There is no literature regarding estimation of ofloxacin using kinetic spectrophotometry. Therefore the objective of this study was to develop a sensitive method by employing the kinetic colorimetric oxidation of Ofloxacin to increase selectivity and consequently determination of low concentration of the drug as possible.
All chemicals used were of analytical grade. Pure Ofloxacin was provided by Cipla, India and was used as received. A standard solution of Ofloxacin 1 mg/mL was prepared by dissolving 50 mg in 1 mL of 1 M NaOH and then making the volume with doubly distilled water up to 50 mL. A working test solution (0.1 mg/mL) of Ofloxacin was prepared by diluting 5 mL of the stock solution to 50 mL with doubly distilled water. The tablets containing Ofloxacin such as Oflox-200 (Cipla) and Oflowock-200 (Wockhardt) were purchased from local market. Aqueous solutions of sodium hydroxide (1M) and potassium permanganate (0.01M) were prepared with doubly distilled water. Potassium permanganate should be prepared freshly.
Materials and Methods Apparatus A Shimadzu UV-Visible spectrophotometer (model-1800, Japan) with a pair of matched quartz cells was used to measure absorbance.
Procedures for the determination of ofloxacin Initial rate method Aliquots of 0.5-1.5 mL of 0.01% Ofloxacin test solution were pipette out into a series of flasks and to these 1 mL of 1 M NaOH and 1.5 mL of 0.01 M KMnO4 was added and then diluted them with doubly distilled water up to 10 mL. The contents of the mixture were mixed well and their absorbance was measured at 603 nm with a function of time. The initial rate of reaction at different concentrations was obtained from the slope of tangent to the absorbance time curve. The calibration graph was plotted between the logarithm of the initial rate of reaction and the logarithm of the molar concentration of Ofloxacin. The amount of drug was calculated either from the calibration graph or regression equation.
356 J. Mex. Chem. Soc. 2012, 56(4)
Fixed time method In this method, the absorbance of each sample solution at a preselected fixed time was accurately measured and plotted against the final concentrations of the drug. The content of the drug was calculated either from the calibration graph or regression equation. Determination of Ofloxacin from dosage form An accurately weighed quantity of tablets, equivalent to 50 mg of the drug dissolved in 1 mL of 1 M NaOH and volume made up to 50 mL of doubly distilled water and the residue was filtered using membrane filter. The stock solution was diluted according to need and analyzed by the recommended procedures. Procedure for reference method Into a series of 10 mL standard volumetric flask, different volumes (0.5-1.5 mL) of 0.01% drug (0.1 mg/mL) solution were pipette and diluted to volume with doubly distilled water. The absorbance was measured at absorption maximum of Ofloxacin that was found to be 289 nm. The amount of drug in a given sample was calculated from the calibration graph or regression equation. Recovery was performed for studying the accuracy of this method and the results are shown in Table 8.
Lalit Kishore et al.
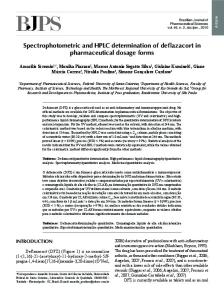
neutral and acidic medium the permanganate is further reduced to colourless (Mn II). This behaviour of permanganate is the primary basis for its uses in development of spectrophotometric methods [17-18]. The absorption spectrum of aqueous potassium permanganate solution in the alkaline medium exhibited an absorption band peaking at 546 nm. The addition of Ofloxacin to this solution produced new characteristic band at 603 nm (Fig. 1). This band is primarily due to the formation of manganate ion, which resulted in the oxidation of Ofloxacin by potassium permanganate in alkaline medium. This could cause increase in intensity of the colour with time and this occurrence was utilized to develop a kinetics based analytical method for the determination of Ofloxacin. The different variables that affect the formation of manganate ion were studied and optimized. Effect of KMnO4 concentration To study the effect of the KMnO4 concentration, aliquots of Ofloxacin 100 µg/mL were transferred into a series of 10 mL volumetric flasks, followed by varying volumes of 0.01 M KMnO4 (0.2-2.0 mL) and 1 mL of 1 M NaOH solutions. The absorbance at 603 nm was measured at a fixed time of 16 min.
Results and Discussion Potassium permanganate acts as strong oxidising agent and has been used in oxidimetric analytical method for determination of many compounds. Basic principle involved during the due course of oxidation process is the alteration of valence of manganese. The heptavalent manganese ion (Mn VII) changes to green colour, MnO42- (VI) in alkaline medium whereas in Fig. 2. Effect of the volume of 0.01 M KMnO4 on the intensity of colour produced during the reaction (Ofloxacin 15 μg/mL; 1.0 mL of 1 M NaOH).
Fig. 1. Absorption spectra of (A) 1.0 mL of 1 M NaOH + 1.5 mL 0.01 M KMnO4; (B) 15 μg/mL of Ofloxacin + 1.0 mL of 1 M NaOH + 1.5 mL 0.01 M KMnO4 in doubly distilled water.
Fig. 3. Effect of the volume of 1 M NaOH on the intensity of colour produced during the reaction (Ofloxacin 15 μg/mL; 1.5 mL of 0.01 M KMnO4).
Kinetic Spectrophotometric Method for the Estimation of Ofloxacin in Pharmaceutical Formulations Log [KMnO4]
357
Log [Drug]
(A)
(B)
Fig. 4. Limiting logarithmic plot for molar combining ratio between Ofloxacin and KMnO4: (A) log A vs. log [KMnO4]; (B) log A vs. log [Drug]. O
O
F
OH
N N
N O
+ MnO4Ofloxacin
OH-
O
O
F
OH
N N
N O
Fig. 5. Absorbance versus time graphs for the reaction of Ofloxacin with potassium permanganate. KMnO4 is 1.5 × 10⁻³ mol/litre and Ofloxacin (a) 5 μg/mL (b) 10 μg/mL (c) 15 μg/mL for 16 minutes.
OH
+ MnO42-
Oxidised product
Scheme 1.
It is apparent from Fig. 2 that the absorbance increased with increasing volume of KMnO4 solution, and became more or less constant when the volume was 1.2 mL. Further, increase in the volume of KMnO4 resulted in no change in the absorbance (Fig. 2). This results suggest that the adoption of 1.5 mL of KMnO4 (0.01 M) in the final solution could be adequate for the highest concentration of Ofloxacin (15 µg/mL) used in its determination. Effect of NaOH concentration The influence of NaOH concentration on the formation of manganate ions was examined. aliquots of Ofloxacin 100 µg/mL were transferred into a series of 10 mL volumetric flasks, followed by varying volumes of 0.01 M KMnO4 (1.5 mL) and
(0.2-1.6 mL) of 1 M NaOH solutions. The absorbance at 603 nm was measured at a fixed time of 16 min. It is evident from the Fig. 3 that the highest absorbance of the reactant solution was obtained using 0.8 mL of 1M NaOH, in the current experimental condition. Hence, an optimum value of 1 mL of NaOH was selected and used in the further studies. Effect of temperature At room temperature the reaction rate increases substantially with time, although increasing the solution temperature enhanced the rate of reaction. However, we have observed that the increase in temperature led to increase in intensity of the colour. Stoichiometry The stoichiometry ratio between potassium permanganate and Ofloxacin was determined by the limiting logarithmic method. It was established by performing two types of experiments.
358 J. Mex. Chem. Soc. 2012, 56(4)
Lalit Kishore et al. Table 1. Optical characteristics of fixed time method. Parameters
Fixed time method
Beer’s law limit (μg/mL)
4 min
8 min
12 min
16 min
3-15
3-9
3-9
3-9
Regression equation
Fig. 6. Absorbance versus time graphs for the reaction of Ofloxacin with potassium permanganate. KMnO4 is 1.5 × 10⁻³ mol/litre and Ofloxacin (a) 5 μg/mL (b) 10 μg/mL (c) 15 μg/mL at a fixed time of 4 minutes.
In the first type, KMnO4 concentration was kept constant and concentration of Ofloxacin was varied. In the second one KMnO4 concentration was varied while keeping concentration of Ofloxacin, constant. The logarithm of the absorbance was plotted against the logarithm of the corresponding concentration. The slopes of the two straight lines were calculated and found to be unity in each case. Thus the stoichiometric ratio between ofloxacin and potassium permanganate was found to be 1:1 (Fig. 4). Reaction Literature revealed that fluoroquinolone antibiotics have a tendency to get oxidised by chloramine B, potassium permanganate in alkaline medium [19-20]. So, in this study we have used potassium permanganate (alkaline medium) as the oxidising agent for Ofloxacin. The reaction mechanism is given in Scheme 1. Initial rate method The initial rate of reaction was determined by measuring slopes of initial tangent to the absorbance time curves (Fig. 5). The order of reaction with respect to permanganate was determined from the reaction using different concentrations of KMnO4 with fixed Ofloxacin concentration. The order of reaction was found to be one, as the plot of initial rate against the initial absorbance was linear and was passing through the origin. Similarly, the order of Ofloxacin was determined by plotting the logarithm of the initial rate of the reaction with the logarithm of the molar concentration of Ofloxacin. Here also the order was found to be one. Under the optimized experimental conditions, the concentration of Ofloxacin was determined using an excess of KMnO4 and NaOH solution with respect to the initial concentration
Y = mX + c
Slope
0.373
0.594
0.584
0.643
Intercept
0.299
0.295
0.364
0.395
Correlation coefficient (r)
0.999
0.996
0.999
0.998
Standard deviation
0.050
0.058
0.081
0.093
Relative standard deviation
0.079
0.089
0.114
0.119
LOD (μg/mL)
0.447
0.322
0.457
0.477
LOQ (μg/mL)
1.356
0.976
1.386
1.446
of Ofloxacin, under the optimized experimental condition. As a result, a pseudo zero order reaction with respect to their concentrations. However, the initial rate of the reaction would follow a pseudo first order and was found to obey the following equation;
Rate = ΔA/Δt = K1 Cn
Where K1 is the pseudo first order rate constant, C is the concentration of Ofloxacin, n is the order of the reaction. The logarithmic form of the above equation is written as,
Log (rate) = log K1 + n log C
The linear regression analysis using the method of least square was used to determine the slope, intercept and correlation coefficient. The calibration curves plotted between the log of initial rate versus log of molar concentration of Ofloxacin were linear over a range of 5-15 μg/mL with a correlation coefficient of 0.999. Fixed time method In this method, the absorbance of coloured solutions with different amount of Ofloxacin was measured at a preselected time (Fig. 6). Calibration curve of absorbance versus initial concentration of Ofloxacin were plotted at a fixed time of 4, 8, 12 and 16 minutes. The regression equations, correlation coefficient, limit of detection, standard deviation and relative standard deviation are summarized in Table 1. The lowest detection limit was obtained at 8 min where as the widest concentration range of quantification was obtained at a fixed time of 4 min. According to ICH guidelines [21] the detection limit is not required to be the part of the validation procedure for assays. Therefore on the basis of wider concentration range and less time of analysis, the fixed time of 4 min was selected for analysis. The accuracy and precision of Ofloxacin was measured from the pure sample and tablet dosage form three times within
359
Kinetic Spectrophotometric Method for the Estimation of Ofloxacin in Pharmaceutical Formulations Table 2. Intra-day assay for the evaluation of accuracy and precision of the initial rate and fixed time method. Methods
Amount taken (μg/mL)
Amount found (μg/mL)
% Accuracy
% RSD
15
14.922
198.44 ± 0.939
0.954
10
10.207
102.07 ± 0.655
0.642
15
14.869
199.12 ± 0.144
0.145
15
15.051
101.12 ± 1.019
1.009
10
10.221
101.21 ± 0.588
0.581
15
15.141
100.95 ± 0.874
0.866
Initial rate method
Fixed time method
Values are mean ± SD for 3 determinations.
Table 3. Intra-day assay for the test of precision of proposed method in pharmaceutical formulations. Formulations
Initial rate method Amount taken Amount found (μg/mL) (μg/mL)
Oflox-200
Oflowock-200
Fixed time method
% Accuracy ± SD
% RSD
Amount taken Amount found (μg/mL) (μg/mL)
% Accuracy ± SD
% RSD
05
04.994
199.88 ± 0.226
0.226
05
05.02
100.53 ± 2.071
2.059
10
10.262
102.59 ± 0.641
0.620
10
10.17
101.71 ± 2.671
2.625
15
15.110
100.73 ± 0.424
0.420
15
15.08
100.53 ± 1.256
1.249
05
04.937
198.74 ± 0.742
0.751
05
05.04
100.86 ± 0.805
0.798
10
10.310
103.18 ± 0.605
0.586
10
09.97
199.73 ± 1.020
1.023
15
14.879
199.19 ± 0.898
0.905
15
15.10
100.70 ± 0.491
0.488
Values are mean ± SD for 3 determinations.
Table 4. Inter- day assay for the evaluation of accuracy and precision of the initial rate and fixed time method. Methods
Amount taken (μg/mL)
Amount found (μg/mL)
% Accuracy ± SD
% RSD
05
04.982
199.77 ± 0.121
0.121
10
10.270
102.67 ± 0.767
0.747
15
15.005
100.04 ± 0.290
0.289
05
05.110
102.26 ± 1.319
1.290
10
10.060
100.62 ± 1.305
1.297
15
15.270
101.82 ± 1.312
1.289
Initial rate method
Fixed time method
Values are mean ± SD for 3 determinations.
Table 5. Inter-day assay for the test of precision of proposed method in pharmaceutical formulations. Formulations
Initial rate method Amount taken Amount found (μg/mL) (μg/mL)
Oflox-200
Oflowock-200
Fixed time method
% Accuracy ± SD
% RSD
Amount taken Amount found (μg/mL) (μg/mL)
% Accuracy ± SD
% RSD
05
04.982
099.64 ± 0.103
0.103
05
05.04
100.80 ± 1.697
1.684
10
10.275
102.75 ± 0.470
0.457
10
10.21
102.10 ± 1.433
1.404
15
14.995
099.96 ± 0.383
0.383
15
15.17
101.13 ± 1.225
1.211
05
04.938
098.76 ± 0.942
0.953
05
05.06
101.26 ± 0.659
0.651
10
10.343
103.43 ± 0.801
0.774
10
10.06
100.63 ± 0.928
0.922
15
14.950
099.66 ± 1.084
1.087
15
15.17
101.15 ± 1.092
1.080
Values are mean ± SD for 3 determinations.
360 J. Mex. Chem. Soc. 2012, 56(4)
Lalit Kishore et al.
Table 6. Recovery studies for the determination of Ofloxacin in tablet dosage form by initial rate method. Formulations
Oflox -200
Oflowock-200
Initial rate method Amount taken (μg/mL)
Amount added (μg/mL)
Amount found (μg/mL) ± SD
% Recovery
% RSD
5
4
09.01 ± 0.018
100.46
0.200
5
09.98 ± 0.057
099.68
0.571
6
11.08 ± 0.016
101.38
0.144
4
09.03 ± 0.016
100.75
0.177
5
10.02 ± 0.051
100.57
0.509
6
11.09 ± 0.004
101.55
0.036
5
Values are mean ± SD for 3 determinations. Table 7. Recovery studies for the determination of Ofloxacin in tablet dosage form by fixed time method. Formulations
Oflox-200
Oflowock-200
Fixed time method Amount taken (μg/mL)
Amount added (μg/mL)
Amount found (μg/mL) ± SD
% Recovery
% RSD
5
4
08.99 ± 0.0020
099.29
0.022
5
10.02 ± 0.0120
100.06
0.120
6
10.99 ± 0.0008
099.56
0.007
4
09.07 ± 0.0550
100.41
0.606
5
10.06 ± 0.0410
100.06
0.408
6
11.12 ± 0.0810
101.05
0.728
5
Values are mean ± SD for 3 determinations. Table 8. Recovery studies for the determination of Ofloxacin using reference method. Formulations
Oflox-200
Oflowock-200
Reference method Amount taken (μg/mL)
Amount added (μg/mL)
Amount found (μg/mL) ± SD
% Recovery
% RSD
5
4
08.98 ± 0.040
100.00
0.445
5
10.06 ± 0.047
100.60
0.467
6
10.98 ± 0.044
100.16
0.401
4
09.06 ± 0.040
100.25
0.442
5
10.01 ± 0.032
099.20
0.320
6
11.07 ± 0.042
100.33
0.379
5
Values are mean ± SD for 3 determinations. Table 9. Point hypothesis: comparison of the proposed method with reference method using paired student t-test. Formulations Oflox-200
Oflowock-200
Initial rate method
Fixed time method
Reference method
% Recovery
% RSD
t-value
% Recovery
% RSD
t-value
% Recovery
% RSD
100.46
0.200
0.420
099.29
0.022
0.16
100.00
0.445
099.68
0.571
0.370
100.06
0.120
0.42
100.60
0.467
101.38
0.144
0.090
099.56
0.007
0.39
100.16
0.401
100.75
0.177
0.980
100.41
0.606
0.79
100.25
0.442
100.57
0.509
0.670
100.06
0.408
0.88
099.20
0.320
101.55
0.036
0.105
101.05
0.728
0.75
100.33
0.379
Degree of freedom = 2 Theoretical t-value (n = 3) at 95% confidence level is 1.943.
Kinetic Spectrophotometric Method for the Estimation of Ofloxacin in Pharmaceutical Formulations
361
a day by initial rate and fixed time method are given in Table 2 and 3 respectively. The daily precision was measured by analysing the pure sample and tablets on three consecutive days by both methods (Table 4 and 5 respectively). The standard deviation, relative standard deviation obtained in both intraday and inter-day assays was found to be satisfactory. The accuracy of the methods was determined by performing recovery studies. For this a known amount of pure drug was added to the preanalysed tablet dosage form and then reanalysed by the recommended procedure. The results obtained are shown in Table 6 and 7. However, there was no interference by the formulations excipients.
encourage the application of the proposed method in routine analysis of Ofloxacin in laboratories.
Application of the proposed method to pharmaceutical dosage form
1. Nelson, J. M.; Chiller, T. M.; Powers, J. H.; Angulo, F. J. Clin Infect Dis. 2007, 44, 977-80. 2. Wankhede, S. B.; Prakash, A.; Chitlange, S. S. Asian J. Research Chem., 2008, 1, 9-11. 3. Fegade, J. D.; Mehta, H. P.; Chaudhari, R. Y.; Patil, V. R. Int. J. ChemTech Res., 2009, 1, 189-94. 4. Bhusari, K. P.; Chaple, D. R. Asian J. Research Chem. 2009, 2, 60-2. 5. Espinosa-Mansilla, A.; Munoz de la Pena, A.; Gonzalez Gomez, D.; Salinas, F. J. Chromatogr. B. 2005, 822, 185-93. 6. Chenga, G. W.; Wua, H. L.; Huang, Y. L. Anal. Chem. Acta, 2008, 616, 230-234. 7. Sachan, N.; Chandra, P.; Saraf, S. K.; Gupta, R. C. IJPSR 2010, 1, 100-107. 8. Singh, R.; Maithani, M.; Saraf, S. K.; Saraf, S.; Gupta, R. C. Eurasian J. Anal. Chem. 2009, 4, 161-167. 9. Kasabe, A. J.; Shitole, V. V.; Waghmare, V. V.; Mohite, V. Int. J. ChemTech Res. 2009, 1, 1244-1250. 10. Ranea, V. P.; Shinde, D. B. Eurasian J. Anal. Chem. 2009, 4, 304-310. 11. Kumar, R. S.; Nallasivan, P. K.; Saravanakumar, S.; Kandasamy, C. S.; Venkatnarayanan, R. Asian J. Research Chem. 2009, 2, 43-45. 12. Smet, J. D.; Bousserya, K.; Colpaertb, K.; Sutter De, P.; Paepe De, P.; Decruyenaere, J.; Bocxlaer, V. J. J. Chromatogr. B. 2009, 877, 961-967. 13. Shervington, L. A.; Abba, M.; Hussain, B.; Donnelly, J. J. Pharmac. Biomed. Anal. 2005, 39, 769-775. 14. Zhang, S. S.; Liu, H. X.; Yuan, Z. B.; Yu, C. L. J. Pharmac. Biomed. Anal. 1998, 17, 617-622. 15. Khandagle, K. S.; Gandhi, S. V.; Deshpande, P. B.; Kale, A. N.; Deshmukh, P. R. J. Chem. Pharm. Res. 2010, 2, 92-96. 16. Ke-Jing, H.; Xue, L.; Wan-Zhen, X.; Hong-Xia, Y. Microchim Acta 2008, 162, 227-233. 17. Hassan, E. M.; Belal, F. J. Pharmac. Biomed. Anal. 2002, 27(1-2), 31-38. 18. Rahman, N.; Khan, N. A.; Azmi, S. N. H. Pharmazie 2004, 59(2), 112-116. 19. Rahman, N.; Ahmad, Y.; Azmi, S. N. H. Eur. J. Pharmac. Biopharmac. 2004, 57, 359-367. 20. Darwish, I. A.; Sultan, M. A.; Al-Arfaj, H. A. Int. J. Res. Pharm. Sci. 2010, 1(1), 43-50. 21. International conference on Harmonization, ICH Harmonised Tripartite Guideline—Text on Validation of Analytical Procedures, Fed. Regist. 60, 1995, 11260. 22. Zhang, L. T.; Yuan, Z. F.; Chen, R. H.; Zhou, Z. X.; Zhou, Y. M.; Zhang, A. H.; Liu, W. N.; Zhang, Z. H. Yaowu Fenxi Zazhi, 1997, 17, 33-34.
The initial rate and fixed time methods of the proposed kinetic spectrophotometric method for the determination of ofloxacin have been tested on commercial pharmaceutical dosage forms (tablets) and concentration of ofloxacin was computed from its corresponding regression equation. The results of the proposed method were then compared with the reference method using paired student t-test. The values of the t-test obtained are given in Table 9 which were less than the theoretical values and thus confirms that there was no difference in the performance of the proposed method and the reference method. Advantages of the proposed method The proposed method involves measurements in the visible region and is more selective than the reported UV based methods. Further, the proposed method utilizes water as solvent which is easily available, safe and economical as well [20]. In contrast, the other methods reported used costly organic solvents like methanol, ethanol, which cause health and environmental hazards and they require special care for their sanitary disposal. Moreover, the current method is very simple as it is a single step reaction and is not tedious. From economical point of view, all the analytical reagents are inexpensive, have excellent shelf life, and are available in any analytical laboratory. The process used in the proposed method need not require any tedious liquid-liquid extraction for the drug base or extraction of the chromophores [22].
Conclusion The initial rate and fixed time method can be easily applied to Ofloxacin in its determination in pure and tablet dosage form. These methods do not require any elaborate treatment of the analyte. The proposed methods are sensitive enough for the determination of lowest amount of drug. These advantages
Acknowledgement I express my thanks to Hon’ble Chancellor Mr. Tarsem Kumar Garg, M. M. University, Mullana, Ambala, Haryana for providing all the necessary facilities required for this work.
References