International Journal of Drug Development & Research | April-June 2012 | Vol. 4 | Issue 2 | ISSN 0975-9344 | Available online http://www.ijddr.in Covered in Official Product of Elsevier, The Netherlands SJR Impact Value 0.03,& H index 2 ©2012 IJDDR
Development and Validation of UV spectrophotometric method for the estimation of Curcumin in Bulk Drug and Pharmaceutical Dosage Forms Kiran Sharma a, S. S. Agrawal, Monica Gupta a
Department of Pharmaceutics, Assistant professor, KIET School of Pharmacy, Ghaziabad - Meerut Highway (NH-58), P.Box-02 Ghaziabad-201206 Uttar-Pradesh, India
FULL Length Research Paper Covered in Index Copernicus with IC Value 4.68 for 2010
Abstract
Key words:
A rapid, simple, selective and precise UV- Visible
UV- Visible Spectrophotometer, Curcumin, ICH
Spectrophotometric method has been developed
guidelines
for the determination of Curcumin in bulk forms and
solid
dosage
formulations.
The
How to Cite this Paper:
spectrophotometric detection was carried out at an
Kiran Sharma, S. S. Agrawal, Monica Gupta,
absorption maximum of 421 nm using methanol as
“Development
solvent. The method was validated for specificity,
spectrophotometric method for the estimation of
linearity, accuracy, precision, robustness and
Curcumin in Bulk Drug and Pharmaceutical Dosage
ruggedness.
Forms”, Int. J. Drug Dev. & Res., April-June 2012,
Curcumin
The was
detector linear
response over
the
for
the
selected
and
Validation
of
UV
4(2): 375-380
concentration range 1 to 7 µg/ml with a correlation coefficient of 0.9995. The accuracy was between
Copyright © 2012 IJDDR, Kiran Sharma et al.
99.1& 101.4%. The precision (R.S.D.) among six
This is an open access paper distributed under the
sample preparations was 0.39%. The LOD and
copyright agreement with Serials Publication, which
LOQ are 0.05 and 0.172 µg/ml, respectively. The
permits
recovery of curcumin was about 100.4 %. The
reproduction in any medium, provided the original
results demonstrated that the excipients in the
work is properly cited.
unrestricted
use,
distribution,
and
commercial tablets did not interfere with the method and can be conveniently employed for routine quality control analysis of Curcumin in bulk
drug,
marketed
tablets
and
other
Article History:-----------------------Date of Submission: 12-03-2012 Date of Acceptance: 11-04-2012 Conflict of Interest: NIL
formulations.
Source of Support: NONE
*Corresponding author, Mailing address: Kiran Sharma II E 96/A, Nehru Nagar, Ghaziabad, 201001, U.P., India. Email id:
[email protected]
1. INTRODUCTION The powdered dry rhizome of the plant Curcuma longa, commonly called turmeric, is widely used as a colouring agent and spice in many food items
[1].
It
contains a wide variety of phytochemicals, including
Int. J. Drug Dev. & Res., April-June 2012, 4 (2): 375-380 Covered in Scopus & Embase, Elsevier
375
Kiran Sharma et al: Development and Validation of UV spectrophotometric method for the estimation of Curcumin in Bulk Drug and Pharmaceutical Dosage Forms
curcumin,
demethoxycurcumin,
bisdemethoxycurcumin, curcumol,
eugenol,
triethylcurcumin, turmeronols
zingiberene,
[2, 3].
curcumenol,
other chemicals and reagents used were of analytical grade.
tetrahydrocurcumin,
turmerin,
turmerones,
and
Curcumin is the phytochemical that
2.2. Method development 2.2.1. Instrumentation
FULL Length Research Paper Covered in Index Copernicus with IC Value 4.68 for 2010
gives a yellow color to turmeric and is now
Spectroscopic analysis was carried out using Double-
recognized as being responsible for most of the
beam
therapeutic effects
Chemically described as (1E,
Spectrophotometer (Kyoto, Japan) model 1601 with
6E)-1.7-bis (4 hydroxy – 3 methoxyphenyl) – 1,6
10 mm path length matched quartz cells was used for
Heptadiene-3,5-dione, the aromatic ring systems,
analytical purpose.
[4].
Shimadzu
recording
UV-Visible
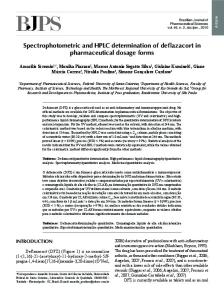
which are polyphenols are connected by two α, β – unsaturated carbonyl groups (Fig. 1), while the α,β –
2.2.2. Standard stock solution
unsaturated carbonyl is a good Michael acceptor and
Stock solutions of curcumin containing 10µg/ml were
undergoes
nucleophilic
addition
[5,
6].
It
is
prepared
in
methanol
and
its
aliquots
were
hydrophobic in nature and frequently soluble in
transferred in a series of 10 ml volumetric flasks in
dimethylsulfoxide, acetone, ethanol, and oils. It has
varying fractions and their volumes were made with
an absorption maximum around 420 nm
methanol to prepare different standard dilutions
[7, 8].
varying in between 1-7µg ml-1. Literature survey revealed that a variety of analytical methods viz. HPLC, HPTLC, UV-Visible has been
2.2.3. Method optimization
developed for their analysis but in plasma and urine
2.2.3.1.. Selection and Optimization of Solvent
[9, 10].
It is well known that the solvent do exerts a profound
As the formulations are available without
combinations of any drugs, there is a need for coming
influence on the quality and shape of the peak
up with analytical method which is simple, sensitive,
The choices of solvents for UV method development
rapid and accurate for estimation of Curcumin in
are: Chloroform, Acetone, Methanol etc. Different of
pure form and in pharmaceutical preparations
solvents were optimized. Out of which methanol
[11, 12].
[13].
Therefore, the aim of the present work is to develop
satisfied all the conditions relative to Peak quality
and validate a method for the analysis by UV-Visible
non-interference at the specified wavelength.
spectrophotometer which is easily adaptable as a
2.2.3.2. Selection of Wavelength
routine in quality testing laboratories. This has
The wavelength at which maximum absorption takes
enabled us to reduce total time of analysis besides
place in UV detector is selected for further analysis
taking care of the error caused due to incomplete
i.e. 421nm.
&
extraction and use of internal standard. 2.3. Method validation 2. MATERIALS AND METHODS
Validation of the method was carried out as per the
2.1. Materials
International Conference on Harmonization (ICH)
Curcumin was obtained from Loba chieme Mumbai,
guidelines Q2 (R1) (ICH, 2005)
India as gift sample. Methanol used was of analytical
the parameters evaluated were:
grade and purchased form Merk Chemicals, India.
2.3.1. Sensitivity
Three formulations collected from market (A, B & C)
Sensitivity of the method was determined with
with drug equivalent to 500 mg curcumin. All the
respect to limit of detection (LOD) and limit of
376
Int. J. Drug Dev. & Res., April-June 2012, 4 (2): 375-380 Covered in Scopus & Embase, Elsevier
[14].
And accordingly
Kiran Sharma et al: Development and Validation of UV spectrophotometric method for the estimation of Curcumin in Bulk Drug and Pharmaceutical Dosage Forms
Series of concentrations of
six let (drug was found stable for three days).
drug solutions (0.01–7 µg/ml) were used and
Reproducibility was determined by analyzing three
analyzed to determine LOD and LOQ.
different concentrations of Curcumin (2.5 µg ml-1, 4
LOD and LOQ were experimentally verified by
µg ml-1 and 5.5 µg ml-1) in six let on different UV
diluting known concentration of Curcumin until the
spectrophotometers (One Cintra 5 double beam UV
average responses were approximately 3 or 10 times
Spectrophotometer and two different Shimadzu 1601
the standard deviation of the responses for six
double beam Spectrophotometers in different labs).
[16].
% Relative standard deviation, standard deviation
quantification (LOQ)
[15].
FULL Length Research Paper Covered in Index Copernicus with IC Value 4.68 for 2010
replicate determinations
2.3.2. Specificity and selectivity
and
Three different marketed tablets of Curcumin of
concentrations based on standard curve were
concentration 4 µg
reported for each set of data.
ml-1
were prepared in methanol
confidence
interval
of
the
estimated
and 4 µg ml-1 of standard Curcumin were analyzed by
2.3.6. Robustness
the proposed method. The estimated amounts of
Robustness of the proposed method was also
marketed formulation were compared with that of
determined by changing the λ max of the analysis (λ max
pure Curcumin solution of the same strength.
420 nm) by ± 1.0 nm. % Mean recovery (± %
2.3.3. Linearity and range
confidence interval) as well as % relative error was
Seven different concentrations (1-7µg
ml-1)
of
reported.
Curcumin were prepared in methanol from a fresh
2.3.7. Use of above method for marketed
stock of 10 µg ml-1.Least square regression analysis
formulations
was done for the obtained data.
The content of Curcumin in tablets (labelled claim:
2.3.4. Accuracy
500 mg per tablet) were determined by powdering
In
standard
analysis
method,
three
different
twenty tablets and powder equivalent to 10 mg of
in
Curcumin was weighed. The drug from the powder
methanol were prepared (2.5 µg ml-1, 4 µg ml-1& 5.5
was extracted with methanol (Hanif et al., 1997). For
µg ml-1) from independent stock solutions and their
complete extraction of the drug, it was sonicated for
strengths were estimated by the standard curve.
30 min and volume was made up to 100 ml. The
Standard addition method was followed to support
resulting solution was centrifuged at 2500 rpm for
the accuracy by adding separately three different
10 min and supernatant was analyzed for drug
standard concentrations of Curcumin (0.5 µg ml-1, 1
content.
µg ml-1 and 1.5 µg ml-1) to a pre-analyzed Curcumin
Three different marketed tablets of Curcumin were
solution of 4 µg ml-1 and analyzing them again in the
used to prepare three independent stocks of
concentrations
of
the
standard
Curcumin
same way. The accuracy was reported as % recovery ± (% confidence interval) with % relative error on the base of actual and estimated concentrations. 2.3.5. Precision Repeatability was done by analyzing three different
Curcumin in methanol of 500 µg ml-1 concentration. These three stocks were used individually to prepare three different concentrations of Curcumin (2.5 µg ml-1, 4 µg ml-1 and 5.5 µg ml-1). The prepared solutions were assayed by the proposed method. The
concentrations of Curcumin( 2.5µg ml-1, 4 µg ml-1
% assay values with % confidence intervals are
and 5.5 µg ml-1) in methanol in six let on a single day.
reported.
Intermediate precision was done by analyzing the same three concentrations on three different days in
Int. J. Drug Dev. & Res., April-June 2012, 4 (2): 375-380 Covered in Scopus & Embase, Elsevier
377
Kiran Sharma et al: Development and Validation of UV spectrophotometric method for the estimation of Curcumin in Bulk Drug and Pharmaceutical Dosage Forms
3. RESULTS AND DISCUSSION
different analysts
The proposed method was found to be simple,
assessed
sensitive, accurate, precise, economical and rapid for
Concentrations (2.5, 4.0, 5.5 µg/ml), three times a
the routine estimation of Curcumin in bulk drug and
day.
pharmaceutical dosage forms.
established by analyzing these three different
by
[19, 20].
Repeatability (intraday) was
analyzing
Intermediate
these
precision
three
different
(Interday)
was
concentrations(2.5, 4.0, 5.5 µg/ml), three times a day
FULL Length Research Paper Covered in Index Copernicus with IC Value 4.68 for 2010
3.1.
Analysis of the Drug
for at least three different days (Table 2).
Melting point of curcumin was found to be 183°C.
The Standard Deviation, % RSD and Confidence
Drug was freely soluble in methanol, chloroform,
Interval for the intra-assay precision, intermediate
ethanol, acetone and practically insoluble in water.
precision and reproducibility for all the three
Spectral scan – λmax of curcumin was found to be at
concentration levels were found below 0.018, 0.495,
421 nm.
± 0.014 & 0.016, 0.570, ± 0.013 and 0.09, 100.006, ± 0.072 respectively. The data indicated above showed Analytical
3.2.
Method
Validation
Parameters
an
excellent
intraday
precision,
intermediate
precision and reproducibility of the proposed
The method was validated as per ICH guidelines (Q2
method.
(R1).
3.2.3. Accuracy
3.2.1. Linearity and Range
Accuracy of an analytical method is the closeness of
Linearity of an analytical method is its ability, within
test results to true value. It was determined by the
a given range, to obtain test results that are directly,
application of analytical procedure to recovery
or
studies, where known amount of standard is spiked
through
a
mathematical
transformation,
proportional to concentration of analyte linear
correlations
were
obtained
[17].
Good
between
in preanalyzed samples solutions [21, 22]. The % recovery for the standard analysis and
absorbance and concentration in the selected range
reference
of 1 – 7 µg/ml. Characteristic parameters are Slope ±
concentration levels ranged from 99.1% to 101.4%
S.D. 0.1265 ± 0.15, Intercept ± S.D. 0.0174 ± 0.27,
with confidence interval ranging from ± 0.090 to ±
regression coefficient of 0.9991 and correlation
0.190 showing that any small change in the drug
coefficient of 0.9995 between the standard drug
concentration can be accurately determined with
concentration and corresponding mean absorbance
high accuracy. The results obtained form the
show a good linearity of standard curve (Table 1).
standard addition and reference analysis method
3.2.2. Precision
ware also found supporting the accuracy of the
The precision of an analytical method expresses the
proposed method.
degree of scatter between a series of measurements
3.2.4. Specificity
obtained from multiple sampling of the same
The presence of excipients in formulation does not
homogeneous sample under prescribed conditions
interfere with the drug peak. Therefore, the proposed
[18].
method was found specific and selective for the drug.
Intraday precision refers to the use of analytical
analysis
method
for
all
the
three
procedure within a laboratory over a short period of
3.2.5.
time using the same operator with the same
LOD and LOQ were calculated according to the
equipment whereas Interday precision involves
formulae:
estimation of variations in analysis when a method is
LOD=3.3 σ / S
LOD/LOQ
=0.05µg/ml
used within a laboratory on different days, by
378
Int. J. Drug Dev. & Res., April-June 2012, 4 (2): 375-380 Covered in Scopus & Embase, Elsevier
Kiran Sharma et al: Development and Validation of UV spectrophotometric method for the estimation of Curcumin in Bulk Drug and Pharmaceutical Dosage Forms
LOQ=10 σ / S
DIPSAR), respectively, for their valuable suggestions,
= 0.1724µg/ml
active guidance and facilities provided during
3.2.6. Robustness The variation in the λ
within limits ± 1.0 nm
max
research work.
brought % recovery lying in between 99.0 to 99.7 with a maximum % confidence interval of ± 0.009, indicating it to be a sufficiently robust method. 3.2.7. Application
of
the
Validated
UV-
FULL Length Research Paper Covered in Index Copernicus with IC Value 4.68 for 2010
Visible Spectrophotometer Method on the Figure 1: Structure of Curcumin.
Marketed Formulation The marketed tablet formulations were analyzed by the proposed method. In accordance with ICH
Table 1: Results of validation parameters obtained by the developed method
guidelines the assay values for all these formulations
Validation parameters λ max Beer’s law range (µg ml-1) Slope ± SD Intercept ±SD Correlation coefficient Accuracy Precision (%RSD) LOD (µg ml-1) LOQ (µg ml-1)
were found to be ranging in between 99.89 to 100.19 with a maximum % confidence interval of ± 0.11 (Table 3). 4. CONCLUSION The analytical method developed on UV- Visible
Result obtained 421 nm 1-7 0.1265±0.15 0.0174±0.27 0.9995 99.1-101.4 % 0.39 0.05 0.1724
Spectrophotometer was simple, reliable, accurate and
Table 2: Intra- and interprecision studies (n = 3).
reproducible. The method eliminates extraction steps
Amount of drug injected (µg /ml) Intraday (n = 5) 2.5 4.0 5.5 Intraday (n = 5) 2.5 4.0 5.5
thus reduce analytical time, cost and minimize the extraction errors. Low cost, faster speed, satisfactory precision
and
good
specificity,
to
assess
unequivocally the analyte in the presence of components, which may be expected to be present, are the main features of this method. Method was successfully validated as per ICH guidelines and can be conveniently employed for routine quality control analysis of Curcumin in bulk drug, marketed tablets and other formulations without any interference from excipients. The method was comparable to the
Amount of drug detected (µg, mean ± SD)
%RSD
2.48 (0.012) 4.00 (0.016) 5.49 (0.013)
0.492 0.350 0.235
2.49 (0.012) 4.00 (0.014) 5.49 (0.016)
0.434 0.398 0.289
Table 3: Formulation study data for three different formulations. Sr. No. 1 2 3
Brand Name A B C
Amount labeled 500 500 500
Amount found 499.46 500.01 500.96
SD a 0.084 0.064 0.140
%RSD b
0.017 0.013 0.028
% Recovery 99.89 100.00 100.19
existing methods in all respects, which analyze the drugs but in plasma.
REFERENCES 1)
Hanif R, Qiao L, Shiff SJ, Rigas B 1997. Curcumin,
ACKNOWLEDGEMENTS
a natural plant phenolic food additive, inhibits cell
The authors thank Loba Chieme and Sami Chemicals
proliferation and induces cell cycle changes in colon
Ltd, Mumbai for the gift samples of Curcumin. The
adenocarcinoma cell lines by a prostaglandin-
authors are also grateful to Prof. (Dr.) Shyam S.
independent pathway. J. Lab. Clin. Med. 130: 576-
Agrawal (Professor, Pharmacology, AMITY) and Dr.
584.
Monica Gupta (Lecturer, Pharmaceutical Chemistry,
2)
Almedia LP, Cherubino, APF, Alves RJ, Dufosse L, Gloria MBA 2005. Separation and determination of
Int. J. Drug Dev. & Res., April-June 2012, 4 (2): 375-380 Covered in Scopus & Embase, Elsevier
379
Kiran Sharma et al: Development and Validation of UV spectrophotometric method for the estimation of Curcumin in Bulk Drug and Pharmaceutical Dosage Forms
the physico-chemical characteristics of curcumin,
3)
Food Res Int. 38: 1039-1044.
Press. p 345-442.
Abas F, Lajis NH, Shaari K, Israf DA, Stanslas J,
procedures: text and methodology, November 2005. 15)
FULL Length Research Paper Covered in Index Copernicus with IC Value 4.68 for 2010
A.R., (Eds.), Remington: The science and practice of pharmacy.
Curcumin (diferuloylmethane) down-regulates the
Williams & Wilkins, p. 587-613. 16)
ed.
Philadelphia:
Carr GP 1990. A Parallel Approach to Method
myeloma
Biomed Anal 8: 613-618.
cells,
leading
to
suppression
of 17)
Chapman KG 1993. Validation terminology. In
1053-1062.
Reddy IR, Nash RA, editors. Pharmaceutical
Chan MM 1995. Inhibition of tumor necrosis factor
process validation, 2nd ed., New York: Maecel
by curcumin, a phytochemical. Biochem Pharmacol
Dekker. p 587-596. 18) Chatwal GR, Anand SK. 2007. Instrumental methods of chemical analysis, 5th ed. Gurgaon:
Donatus I A, Sardjoko, Vermeulen N P 1990. Effects on paracetamol-induced cytotoxicity, lipid
Himalaya Publishing House. p 2.613-2.615. 19)
Connors AK. 1999. A textbook of Pharmaceutical
peroxidation and glutathione depletion in rat
Analysis,
hepatocytes. Biochem. Pharmacol. 39: 1869-1875.
Publications. p 581 - 585.
3rd
ed.
New
Curcumin in plasma and urine: quantiation by high
Techniques, 3rd ed., New York: Wiley InterScience. p 283-326. 21)
Mandal
V,
Mohan
Y,
Hemalatha
S
2007.
Optimization of curcumin extraction by microwave assisted in vitro plant cell bursting by orthogonal
Lindsay S. 1987.
HPLC Analytical chemistry by
open learning, 4th ed., New York: John Wiley &Sons. p 54-72. 22) Snyder
LR,
Kirkland
JJ,
Glajch
JL.
1997.
array designed extraction process and HPTLC
Completing the method: Validation and transfer. In
analysis. Phcog Mag. 3:132-138.
Snyder LR, Kirkland JJ, Glajch JL, editors. Practical
Somasundaram S, Edmund NA, Moore DT, Small
HPLC method development, 2nd ed., New York:
GW, Shi YY, Orlowski R Z 2002. Dietary curcumin
John Wiley & Sons. p 233-312.
inhibits chemotherapy-induced apoptosis in models of human breast cancer. Cancer Res. 62: 38683875. 10) Srinivasan KR 1953. A chromatographic study of the curcuminoids in curcuma longa Linn. J. Pharm. Pharmacol. 5: 448-453. Marsin
SM,
Ahmad
UK,
Smith
RM
1993.
Application of supercritical fluid extraction and chromatography to the analysis of turmeric. J Chromatogr Sc. 31: 20-25. Nagabhushan M, Bhide SV 1992. Curcumin as an inhibitor of cancer. J. Am. Coll. Nutr. 11: 192-198.
380
Interscience
20) Helmut G, Alex W. 2001. Hand Book of Analytical
783: 287-95.
12)
York:
Heath DP, Pruitt MA, Brenner DE, Rock CL 2003. performance liquid chromatography. J Chrom B.
11)
Lippincott
Validation in Pharmaceutical Analysis. J Pharm
Cytotoxic and cytoprotective activities of curcumin -
9)
20th
and IKappa-Balpha kinase in human multiple
49:1551-1556.
8)
Bailey, L.C., 2001. Chromatography, in: Gennaro,
Nat Prod 68: 1090–1093.
proliferation and induction of apoptosis. Blood 101:
7)
ICH Guideline Q2(R1), Validation of analytical
Bharti AC, Donato N, Singh S, Aggarwal BB 2003. constitutive activation of nuclear factor-Kappa B
6)
14)
Raof SM 2005. A labdane diterpene
glucoside from the rhizomes of Curcuma mangga. J
5)
Ahuja S, Scypinsk S. 2001. Handbook of modern pharmaceutical analysis. 5th ed., London: Academic
Yusuf UK,
4)
13)
demethoxycurcumin and bisdemethoxycurcumin.
Int. J. Drug Dev. & Res., April-June 2012, 4 (2): 375-380 Covered in Scopus & Embase, Elsevier