JITV Vol. 15 No. 1 Th. 2010: 22-30
Supplementing Energy and Protein Source at Different Rate of Degradability to Mixture of Corn Waste and Coffee Pod as Basal Diet on Rumen Fermentation Kinetic of Beef Cattle DICKY PAMUNGKAS1, R. UTOMO2, N. NGADIYONO2 and M. WINUGROHO3 2
1 Loka Penelitian Sapi Potong, Grati Fakultas Peternakan Universitas Gadjah Mada, Yogyakarta 3 Balai Penelitian Ternak, PO Box Ciawi Bogor
(Received by editor 14 Desember 2009)
ABSTRAK PAMUNGKAS, D., R. UTOMO, N. NGADIYONO dan M. WINUGROHO, 2009. Suplementasi sumber energi dan protein dengan laju degradasi berbeda pada pakan basal tumpi jagung dan kulit kopi terhadap kinetika hasil fermentasi rumen sapi potong. JITV 15(1): 22-30. Pemanfaatan tumpi jagung dan kulit kopi sebagai pakan basal pada ruminansia memerlukan suplementasi sumber energi dan protein guna mengoptimalkan pertumbuhan mikroba dalam rumen. Suatu penelitian telah dilakukan untuk menentukan jenis suplemen dengan laju degradasi rumen yang tepat pada pakan basal tumpi jagung dan kulit kopi berdasarkan kinetika hasil fermentasi rumen. Sebanyak 4 ekor sapi PO betina (bobot badan 205-224 kg) berfistula yang ditempatkan dalam kandang individu digunakan sebagai materi penelitian. Pakan basal berupa tumpi jagung dan kulit kopi (80:20, berdasarkan bahan kering). Bahan pakan sumber energi degradasi cepat (EDC) berupa onggok kering; sedangkan sumber energi degradasi lambat (EDL) adalah ampas pati aren. Pakan suplemen sumber protein degradasi cepat (PDC) adalah konsentrat dan bahan sumber protein degradasi lambat (PDL) adalah tepung daun lamtoro. Suplementasi sumber energi dan protein pada pakan basal diatur dalam imbangan 50 : 50 berdasarkan bahan kering (BK). Pakan yang diberikan berupa pakan basal dan suplemen pada imbangan 60 : 40 (3% robot badan). Pengamatan dilakukan selama 4 periode, masing-masing periode dilaksanakan selama 10 hari. Setiap periode sapi secara bergantian mendapat pakan (A) = pakan basal (PB), (B) = PB+ EDC+PDL, (C) = PB+EDL+PDL, dan (D) = PB+EDC+PDC. Kinetika hasil fermentasi rumen yang diamati: pH, VFA, NH3 dan protein mikroba rumen. Pengambilan cairan rumen pada akhir periode dilakukan secara bertahap selama 24 jam fermentasi. Perbedaan pakan menunjukkan perbedaan pH (P < 0,05) dengan pH terendah (5,76) dihasilkan pada sapi yang mendapat pakan D pada 12 jam setelah pemberian pakan (pukul 20,00) Sedangkan pH tertinggi (7,22) pada sapi yang mendapat pakan A, yakni 8 jam setelah pemberian pakan (pukul 16.00). Kandungan total VFA pada pakan D periode 1, 3 dan 4 menunjukkan angka tertinggi ( 68,10 mmol/l; 75,37 mmol/l dan 85,14 mmol/l) apabila dibandingkan dengan pakan lain pada keseluruhan periode. Perlakuan pakan D menunjukkan konsentrasi NH3 tertinggi, diikuti perlakuan pakan C, B dan A. Pada pengamatan pukul 12.00 yakni 4 jam setelah pemberian pakan pagi pada perlakuan pakan D menunjukkan konsentrasi NH3 paling tinggi (41,94 mg/100 ml). Disimpulkan bahwa pakan D menghasilkan kinetika hasil fermentasi rumen paling optimal sehingga dapat digunakan sebagai acuan untuk penyusunan ransum sapi potong. Kata kunci: Tumpi Jagung, Kulit Kopi, Degradasi, Fermentasi Rumen ABSTRACT PAMUNGKAS, D., R. UTOMO, N. NGADIYONO and M. WINUGROHO, 2009. Supplementing energy and protein source at different rate of degradability to mixture of corn waste and coffee pod as basal diet on rumen fermentation kinetic of beef cattle. JITV 15(1): 22-30. The use of corn waste and coffee pod as basal diet needs energy and protein supplementation in order to optimize rumen microbial growth. A research was done to study the appropriate supplement which is suitable based on the result of rumen fermentation kinetics. Four ruminally canulated cows, (205-224 kg of live weight) were placed in individual cages. The basal diet (BD) offered were corn waste and coffee pod mixture (80:20). Source of high degradable energy (HDE) was cassava pomace; while the low degradable energy (LDE) was arenga piñata waste. The high degradable protein (HDP) was mixedconcentrate while the low degradable protein (LDP) was leucaena leave meal. The supplementation of energy and protein to basal diet was in ratio of 50:50 based on dry matter. Feed offered were basal diet and the supplement at ratio of 60: 40 (3 % of LW). Observation was carried out for 4 periods (10 days/period). In each period, animal was fed one of the following diets: A = BD, B = BD+ HDE+LDP, C = BD+LDE+LDP, and D = BD+HDE+HDP. Rumen kinetics observed were: pH, and VFA, NH3 and rumen microbial protein concentrations. Rumen fluid was taken at the end of each period gradually along the course of 24 hours fermentation. The results showed that the diets gave significant effect (P < 0.05) on rumen pH. The lowest rumen pH (5.76) was observed on diet D at 2:00, 12 hours after feeding. Meanwhile, the highest pH (7.22) was found in animal fed diet A at 16:00. The total VFA on diet D of periode:1, 3 and 4 showed the highest level: 68.1 mmol/l; 75.37 mmol/l and 85.14 mmol/l respectively. The highest NH3 concentration was found in diet D followed by diet C, B and A. At 12:00 observation or at 4 h
22
PAMUNGKAS et al. Supplementing energy and protein source at different rate of degradability to mixture of corn waste and coffee pod
after morning feeding the highest NH3 was observed from diet D (41.94 mg/100 ml). It is concluded that diet D resulted in the best rumen fermentation kinetic, therefore it could be used in feed formulation in cattle diets. Key words: Corn Waste, Coffee Pod, Degradation, Rumen Fermentation
INTRODUCTION Ruminant diet was made based on nutrient content such as: crude fiber, fat, crude protein and non free extract nitrogen. Some researches had proved that digestion rate of carbohydrate and protein diet in rumen have big impact on final result of fermentation and animal performance. Feedstuffs from agricultural wastes or straw generally are rich in cell wall and poor in nitrogen content, therefore, the digestibility and palatability were low (UTOMO, 2001; GINTING, 2005). Selecting and optimalizing the use of agricultural and estate crop wastes as ruminant feed is one of strategies to be observed based on characteristic of nutrient content and its degradability. The agricultural and estate crops waste were used as fiber and energy sources for microbial growth (UTOMO, 2001). Classification of feedstuffs based on nutrient content and rate of degradability in rumen was needed to formulate a balance ration. Based on the rate of degradability in rumen feed supplement of concentrate was divided into: (1) source of low degradable crabohydrate; (2) source of high degradable carbohydrate; (3) source of high degradable protein and (4) source of low degradable protein. The determination of rate of feed nutrient degradability was based on in sacco degradablity (UTOMO, 2001). Corn waste which is bulky and dusty is industrial waste of corn seed milling. Yield of corn waste on corn seed is 2%. Dry matter content, crude protein, crude fat, crude fiber, ash and total digestible nutrient of corn waste were 97.0%, 7.6%, 1.6%, 19.0%, 3.3% and 72.9 %, respectively (MARIYONO and KRISHNA, 2009). The advantage of using corn waste is due to no competition with poultry feed. Corn waste can also be used as filler in a complete feed or concentrate susbtitution. Besides if it is combined with feed supplement will significantly improved cattle productivity. Corn waste in mixture with elephant grass and rice straw as a basal feed supplemented by concentrate in Ongole bull resulted in daily weight gain of 0.85 kg/day (HARTATI et al., 2005). Dried coffee pods has OM, CP, Fat, CF (including lignin), Ash, Ca, P, ME and TDN as of 88.30%, 10.40%; 2.13%; 17.20%; 7.34%; 0.48%; 0.04%, and 14.34 MJ/kg and 52.80% (ZAINUDDIN and MURTISARI, 1995). Coffee processing may produce coffee shell 45%, mucous 10%, pericarp 5% and coffee seed 40% (for human need). Dry processing resulted in coffee pods high in fiber, nationally as much as 373,983.8 ton/year, equivalent to 197,584.7 ton TDN/year (UMIYASIH et al.,
2006). Based on DM produced it is assumped that coffee pod as fiber source to substitute 20% concentrate, can supply approximately 525,443.6 of ruminant animal unit (AU). Effectiveness of utilizing agricultural waste was dictated by the ability of microbes to hydrolize carbohydrate and to produce non protein nitrogen for maintenance and production. The use of agricultural waste as basal diet with supplementation becomes a strategic way to be developed with regards to choosing degradable energy and nitrogen sources. The synchronization of supplemental energy and CP could theoretically improve the utilization of N from in diets (BRODERICK, 2003), but this effect has not been well documented. In fact, there is little experimental evidence to support the benefits of close synchrony of energy and nitrogen release; indeed, owing to a compounding of effects of changes in dietary ingredients with effects of synchrony itself. The purpose of the research is to enhance the efficiency of rumen fermentation of PO cattle and to get the information of mechanism and dominant factors in digestion in beef cattle fed corn waste and coffee pods which are supplemented with carbohydrate and protein source with different rate of degradability. MATERIALS AND METHODS Location The research was done in the barn and laboratory of Animal Feed and Nutrition Technology of Animal Husbandry Faculty Gadjah Mada University, Yogyakarta. Materials Four rumen fistulated cows (205-224 kg live weight) were subjected to individual pens. The basal feed given were corn waste and coffee pods (80:20). Source of high degradable energy (HDE) was cassava pomace; while source of low degradable energy (LDE) was arenga waste. Feed supplement of high degradable protein (HDP) was concentrate and low degradable protein (LDP) was leucaena leave meal. Supplementation of energy and protein sources was aligned to 50:50 ratio based on dry matter. The basal feed and supplement mixture (60:40, dry matter basis) was given as 3% of live weight.
23
JITV Vol. 15 No. 1 Th. 2010: 22-30
RESULT AND DISCUSSION
Methods Research was done in four periods (P1, P2, P3 and P4). Each period covered 10 days (3 days of adaptation and 7 days of observation). The lay-out of research was shown in Table 1. Rumen fermentation kinetics was the measurement of pH, VFA, NH3 and determining dry matter and rumen microbial protein. The pH was measured by pH meter, whilst VFA concentration was observed by using gas chromatography. Ammonia levels were determined by spectrophotometer and the method of Lowry (WILSON and WALKER, 2000) was used to calculate biomass-microbial protein. Four experimental diets examined were: corn waste and coffee pods (80:20) as basal diet or a control (A); basal + (cassava pomace+leucaena leaf meal mixture) (B); basal + (arenga waste + leucaena leaf meal mixture) (C); and basal + (cassava pomace +concentrate mixture) (D). Each supplements a mixture of two sources in 50:50 ratios. In this case: cassava pomace was high degradable energy (HDE) feed, leucaena leaf meal was low degradable protein (LDP) feed, arenga waste was low degradable energy (LDE) feed and concentrate was high degradable protein (HDP). Composition of each experimental diet is shown in Table 1. Each animal was fed at 08.00 am. Table 1. Lay out of trials on rumen kinetics fermentation Animal Period 1
2
3
4
P1
A
B
C
D
P2
D
A
B
C
P3
C
D
A
B
P4
B
C
D
A
A= basal: corn waste + coffee pods (80:20) B= basal + HDE + LDP(60:20:20) C= basal + LDE + LDP (60:20:20) D= basal + HDE + HDP (60:20:20)
At the end of each period, rumen fluid samples were taken from each animal hourly: before, at and after morning feeding time, from 7:00 to 12:00 (6 samples), then, samples were taken at every two hours from 14:00 to 06 : 00 for pH determination, while the 7thsample for acid and NH3 analyses was collected from the mixture of samples taken hourly from 14:00 to 6:00. to represent a 24 hours profile. The data of rumen kinetics were analyzed by cross over design (SASTROSUPADI, 2000) Proximate analysis was conducted to determine the nutrient content of feed used in examining the rumen fermentation kinetics. The procedure for proximate analysis was following AOAC (1990).
24
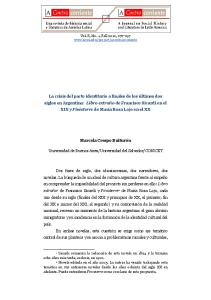
Nutrient content of diets The mixture of basal diet with HDE and HDP (diet D) showed the highest CP (13.67%) followed by basal diet mixed with HDE and LDP (diet B) (11.38%), basal diet mixed with LDE and LDP (diet C) (8.71%) and single basal diet (diet A) (6.47%). Meanwhile the highest NDF was diet C (85.39%). High NDF in this diet was affected by high cell wall and crude fiber content of arenga wastes, coffee pods and corn waste (Table 2). Rumen pH One indicator of changes in rumen fermentation was pH. In this research the fluctuation of rumen pH in the course of 24 hours was illustrated in Figure 1. (at pH 5.76 – 7.22) This finding is similar to the report of DEVANT et al. (2001) on heifers fed with different sources of natural protein which ranged at pH 6.19 – 6.39. The observed diurnal pH fluctuation may be the result of the DMI pattern and carbohydrate digestion rates (PITT and PELL, 1997). ARORA (1989) reported that saliva which entered rumen as a buffer aided to persist pH in the level of 6.8, caused by high ion of HCO3- dan PO-4. Moreover KARSLI and RUSSEL (2001) stated that rapid digestion of nonstructural carbohydrate results in reduced ruminal pH. The efficiency of microbial protein synthesis is reported to be low in animals fed high-concentrate diets because of reduced ruminal pH. Statistic analysis showed that there were significant differences in rumen pH among diets (P 0.05). CULLISON (1979) reported that organic matter (amylum, cellulose and hemicellulose) will be fermented by microbes to organic acids such as C2, C3, C4 and the
gasses which were CH4 and CO2. The proportion of C2 was higher than those of C3 and C4 (Table 3). C2 is the most produced by all type of bacteria in rumen followed by C3, C4, and valeric (HUNGATE, 1966). The low ratio of C2/C3 will enhance body fat for fattening systems. Rumen ammonia concentration The product of rumen NH3 depended on protein diet, degradation rate and time after feeding. Dietary protein entering rumen will be fermented by proteolytic microbes (bacteria and protozoa). Bacteria and protozoa produce proteolytic enzyme such as protease, peptidase and deaminase that digest protein into amino acids, peptides and ammonia (CHUZAEMI and BRUCHEM, 1990). The average rumen NH3 in each diet group in this research is shown in Table 4.
Table 3. Production of VFA, CH4, CO2, ratio C2 and C3 and total VFA at each period and type of diet VFA (mmol/l)
CH4 (mol)
CO2 (mol)
Ratio C2/C3
Total VFA (mmol/l)
3.41
18.45
27.28
3.59
53.16
13.75
4.20
17.15
28.22
2.69
54.92
32.99
6.73
3.78
16.70
23.84
4.90
43.50
49.10
10.86
8.14
25.90
39.48
4.52
68.10
A
33.84
7.31
3.59
16.88
24.13
4.63
44.74
B
46.31
10.17
5.65
23.44
34.17
4.56
62.12
C
36.37
7.75
4.01
18.25
26.14
4.69
48.13
D
31.76
5.87
3.56
16.19
22.68
5.41
41.19
A
26.39
4.55
2.79
33.73
18.52
5.81
33.73
B
26.78
9.62
3.25
12.61
20.67
2.78
39.66
C
37.76
8.11
3.90
18.80
26.76
4.66
49.77
D
47.98
17.90
9.49
24,26
42.70
2.68
75.37
A
44.76
9.08
5.57
59.41
33.00
4.93
59.41
B
61.86
16.99
8.51
30.94
47.94
3.64
87.35
C
48.76
14.87
6.92
24.12
38.47
3.28
70.54
D
57.44
16.40
11.30
30.27
49.77
3.50
85.14
Diet C2
C3
C4
A
38.92
10.84
B
36.98
C D
Period 1
Period 2
Period 3
Period 4
C2 = acetic acid, C3 = propionic acid, C4 = butyric acid. A = basal: corn waste + coffee pods (80:20); B= basal+HDE+LDP(60:20:20) C = basal+LDE+LDP (60:20:20); D= basal+HDE+HDP (60:20:20)
26
PAMUNGKAS et al. Supplementing energy and protein source at different rate of degradability to mixture of corn waste and coffee pod
Composite
Composite 12.00 Tim e observation
Tim e observation
12.00 Diet D
11.00
Diet C
10.00
Diet B Diet A
9.00
Diet C
10.00
Diet B
9.00
Diet A
8.00
8.00
7.00
7.00 0,00
Diet D
11.00
10,00
20,00
30,00
40,00
50,00
0,00
60,00
2,00
4,00
6,00
8,00
10,00
12,00
14,00
16,00
(mmol/l)
(mmol/l)
Fig. production Fig.3. 3. Propionic Propionic acid acid production
Fig. Aceticacid acidproduction. production Fig. 2.2.Acetic
Composite
Time observation
12.00 Diet D
11.00
Diet C 10.00
Diet B Diet A
9.00 8.00 7.00 0,00
2,00
4,00
6,00
8,00
10,00
(mmol/l)
Fig. 4. Fig. 4. Butyric Butyric acid acidproduction production
The concentration of NH3 rumen at different time observation which at 07.00 am to 06.00 am was highly significant different (P < 0.01) within respective diets. Basal diet mixed with HDP and HDP (D) showed the highest NH3 followed by basal diet mixed with LDE and LDP (C), basal diet mixed with HDE and LDP (B) and basal diet (A). At 12.00 (four hours after morning feeding) the value in diet D was the highest (41.94 mg/100 ml). High concentration of NH3 in diet D might be related to protein content in the diet. If optimum concentration of rumen NH3 for microbial growth is reached, the remaining NH3 will be absorbed by blood through rumen wall brought to the liver to be recycled in the form of urea, either through the saliva or directly to the rumen and partly lost or excreted to the feces (MCDONALD et al., 1988). OWEN dan ZINN (1988) added that NH3 level will increase after time feeding until it reached an optimum level, then decreases. At 24 hours after feeding ammonia concentration reaches maximum value. Rumen microbes can not develop if nitrogen supply was limited. Nitrogen was essential materials for microbial protein synthesis. Diets containing sources affecting different fermentation rates may not require the same ruminal N NH3 concentrations. The low ruminal ammonia N concentration in the metabolism trial reduced daily gain and feed efficiency. The finishing trials for steers fed
diets containing no urea indicates deficiency in degradable intake protein (SHAIN et al., 1998). Microbial biomass protein Concentration of microbial biomass protein in the rumen is an indicator of fermentation effectiveness. The degradable protein requirement in rumen is considered to be equal to bacterial crude protein synthesis. Rumen microbial protein represents a major source of amino acids to the ruminant animal. Microbial protein contributes about two thirds of the amino acids absorbed by ruminants. Daily microbial protein synthesis is different from the efficiency of microbial protein synthesis. Daily microbial protein synthesis is the product of the efficiency of microbial protein synthesis. By the procedure of Lowry microbial biomass concentration was determined on three points of observation at, before, and after feeding time i.e. at 7:00, 12:00 and 16:00 (Table 5). The value in microbial biomass protein increased at 12:00 then declined at 16:00, except for basal diet (A and B). It meant that microbial biomass protein increased at four hours after feeding along with ammonia concentration also rises. Basal diet mixed with HDE and HDP (D) and basal diet mixed with LDE and LDP (C) at 12:00 were the highest
27
JITV Vol. 15 No. 1 Th. 2010: 22-30
(411.46 mg/ml and 407.43 mg/ml). Meanwhile, the lowest (153.96 mg/ml) occurred in basal diet mixed with HDE and LDP (B) at 07:00. The increase of microbial biomass protein in this experiment was equal to the increase of total VFA (as shown in Table 3). PARAKKASI (1999) stated that microbial protein synthesis need nitrogen from ammonia and energy which derived from VFA. At four hours after feeding time (at 12:00) highly crude protein content (13.67%) in basal diet supplemented by HDE and HDP (diet D) resulted in highest of microbial biomass protein. In contrast, single basal diet (without supplementation) which lowest of CP (6.47%) showed the lowest of microbial biomass protein. PATHAK (2008) stated that the crude protein content of many practical diets may be greater than the 11% CP required to supported optimal microbial growth; the resistance of proteins to microbial degradation may limit microbial protein synthesis. Protein degradation in the rumen is one of the main reasons for the inefficient utilization of protein in ruminants. On the other hand, nitrogen compounds, which are released during the protein degradation, are crucial for microbial growth in the rumen. It seems that protein which have lower rate of ruminal degradation tend to improve the efficiency of microbial protein
synthesis, probably because of the better capture of released N by rumen microbes. Amino acid supply in the small intestines of ruminants is from the dietary protein escaped from the degradation in the rumen (rumen undegradable protein) and from the rumen microbial protein washed and flowed to the intestine. Generally, microbial protein is a main source of duodenal protein, along with un-degradable protein is in less contribution. Estimation rate of undegraded protein flow can be predicted from non microbial protein and of less endogenous protein rate (BEEVER, 1993). CONCLUSION Supplementing high degraded energy along with high degraded protein in basal diet of corn waste and coffee pods is the best combination regardless of enhancing the efficiency of rumen fermentation of PO cattle. This supplementation resulted in the highest of VFA concentration, ammonia and microbial biomass protein. The combination of highly degradable energy and protein which consisted of cassava pomace and concentrate mixture is considered to be a proper supplement to the basal diet of corn waste and coffee pods in beef cattle diet.
Table 4. Rumen NH3 concentration in cows fed different diets (mg/100 ml) Time of rumen fluid taken at
Diet 7:00
8:00
9:00
10:00
11:00
12:00
a
a
a
a
a
5.84a
A
4.96
7.65
7.33
6.58
8.38
B
16.28b
15.15b
17.54b
18.63b
28.00b
27.15b
C
26.50c
21.31c
25.58c
30.19c
27.91b
26.91b
D
36.43d
36.23d
34.53d
30.98d
39.89c
41.94c
a-d Different superscript at the same column showed highly significant difference (P < 0.01) A= basal: corn waste + coffee pods (80:20); B = basal + HDE + LDP(60:20:20) C= basal + LDE +LDP (60:20:20) ; D = basal + HDE + HDP (60:20:20)
Table 5. Microbial biomass protein at different time fermentation and diet Time observation Diet
07:00
12:00
16:00
Average
(mg/ml) A
b
244.83a
142.83a
246.63
a
ab
a
352.23
B
153.96
336.29
180.36
223.54
C
280.43ab
407.43b
202.56a
296.80
D
b
b
a
326.85
388.56
411.36
Different superscript at the same column indicate significant difference (P < 0.05) A= basal: corn waste + coffee pods (80:20); B = basal + HDE + LDP (60:20:20) C= basal + LDE + LDP (60:20:20); D = basal + HDE + HDP (60:20:20)
28
180.63
PAMUNGKAS et al. Supplementing energy and protein source at different rate of degradability to mixture of corn waste and coffee pod
ACKNOWLEDGEMENT Highly appreciation is given to Indonesian Agriculture Agency for Research and Development (IAARD, Badan Litbang Pertanian) for funding this collaboration research project (KKP3T 2008) between IAARD and Gadjah Mada University, Yogyakarta. REFERENCES AOAC. 1990. Official Methods of Analysis. 15th ed. Assoc. Off. Anal. Chem., Arlington, VA. ARORA, S.P. 1989. Pencernaan Mikroba pada Ruminansia. Alih bahasa : Muwarni. Gadjah Mada University Press. Yogyakarta. BEEVER, D.E., 1993. Rumen Function. In: Quantitative Aspects of Ruminant Digestion and Metabolism. FORBES, J.M. and J. FRANCE (eds.). CAB International, Wallingford, England. pp. 187-215. BIRICIK, H., I.I. TURKMEN, G. DENIZ, B.H., GULMEZ, H. GENCOGLU and B. BOZAN. 2006. Effects of synchronizing starch and protein degradation in rumen on fermentation, nutrient utilization and total tract digestibility. Ital. J. Anim. Sci. 5: 341-348. BRODERICK, G.A. 2003. Effects of varying dietary protein and energy levels on the production of lactating dairy cows. J. Dairy Sci. 86: 1370-1381. CALSAMIGLIA, S., P.W. CARDOZO, A. FERRET and A. BACH. 2008. Changes in rumen microbial fermentation are due to a combined effect of type of diet and pH. J Anim. Sci. 86: 702-711. CHUZAEMI, S. dan J.V. BRUCHEM. 1990. Fisiologi Nutrisi Ruminansia. Universitas Brawijaya. Malang. CULLISON, A.E. 1979. Feed and Feeding. 2nd Edition. A Prentice Hall of India Private Limited. New Delhi. CZERKAWSKI, J.W. 1986. An Introduction to Rumen Studies. Programon Press. England. DEVANT, M., A. FERRET, S. CALSAMIGLIA, R. CASALS and J. GASA. 2001. Effect of nitrogen source in highconcentrate, low-protein beef cattle diets on microbial fermentation studied in vivo and in vitro. J. Anim. Sci. 79: 1944-1953. GINTING, S.P. 2005. Sinkronisasi degradasi protein dan energi dalam rumen untuk memaksimalkan produksi protein mikroba. Wartazoa 15: 1-10. HARTATI, MARIYONO dan D.B. WIJONO. 2005. Respons Pertumbuhan Sapi Peranakan Ongole dan Silangan pada Kondisi Pakan Berbasis Low External Input. Prosiding Seminar Nasional Teknologi Peternakan dan Veteriner, Bogor, 12-13 September 2005. Puslitbang Peternakan. Bogor. p. 195-200. HUNGATE, R.E. 1966. The Rumen and Its Microbes. Academic Press, New York.
KARSLI, M.A. and J.R. RUSSELL. 2001. Effects of some dietary factors on ruminal microbial protein synthesis. Turk. J. Vet. Anim. Sci. 25: 681-686. LANA, R.P., J.B. RUSSEL and M.E.V. AMBURGH. 1998. The role of pH in regulating ruminal methane and ammonia production. J. Anim. Sci. 76: 2190-2196. MARIYONO dan N.H. KRISHNA. 2009. Pemanfaatan dan keterbatasan hasil ikutan pertanian serta strategi pemberian pakan berbasis limbah pertanian untuk sapi potong. Wartazoa 19: 31-42. MCDONALD, P., R.A. EDWARD and J.F.D. GREENHALGH. 1988. Animal Nutrition. 4th Edition. Longman. London and New York. OWEN, F.N. and R. ZINN. 1988. Protein Metabolism of Ruminant Animal. In: D.C. CHURCH (Ed.). The Ruminant Animal Digestive. Physiology and Nutrition. Prentice Hall. New Jersey. pp. 147-171. PARAKKASI, A. 1999. Ilmu Nutrisi dan Makanan Ternak Ruminan. Universitas Indonesia. Jakarta. PATHAK, A.K. 2008. Various factors affecting microbial protein synthesis in the rumen. Review. Vet. World 1: 186-189. PITT, R.E. and A.N. PELL. 1997. Modeling ruminal pH fluctuations: Interactions between meal frequency and digestion rate. J. Dairy Sci. 80: 2429–2441. RUSSELL, J.B. 1998. The importance of pH in the regulation of ruminal acetate to propionate ratio and methane production in vitro. J. Dairy Sci. 81: 3222–3230. RUSSELL, J.B. and D.B. WILSON. 1996. Why are ruminal cellulolytic bacteria unable to digest cellulose at low pH?. J. Dairy Sci. 79: 1503-1509. SASTROSUPADI, A. 2000. Rancangan Percobaan Praktis dalam Bidang Pertanian. Penerbit Kanisius. Yogyakarta. SHAIN, D.H., R.A. STOCK, T.J. KLOPFENSTEIN and D.W. HEROLD. 1998. Effect of degradable intake protein level on finishing cattle performance and ruminal metabolism. J. Anim. Sci. 76: 242-248. UMIYASIH, U., Y.N. ANGGRAENY dan N.H. KRISHNA. 2006. Pemanfaatan tumpi jagung dalam ransum sapi potong terapan LEISA. Prosiding Lokakarya Nasional Jejaring Pengembangan Sistem Integrasi Jagung-Sapi. Pontianak, 9-10 Agustus 2006. Puslitbang Peternakan. Bogor. hlm. 154-158. UTOMO, R. 2001. Penggunaan Jerami Padi Sebagai Pakan Basal: Suplementasi Sumber Energi dan Protein terhadap Transit Partikel Pakan, Sintesis Protein Mikroba, Kecernaan dan Kinerja Sapi Potong. Disertasi. Universitas Gadjah Mada. Yogyakarta. VAN SOEST, J.P. 1994. Nutritional Ecology of Ruminant. 2th Edition. Cornell University Press. WEIMER, P.J. 1998. Manipulating ruminal fermentation: a microbial ecological perspective. J. Anim. Sci. 76: 31143122.
29
JITV Vol. 15 No. 1 Th. 2010: 22-30
WILSON, K. and J. WALKER. 2000. Practical Biochemistry: Principles and Techniques. Cambridge University Press. ZAINUDDIN, D. dan T. MURTISARI. 1995. Penggunaan limbah agro-industri buah kopi (kulit buah kopi) dalam ransum ayam pedaging (broiler). Pros. Pertemuan Ilmiah
30
Komunikasi dan Penyaluran Hasil Penelitian. Pendayagunaan Hasil-hasil Penelitian untuk Menunjang Industri Peternakan di Pedesaan. Bandungan, Semarang 10 Januari. Buku 1. Sub Balitnak Klepu. Semarang. hlm. 71-79.