IntroductoryPriceElasticity.xls Introduction to the Own-Price Elasticity of Demand and Supply P. LeBel
© 2003, 1999
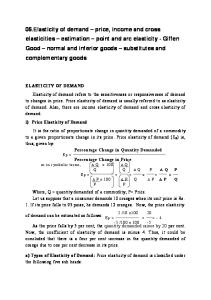
The own-price elasticity of demand measures the relative change in quantity demanded for a one percent change in price. Since normal demand curves are downward-sloping, they all have negative computed own-price elasticity of demand coefficients. If we ignore the negative sign and use only the absolute value, we can derive important insights between the own-price elasticity of demand and the corresponding level of total revenue of a given demand function. Before we do so, let us look first at two ways of calculating the own-price elasticity of demand. The first way to calculate the own-price elasticity of demand is in terms of any adjacent values along a given demand schedule. The formula for this calculation is given as: (1.00) Upper Point:
(2.00)
Lower Point:
or it can be computed (Q1 - Q2) (Q1 - Q2) alternatively as: Q1 Q2 (P1 - P2) (P1 - P2) P1 P2 The problem is that use of either the upper or lower point formulat will result in a biased estimate of the true value of the own-price elasticity of demand. It is for this reason that economists have adopted use of the arc-price formula, which is a weighted average of the upper and lower point estimates: (3.00)
Arc-Price, or Mid-Point, Demand Elasticity Formula: (Q1 - Q2) (Q1+Q2) (P1-P2) (P1+P2)
We turn next to total revenue, which is the price times the quantity along each point of the demand schedule. We find that regardless of the demand curve, there is a quadratic relationship in the corresponding total revenue curve. It also turns out that total revenue will increase over a range of the demand curve where the absolute value of the own-price elasticity of demand is greater than one. Total revenue is at a maximum where the own-price elasticity of demand has a unitary absolute value, and then will decline as the own-price elasticity of demand ranges between one and zero. It is this relationship that forms the basis of the total revenue test. The total revenue test uses the own-price elasticity of demand to predict what effect a price increase or decrease will have on total revenue. As long as the absolute value of the own-price elasticity of demand is greater than one, an increase in price will result in a decrease in total revenue, while over the same range, a decrease in price will result in an increase in total revenue. The opposite relationship will hold over the inelastic range of the demand curve, that is, where the absolute value of the own-price elasticity of demand lies between zero and one. It is only at the unitary elasticity of demand point along the demand curve that neither a price increase nor a price decrease will have any effect on total revenue. The own-price elasticity of demand is central to the success of any product market strategy. Since the shape and position of a demand curve predetermine the corresponding own-price elasticity of demand, the first step in selecting a successful marketing strategy thus is to determine the basic level of market demand as well as the given level of the own-price elasticity of demand. One can arrive at this knowledge through experiments based on product market surveys, as well as through econometric estimation. The larger is the financial stake in a given product, the greater will be the value in undertaking a comprehensive study of demand. There are four key determinants to the own-price elasticity of demand. They are: 1. The Degree of Substitutability of the Product 2. The Proportion of Income Spent on a Good 3. Whether a good is a Luxury or Necessity 4. Time Econometric estimates are essential if each of these determinants is to be fully known in the measurement of the own-price elasticity of demand.
-1-
IntroductoryPriceElasticity.xls Examples of the Own-Price Elasticity of Demand
Quantity
Price
1 2 3 4 5 6 7 8
A.
$8.00 $7.00 $6.00 $5.00 $4.00 $3.00 $2.00 $1.00
Upper
Lower
Mid-
Total
Point
Point
Point
Revenue
3.5000 2.0000 1.2500 0.8000 0.5000 0.2857 0.1250
8.0000 3.5000 2.0000 1.2500 0.8000 0.5000 0.2857
$8.00 $14.00 $18.00 $20.00 $20.00 $18.00 $14.00 $8.00
5.0000 2.6000 1.5714 1.0000 0.6364 0.3846 0.2000
Product Demand Curve - A
Total Revenue Curve - A
$10
$25
$8
$20
$6
$15
$4
$10 $5
$2
$0
$0 1
2
3
4
5
Quantity
7
Price
1 2 3 4 5 6 7 8
B.
6
1
8
2
3
4
5
6
7
Upper
Lower
Mid-
Total
Point
Point
Point
Revenue
$16.00 $14.00 $12.00 $10.00 $8.00 $6.00 $4.00 $2.00
3.5000 2.0000 1.2500 0.8000 0.5000 0.2857 0.1250
8.0000 3.5000 2.0000 1.2500 0.8000 0.5000 0.2857
8
$16.00 $28.00 $36.00 $40.00 $40.00 $36.00 $28.00 $16.00
5.0000 2.6000 1.5714 1.0000 0.6364 0.3846 0.2000
Total Revenue Curve - B
Product Demand Curve - B $45 $40 $35 $30 $25 $20 $15 $10 $5 $
$18 $16 $14 $12 $10 $8 $6 $4 $2 $ 1
2
3
4
Quantity
C.
2 4 6 8 10 12 14 16
5
6
Price
$16.00 $14.00 $12.00 $10.00 $8.00 $6.00 $4.00 $2.00
7
8
1
2
3
4
5
6
Upper
Lower
Mid-
Total
Point
Point
Point
Revenue
3.5000 2.0000 1.2500 0.8000 0.5000 0.2857 0.1250
-2-
8.0000 3.5000 2.0000 1.2500 0.8000 0.5000 0.2857
5.0000 2.6000 1.5714 1.0000 0.6364 0.3846 0.2000
$32.00 $56.00 $72.00 $80.00 $80.00 $72.00 $56.00 $32.00
7
8
IntroductoryPriceElasticity.xls Total Revenue Curve - C
Product Demand Curve - C $100
$20
$80
$15
$60 $10
$40
$5
$20 $
$
1 2
4
6
8
10
Quantity
12
2
3
4
5
6
7
8
7
8
16
Price
2 4 6 8 10 12 14 16
D.
14
$8.00 $7.00 $6.00 $5.00 $4.00 $3.00 $2.00 $1.00
Upper
Lower
Mid-
Total
Point
Point
Point
Revenue
3.5000 2.0000 1.2500 0.8000 0.5000 0.2857 0.1250
8.0000 3.5000 2.0000 1.2500 0.8000 0.5000 0.2857
$16.00 $28.00 $36.00 $40.00 $40.00 $36.00 $28.00 $16.00
5.0000 2.6000 1.5714 1.0000 0.6364 0.3846 0.2000
Total Revenue Curve - D
Product Demand Curve - D $10
$50
$8
$40
$6
$30
$4
$20
$2
$10 $
$ 1
2
3
4
5
6
7
1
8
2
3
4
5
6
We can now revisit the issue of the own-price elasticity of demand, as well as the own-price elasticity of supply, deriving estimates using a point formula from the corresponding equations, and which we may then use to derive comparisons based on the arc-elasticity formulation. First, consider the following inverse demand and supply functions:
Pd =
a +100.00
b -4.00 Qd
Ps =
c +20.00
d +2.00 Qs
From these equations, the corresponding point estimate of the own-price elasticity of demand can be defined as: (4.00)
εd =
Pd/bQ
(5.00)
εs = Ps/dQ
We first calculate the demand and supply price schedules from the given functions for the range of quantity values in column 1. Next, we calculate the point and arc-price own-price elasticity values over the range of quantity and price values for the demand and supply functions, reporting the absolute value of each calculation: Third, we calculate the ratio of the point to arc elasticity of supply and demand function values:
-3-
IntroductoryPriceElasticity.xls Point Own-Price Elasticity
Q
Pd
0 $100.00 1 $96.00 2 $92.00 3 $88.00 4 $84.00 5 $80.00 6 $76.00 7 $72.00 8 $68.00 9 $64.00 10 $60.00 11 $56.00 12 $52.00 13 $48.00 14 $44.00 15 $40.00 16 $36.00 17 $32.00 18 $28.00 19 $24.00 20 $20.00 21 $16.00 22 $12.00 23 $8.00 24 $4.00 25 $0.00 26 $0.00 27 $0.00 28 $0.00 29 $0.00 30 $0.00 31 $0.00 32 $0.00 33 $0.00 34 $0.00 35 $0.00
Ps
Arc Own-Price Elasticity
Demand
Supply
Demand
Supply
εd
εs
εd
εs
$20.00 $22.00 $24.00 $26.00 $28.00 $30.00 $32.00 $34.00 $36.00 $38.00 $40.00 $42.00 $44.00 $46.00 $48.00 $50.00 $52.00 $54.00 $56.00 $58.00 $60.00 $62.00 $64.00 $66.00 $68.00 $70.00 $72.00 $74.00 $76.00 $78.00 $80.00 $82.00 $84.00 $86.00 $88.00 $90.00
24.00 11.50 7.33 5.25 4.00 3.17 2.57 2.13 1.78 1.50 1.27 1.08 0.92 0.79 0.67 0.56 0.47 0.39 0.32 0.25 0.19 0.14 0.09 0.04 0.00 0.00 0.00 0.00 0.00 0.00 0.00 0.00 0.00 0.00 0.00
11.00 6.00 4.33 3.50 3.00 2.67 2.43 2.25 2.11 2.00 1.91 1.83 1.77 1.71 1.67 1.63 1.59 1.56 1.53 1.50 1.48 1.45 1.43 1.42 1.40 1.38 1.37 1.36 1.34 1.33 1.32 1.31 1.30 1.29 1.29
49.00 15.67 9.00 6.14 4.56 3.55 2.85 2.33 1.94 1.63 1.38 1.17 1.00 0.85 0.72 0.61 0.52 0.43 0.35 0.28 0.22 0.16 0.11 0.06 0.00 0.00 0.00 0.00 0.00 0.00 0.00 0.00 0.00 0.00 0.00
εd Ratio
21.00 7.67 5.00 3.86 3.22 2.82 2.54 2.33 2.18 2.05 1.95 1.87 1.80 1.74 1.69 1.65 1.61 1.57 1.54 1.51 1.49 1.47 1.44 1.43 1.41 1.39 1.38 1.36 1.35 1.34 1.33 1.32 1.31 1.30 1.29
The Own-Price Arc Elasticity of Supply
εs Ratio
0.4898 0.7340 0.8148 0.8547 0.8780 0.8932 0.9035 0.9107 0.9158 0.9194 0.9216 0.9228 0.9231 0.9224 0.9206 0.9178 0.9135 0.9074 0.8988 0.8864 0.8677 0.8377 0.7826 0.6528 0.0000 0.0000 0.0000 0.0000 0.0000 0.0000 0.0000 0.0000 0.0000 0.0000 0.0000
The Own-Price Arc Elasticity of Demand
$100
$120
$90 $80 $70 $60 $50 $40 $30 $20
(1.31) (1.33) (1.35) (1.38) (1.41) (1.44) (1.49) (1.54) (1.61) (1.69) (1.80) (1.95) (2.18) (2.54) (3.22) (5.00) (21.00)
$100
(49.00) (9.00)
$80
(4.56) (2.85)
$60
(1.94) (1.38) (1.00)
$40
(0.72) (0.52)
$20
$10
(0.35) (0.22) (0.11)
$0
$0 3.86 2.33 1.87 1.65 1.51 1.43 1.36 1.32
-4-
(0.00) (0.00) (0.00) (0.00) 6.14 2.33 1.17 0.61 0.28 0.06 0.00 0.00
0.5238 0.7826 0.8667 0.9074 0.9310 0.9462 0.9567 0.9643 0.9700 0.9744 0.9778 0.9806 0.9829 0.9848 0.9864 0.9877 0.9889 0.9899 0.9908 0.9915 0.9922 0.9928 0.9933 0.9938 0.9942 0.9946 0.9949 0.9952 0.9955 0.9958 0.9960 0.9962 0.9964 0.9966 0.9968
IntroductoryPriceElasticity.xls Ratio of the Point-to-Arc Own-Price Elasticity of Supply
Ratio of the Point-to-Arc Own-Price Elasticity of Demand
1.20
1.00
1.00
0.80
0.80
0.60
0.60
0.40
0.40
0.20
0.20
0.00 1
0.00
4
7
10 13 16
19 22 25 28 31 34
-0.20
1 3 5 7 9 11 13 15 17 19 21 23 25 27 29 31 33 35
Quantity
Quantity
Next derive total revenue and verify that at the mid-point the own-price point elasticity of demand is unitary: Pd = Given: +100.00 -4.00 Qd since total revenue is PxQ, then TR = (+100.00)Q from which we derive the total revenue schedule: Qd =
Pd =
2
-4.00 Qd
TR =
0 1 2 3 4 5 6 7 8 9 10
$100.00
$0.00
$96.00
$96.00
$92.00
$184.00
$88.00
$264.00
$84.00
$336.00
$80.00
$400.00
$76.00
$456.00
$72.00
$504.00
$68.00
$544.00
$64.00
$576.00
$60.00
Mid-point of the demand curve: Pd = Qd = $600.00
11 12 13
$56.00
$616.00
$48.00
TR max = $625.00 $624.00 Mid-point own-price point elasticity: εd = $624.00 1.00
14 15 16 17 18 19 20
$44.00
$616.00
$40.00
$600.00
$36.00
$576.00
$32.00
$544.00
$28.00
$504.00
$24.00
$456.00
$20.00
There is a second way that we can verify that total revenue is maximized at the point of unitary elasticity of the demand curve. To do so we first derive the $400.00 marginal revenue function from the total revenue function:
21 22 23 24 25 26 27 28
$16.00
$336.00
$12.00
$264.00
$8.00
$184.00
$4.00
$96.00
$0.00
$0.00
$0.00
$0.00
$0.00
$0.00
$0.00
$0.00
29 30
$0.00
$0.00
$0.00
$0.00
$52.00
Total revenue is at a maximum at the mid-point of the market demand curve. At this point, the own-price elasticity of demand (point or arc estimate) has an absolute value of unity. To show this is true, first we derive the mid-point of the demand curve (take one-half of the price intercept and solve for Q) from which we then calculate the own-price point elasticity of demand and verify that it is unitary: Total Revenue $700
$50.00 12.50
$600 $500 $400 $300 $200 $100
(shown as the absolute value)
$ -$100
1
5
9
13 17 21 25 29 33
2
TR = (+100.00)Q -4.00 Qd Marginal revenue is the rate of change in the total revenue function. It corresponds to the slope of the total revenue function. The marginal revenue function (which can be derived as the first derivative of the total revenue function) is defined as: MR = +100.00 -8.00 Q Since total revenue is at a maximum where the slope of its function is zero, we can set the marginal revenue function at zero and solve for the value of Q that corresponds to maximum total revenue: Qopt = 12.5 and which can then be inserted into the original inverse demand function to -5-
IntroductoryPriceElasticity.xls 31 32 33 34 35
$0.00
$0.00
$0.00
$0.00
$0.00
$0.00
$0.00
$0.00
solve for the corresponding price:
Popt =
$50.00
Thus, we have the same solution as we obtained through the derivation of the mid-point of the demand curve approach. Total revenue also is thus: $0.00 TR = $625.00
$0.00
Even though we can calculate the point of maximum total revenue, the market equilibrium will be determined by the equilibrium of demand and supply. To determine this equilibrium, we set the demand and supply functions equal to each other: +100.00 -4.00 Qd = +20.00 +2.00 Qs Collecting terms, we solve for the equilibrium quantity as: Qe = 13.33 which we then insert into the inverse demand equation Pe = (or supply equation) to solve for the equilibrium price: $46.67 for which the level of total revenue is: TR = $622.22 and for which the own-price elasticity of demand is: εd = 0.8750 . In this case since the equilibrium own-price elasticity of demand is: less than unitary, the resulting market equilibrium is going to be set at greater than the value that will maximize total revenue. Nothing in market dynamics will guarantee that any market equilibrium will correspond to the maximum level of total revenue. What market equilibrium does show is whether one can increase total revenue by adopting a price increasing or a price decreasing strategy. This is the basis of the total revenue test, which links the own-price elasticity of demand to the level of total revenue corresponding to any given change in price. We can summarize the total revenue test in terms of the following matrix that links the own-price elasticity of demand to the effect of a change in price on total revenue The Own-Price Elasticity of Demand and The Total Revenue Test +ΔP Absolute Value -ΔTR εd = >1.00
εd = εd =
-ΔP +ΔTR
=1.00
0 ΔTR
0 ΔTR