Induced Travel: Definition, Forecasting Process, and A Case Study in the Metropolitan Washington Region
A Briefing Paper for the National Capital Region Transportation Planning Board Metropolitan Washington Council of Governments September 19, 2001
Induced Travel: Page 1
Induced Travel: Definition, Forecasting Process, and A Case Study in the Metropolitan Washington Region
I.
Induced Travel: What is it, and How is it Addressed in the COG/TPB Travel Forecasting Process? II. Induced Travel: What Happened in the I-270 Corridor? III. Comparison of the 1984 Study Forecasts with Most Recent Data: I-270 Corridor IV. Response to Comments Received on Induced Travel Briefing Paper
Induced Travel: Page 2
Page 3 Page 13 Page 18 Page 33
I. Induced Travel: What is It, and How is It Addressed in the COG/TPB Travel Forecasting Process?
National Capital Region Transportation Planning Board Metropolitan Washington Council of Governments September 19, 2001
Induced Travel: Page 3
Overview w w w w w
What is generally considered to be induced travel? What is not generally considered to be induced travel? Why examine induced travel? How was induced travel examined? What types of transportation system improvements can result in induced travel?
w How does the COG/TPB travel forecasting process deal with induced travel?
w How does the COG/TPB travel forecasting process deal with other (“non-induced”) changes in travel patterns?
w Conclusions
Induced Travel: Page 4
September 19, 2001
What is generally* considered to be Induced Travel? w
w
Any increase in total daily travel over an entire transportation system that results from a change in transportation system capacity. ú
Induced travel refers to entirely new travel—new or longer trips
ú
Some induced travel may result from short-term responses to transportation system capacity changes
ú
Other induced travel may result from longer-term location decisions by households, employers and other facilities
* Definitions in the literature vary: some focus just on highway travel and the
highway system,
for example, while others focus on particular corridors, geographic areas, or times of day, rather than daily travel on an entire transportation system
Induced Travel: Page 5
September 19, 2001
What is not generally considered to be Induced Travel? w
w
Changes in travel patterns that do not result in an increase in total daily travel over the entire transportation system: ú
Diverted trips -- people using a new or improved facility in place of other routes
ú
Mode shift -- people changing from one mode to another
ú
Trip timing changes -- people shifting trips to different times of the day
Changes in travel patterns that are due to factors other than a change in transportation system capacity: ú
Changes due to demographic factors – e.g. underlying population and employment growth over time
ú
Changes due to underlying socio-economic factors – e.g. increases in workers per household, growth in organized sporting activities for young people
Induced Travel: Page 6
September 19, 2001
Why Examine Induced Travel? w Any transportation improvement potentially “induces” more travel which must be addressed in the MPO planning process
w Induced travel has become part of the public debate on transportation: “Widened highways generate their own traffic. This phenomenon, called induced travel, raises urgent questions for the Washington region.” (Widen the Roads, Drivers Will Come - MD’s I-270 Offers a Lesson. Wash. Post, 1/4/99)
w The TPB requested that staff examine the topic of induced travel and how it is addressed in the COG/TPB travel forecasting process
Induced Travel: Page 7
September 19, 2001
How Was Induced Travel Examined? w COG/TPB contracted with consultant to conduct an objective review of studies on the topic of “induced travel”
w Consultant report was presented to Travel Forecasting Subcommittee and TPB Technical Committee for review and comments
w At request of the TPB Technical Committee, a multijurisdictional working group was formed to review the consultant report and to assess the implications of the report for the COG/TPB travel forecasting process
w TPB staff attended national forums and Transportation Research Board sessions on the topic of induced travel
Induced Travel: Page 8
September 19, 2001
What Types of Transportation System Improvements Can Result in Induced Travel? 1. Major Highway Improvement: New lanes on a stretch of multi-lane access-controlled divided highway.
.
2. Incremental Arterial Improvement: Expanded capacity along an existing arterial that serves low-density residential areas - - added left turn lanes, realtime traffic signal synchronization, pull-out loading areas at bus stops. 3. Extended Metrorail line: New system-miles in a suburban corridor with congested conditions on parallel highway facilities.
4. Bike Path: New bike path linking activities in an urban mixed use corridor.
Induced Travel: Page 9
September 19, 2001
How does the COG/TPB Travel Forecasting Process Deal with Induced Travel? w
w
Short-term responses to transportation system changes ú
New Trips – Person trip rates used in travel forecasting models have not been found to change measurably as a result of changes in transportation system capacity
ú
Longer Trips – Forecasting Process accounts for increases in transportation system capacity by sending some trips to more distant destinations or on longer (but faster) routes
Longer-term responses to transportation system changes ú
Trips associated with changes in development patterns – COG/TPB’s cooperative forecasting process addresses changes in development patterns predicted to occur as a result of major changes in transportation system capacity, and these updated development patterns are provided as inputs to the travel forecasting process
Induced Travel: Page 10
September 19, 2001
How How does does the the COG/TPB COG/TPB Travel Travel Forecasting Forecasting Process Process Deal Deal with -Induced”) Changes with Other Other (“Non (“Non-Induced”) Changes in in Travel Travel Patterns? Patterns?
w
w
Changes that Do Not Increase Total Daily Travel Over the Entire Transportation System ú
Diverted Trips -- Forecasting Process estimates the diversion of traffic from unimproved to improved facilities
ú
Mode Shifts – Forecasting Process estimates shifts in person trips among transit, HOVs, and low-occupancy vehicles
ú
Trip Timing Changes -- New “version 2” COG/TPB travel forecasting process includes estimates of travel by time of day for both highway and transit
Changes Due to Factors Other than Transportation System Capacity ú
Demographic Factors -- COG/TPB’s cooperative forecasting process provides the inputs for these factors in the travel forecasting process
ú
Socio-Economic Factors – changes in workers per household and household travel characteristics are explicitly addressed in the COG/TPB travel forecasting process through periodic household surveys
Induced Travel: Page 11
September 19, 2001
Conclusions w
Induced travel can result from any transportation system improvement -- highways, transit, bike/pedestrian facilities or others
w
Changes in travel patterns that do not increase travel over an entire transportation system, but are just shifts between routes, travel modes, and times of day, are not generally considered to be induced travel
w
Travel growth is influenced by many factors other than changes in the transportation system -- Induced travel is only one component of overall increases in travel. Research has found that it is difficult to separate induced travel from other increases in travel, and results of research to date are of limited applicability to the Washington region
w
COG/TPB Travel Forecasting Process currently captures induced travel, but does not separate induced travel from other increases in travel
w
COG/TPB Travel Forecasting Process is “State of the Practice”
Induced Travel: Page 12
September 19, 2001
II. Induced Travel: What Happened in the I-270 Corridor?
National Capital Region Transportation Planning Board Metropolitan Washington Council of Governments September 19, 2001
Induced Travel: Page 13
Overview w Highway Widening and Traffic Growth in the I-270 Corridor: 1984-2000
w Comparisons of I-270 Study Forecasts With 2000 Conditions as Described in Most Recent Data
w What do Preliminary Findings Suggest?
Induced Travel: Page 14
September 19, 2001
Highway Widening and Traffic Growth in the II-270 -270 Corridor: 1984 -2000 1984-2000 w MD SHA 1984 Study of the widening of I-270 from the I270 Y-Split to MD Route 121, provided traffic forecasts for the year 2010
w Widening completed in 1991 w Year 2010 traffic forecasts were exceeded by the year 2000
w To what extent should this rapid growth be attributed to “induced travel”?
w We can address this question by examining the study forecasts and comparing them with year 2000 conditions as described in our most recent data
Induced Travel: Page 15
September 19, 2001
Comparison of II-270 -270 Study Forecasts With 2000 Conditions as Described in Most Recent Data w
Population and Employment ú
w
Transportation System ú
w
Compare Current (Round 6.2) forecasts with the Round 2 forecasts for the year 2000 that were used in 1984 study
Compare the improvements that were assumed in 1984 study with those that were actually constructed by the year 2000 ›
Completion of Metrorail lines?
›
Inter County Connector?
›
Other Facilities?
Traffic Volumes ú
Compare traffic forecasts in 1984 study with most recent (1999) observed traffic volumes
Induced Travel: Page 16
September 19, 2001
What do Preliminary Findings Suggest? w
w
Population and Employment ú
Round 6.2 regional population and household totals were somewhat lower and regional employment totals somewhat higher than the Round 2 forecast.
ú
Population, household, and employment growth in the I-270 corridor was significantly higher than the Round 2 forecast while growth in several other areas was lower than the forecast
The Transportation System ú
w
The transportation system improvements included in the 1984 study were based on the adopted regional transportation plan at that time, which included some facilities that have since been delayed or dropped from regional plans.
Travel Forecasts and Actual Volumes ú
The higher observed traffic volumes relative to the 1984 forecast appear to be due in large part to shifts in population, employment, and travel to the I270 corridor from other areas in the region, rather than to “entirely new travel”
Induced Travel: Page 17
September 19, 2001
III. Comparison of 1984 Study Forecasts with Most Recent Data: I-270 Corridor
National Capital Region Transportation Planning Board Metropolitan Washington Council of Governments September 19, 2001
Induced Travel: Page 18
Ta Table ble 11 Comparison Comparison of of Round Round 6.2 6.2 and and Round Round 22 Cooperative Cooperative Forecasts* Forecasts* Year Year 2000: 2000: Population Population (In (In Thousands) Thousands)
Jurisdiction
Round 6.2 Year 2000
Round 2 Difference Percent Year 2000 Rnd 6.2-Rnd 2 Difference
District of Columbia
518
733
-215
-29%
Arlington County
192
206
-14
-7%
City of Alexandria
127
138
-11
-8%
Montgomery County
848
790
58
7%
In I-270 Corridor
294
239
55
23%
Outside I-270 Corridor
554
551
3
1%
Prince George's County
791
871
-80
-9%
Fairfax County / Cities
999
986
13
1%
Loudoun County
172
160
12
8%
Prince William County / Cities
329
318
11
4%
3977
4202
-225
-5%
Total
* Round 6.2 Forecasts adopted in 2000 and Round 2 Forecasts adopted in 1979
Induced Travel: Page 19
September 19, 2001
Ta Table ble 22 Comparison Comparison of of Round Round 6.2 6.2 and and Round Round 22 Cooperative Cooperative Forecasts* Forecasts* Year Year 2000: 2000: Households Households (In (In Thousands) Thousands)
Jurisdiction
Round 6.2 Year 2000
Round 2 Year 2000
Difference Rnd 6.2-Rnd 2
Percent Difference
222
299
-77
-26%
Arlington County
90
100
-10
-10%
City of Alexandria
62
65
-4
-5%
Montgomery County
315
289
26
9%
In I-270 Corridor
109
86
23
27%
Outside I-270 Corridor
206
203
3
1%
Prince George's County
293
311
-18
-6%
Fairfax County / Cities
366
345
21
6%
61
53
8
14%
109
94
15
16%
1517
1556
-39
-2%
District of Columbia
Loudoun County Prince William County / Cities Total
* Round 6.2 Forecasts adopted in 2000 and Round 2 Forecasts adopted in 1979
Induced Travel: Page 20
September 19, 2001
Ta Table ble 33 Comparison Comparison of of Round Round 6.2 6.2 and and Round Round 22 Cooperative Cooperative Forecasts* Forecasts* Year Year 2000: 2000: Employment Employment (In (In Thousands) Thousands)
Jurisdiction
Round 6.2 Year 2000
Round 2 Year 2000
Difference Percent Rnd 6.2-Rnd 2 Difference
District of Columbia
678
701
-23
-3%
Arlington County
201
198
3
2%
City of Alexandria
99
80
19
23%
Montgomery County
533
440
93
21%
In I-270 Corridor
282
194
88
45%
Outside I-270 Corridor
251
246
5
2%
Prince George's County
329
426
-97
-23%
Fairfax County / Cities
565
410
155
38%
85
58
27
47%
114
84
30
36%
2604
2397
207
9%
Loudoun County Prince William County / Cities Total
* Round 6.2 Forecasts adopted in 2000 and Round 2 Forecasts adopted in 1979
Induced Travel: Page 21
September 19, 2001
Ta Table ble 44 Comparison Comparison of of Round Round 6.2 6.2 Forecasts Forecasts for for 2000 2000 with with Extrapolated Extrapolated Round Round 22 Cooperative Cooperative Forecasts Forecasts for for 2010* 2010* (Region) Round 6.2 2000
Round 2 2010
Round 6.2 (2000) as a % of Round 2 (2010) Forecasts
Employment
2,604,000
2,796,000
93%
Households
1,517,000
1,781,000
85%
Population
3,977,000
4,721,000
84%
Montgomery (Montgomery County
County)
Round 6.2 2000
Round 2 2010
Round 6.2 (2000) as a % of Round 2 (2010) Forecasts
Employment
533,000
523,000
102%
Households
315,000
306,000
103%
Population
848,000
837,000
101%
* Round 6.2 Forecasts adopted in 2000 and Round 2 Forecasts adopted in 1979
Induced Travel: Page 22
September 19, 2001
Table Table 55 Comparison Comparison of of Current Current with with Previously Previously Forecast* Forecast* Daily II-270 -270 Daily Traffic Traffic Volumes Volumes on on I-
I-270 Segment I-270 Y-Split to Montrose Rd Montrose Rd to MD 189 MD 189 to MD 28 MD 28 to Shady Grove Rd Shady Grove Road to I-370 I-370 to MD 124 MD 124 to Middlebrook Rd Middlebrook Rd to MD 118 MD 118 to MD 121 MD 121 to Frederick County Line
Current 1999
Forecast Current as a % Forecast Current as a % 2000* Forecast 2000 2010* Forecast 2010
232,300 196,700 216,700 217,200 165,200 151,200 136,900 94,400 65,900
166,200 154,500 143,400 145,100 128,100 121,800 91,500 72,400 69,900
140% 127% 151% 150% 129% 124% 150% 130% 94%
187,900 182,200 165,500 170,100 153,800 144,300 113,700 85,100 87,400
124% 108% 131% 128% 107% 105% 120% 111% 75%
63,900
63,700
100%
78,700
81%
* In 1984 the Maryland State Highway Administration prepared 2010 traffic projections for I-270 using traffic forecasts developed by the MetropolitanWashington Council of Governments reflecting Round 2 of the Cooperative Forecasts for the Year 2000. Daily traffic volume forecasts for 2000 in this table were estimated by interpolating between the 1980 base year Average Daily Traffic (ADT) volumes and the 2010 design year projections.
Induced Travel: Page 23
September 19, 2001
Table Table 66 Change II-270 -270 and Change in in Daily Daily Traffic Traffic Volumes Volumes on on Parallel Parallel Iand MD MD 355 355 Highway Highway Segments Segments
I-270 Segment 1992
1999
Change
Parallel MD 355 Segment (Rockville Pike) 1992 1999 Change
I-270 Segment I-270 Y-Split to Montrose Rd
175,900
232,300
56,400
55,700 63,700
8,000
MD 189 to MD 28 MD 28 to Shady Grove Rd
145,700 111,600
216,700 71,000 217,200 105,600
76,400 59,800 46,900 45,200
-16,600 -1,700
I-370 to MD 124 MD 124 to Middlebrook Rd Middlebrook Rd to MD 118 MD 118 to MD 121
92,400 71,700 72,300 64,300
151,200 136,900 94,400 65,900
58,800 65,200 22,100 1,600
35,200 34,700 21,200 28,100
35,600 24,200 23,000 19,700
400 -10,500 1,800 -8,400
MD 121 to Frederick County
67,800
63,900
-3,900
8,600
8,700
100
Induced Travel: Page 24
September 19, 2001
1976 Highway Elements of the Long Range Transportation Plan
Induced Travel: Page 25
September 19, 2001
1976 Transit Elements of the Long Range Transportation Plan
Induced Travel: Page 26
September 19, 2001
1980 Highway Elements of the Long Range Transportation Plan
Induced Travel: Page 27
September 19, 2001
1980 Transit Elements of the Long Range Transportation Plan
Induced Travel: Page 28
September 19, 2001
1983 Highway Elements of the Long Range Transportation Plan
Induced Travel: Page 29
September 19, 2001
1983 Transit Elements of the Long Range Transportation Plan
Induced Travel: Page 30
September 19, 2001
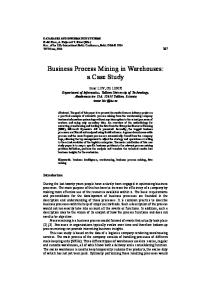
Figure Figure 11 Comparison Comparison of of Round Round 6.2 6.2 and and Round Round 22 Cooperative Cooperative Forecasts* Forecasts* Year Year 2000: 2000: Households Households
Induced Travel: Page 31
September 19, 2001
Figure Figure 22 Comparison Comparison of of Round Round 6.2 6.2 and and Round Round 22 Cooperative Cooperative Forecasts* Forecasts* Year Year 2000: 2000: Employment Employment
Induced Travel: Page 32
September 19, 2001
IV. Response to Comments Received on Induced Travel Briefing Paper
National Capital Region Transportation Planning Board Metropolitan Washington Council of Governments TPB Work Session September 19, 2001
Induced Travel: Page 33
Response to Comments Received on Induced Travel Briefing Paper (1 of 3)
w Comment 1: The definition of induced travel used in the paper does not capture some of the important travel impacts of policy interest.
w Response 1: The definition used is the consensus definition from the professional literature, as recommended in a report by the TPB’s consultant, Hagler Bailly. (Copies of the consultant report are available for those who are interested). It is true that some important travel impacts like diverted trips and mode shifts are not captured in this definition of induced travel, which refers only to new or longer trips.
Induced Travel: Page 34
September 19, 2001
Response to Comments Received on Induced Travel Briefing Paper (2 of 3) w
Comment 2: It is unclear how the TPB process captures changes in trip generation rates over time.
w
Response 2: These changes are captured in periodic surveys of household travel behavior. Such surveys would capture over time the growth in “soccer moms” for example, along with other socio-economic factors such as the growth in labor force participation by women. While the level of mobility on the transportation system has not been found to be a significant variable in trip generation models, this factor is inherent in the travel survey information. In fact to the extent that the most recent survey (currently 1994) was taken when congestion was lower and mobility levels were higher, the trip generation models may actually overstate the number of trips currently being made.
Induced Travel: Page 35
September 19, 2001
Response to Comments Received on Induced Travel Briefing Paper (3 of 3)
w Comment 3: The I-270 data suggest that transportation system changes can have significant impacts on the location of future households and employment. It is unclear to what extent these changes result in “induced travel”.
w Response 3: If the land use changes result in a significant number of new or longer trips, as in the case, for example, of shifting development to more remote locations in the region, then an induced travel effect may very well occur. However, if the land use changes result in similar or reduced travel relative to the baseline, there may not be any induced travel effects. To the contrary, such land use changes may result in reduced travel relative to the baseline.
Induced Travel: Page 36
September 19, 2001