CANCER GENOMICS & PROTEOMICS 13: 63-68 (2016)
Identification of Endogenous Controls for Use in miRNA Quantification in Human Cancer Cell Lines 1Faculty
MRINAL K. DAS1, RUNE ANDREASSEN1, TRINE B. HAUGEN1 and KARI FURU1,2
of Health Sciences, Oslo and Akershus University College of Applied Sciences, Oslo, Norway; 2Department of Research, Cancer Registry of Norway, Oslo, Norway
Abstract. Background: miRNAs play important roles in multiple biological processes, and deregulation has been linked to several human diseases, including cancer. Studying changes in miRNA expression in cancer development is commonly performed in vitro in human cancer cell lines using quantitative polymerase chain reaction (qPCR), a method requiring the use of a robust reference gene that displays stable expression across all samples. Materials and Methods: Using the NormFinder software, a selection of commonly used endogeneous controls and miRNAs were tested in six human cancer cell lines to identify for the most suitable gene for use as a reference. Results: The frequently used endogenous control U6B small nuclear RNA (RNU6B) was found to be an unsuitable reference for normalization. The most suitable single endogeneous control identified was miR-25-3p, whereas the best combination of two endogeneous controls was miR-25-3p and miR-93-5p. Conclusion: We identified a single and a pair of miRNAs suitable for use as endogenous controls when performing qPCR-based miRNA expression analyses in human cancer cell lines.
MicroRNAs (miRNAs) are single-stranded RNAs which have roles in a wide range of fundamental cellular processes, including embryonal development, proliferation, apoptosis, and stress response (1, 2). These RNA molecules are produced from larger transcripts that are processed to form hairpin precursors that serve as substrates for Drosha and Dicer, members of the RNase III enzyme family, to generate mature 20-22 nucleotide miRNAs (3). These small noncoding RNA molecules lead to down-regulation of gene expression through translational inhibition or mRNA Correspondence to: Kari Furu, Faculty of Health Sciences, Oslo and Akershus University College of Applied Sciences, Pilestredet 50, 0167 Oslo, Norway. Tel: +47 67236637, e-mail:
[email protected]
Key Words: miRNA, endogenous control, qPCR, human cancer cell lines, quantification of gene expression.
1109-6535/2016
cleavage by binding to complementary sites in target transcripts (4). Precise control of miRNA expression is crucial for keeping cells in normal physiological states, and dysregulation of miRNAs may lead to disease, including cancer (5, 6). It has been shown that over 60% of human protein-coding genes are conserved targets of miRNAs (7) and most miRNAs are highly conserved across vertebrates (1, 8). miRBase, an online database of miRNA sequences, currently contains, precursors and, mature miRNAs of the human genome (9). In recent years, several studies have shown that altered expression of specific miRNA genes contributes to the initiation and progression of cancer (10-13). The mechanism through which miRNAs contribute to cancer development and progression is often unknown but specific miRNAs have been shown to target genes that are critical regulators for the development of cancer, such as the E2 family (E2F) and RAS (14, 15). There is therefore an impetus for studying the expression patterns of individual miRNAs in cancer tissues, both to elucidate the molecular mechanisms involved in cancer development and progression, and to identify diagnostic and prognostic biomarkers. Due to their high availability, cancer cell lines are often used as experimental models of neoplastic disease in these studies. miRNA gene-expression analyses using cell lines can thus provide candidate molecular signatures characteristic of the tumor from which the cell line is derived. One of the most commonly used techniques to study miRNA expression is quantitative polymerase chain reaction (qPCR). Due to the small size of miRNAs, the method is usually based on the addition of a universal tag sequence on the 5' end during reverse transcription. This allows amplification of target miRNAs using a specific forward primer and a universal reverse primer. To correct for systematic variables, such as differences in quantity of starting template, RNA quality and enzymatic efficiency, qPCR data are normalized against those of an endogenous control gene. It has been reported that it is preferable to normalize target RNA levels with control genes belonging to 63
CANCER GENOMICS & PROTEOMICS 13: 63-68 (2016) Table I. Cell line overview. Cell line
HeLa Reh MCF-7 HCT116 NT2-D1 833K
miR-16-5p miR-17-5p miR-25-3p miR-93-5p miR-103a-3p miR-130b-3p miR-140-3p miR-345-5p miR-455-5p SNORD42B SNORD68 RNU6B
miScript assay MS00031493 MS00029274 MS00003227 MS00003346 MS00031241 MS00003451 MS00008673 MS00031766 MS00031878 MS00055090 MS00033712 MS00033740
Negative control OK OK OK OK OK OK OK OK OK OK OK OK
Cervix Blood Breast Colon Lung (metastasis) Abdomen (metastasis)
Dissociation curve OK OK OK OK OK OK OK OK OK OK OK OK
the same RNA class (16), rendering the commonly used qPCR endogenous controls beta-actin (ACTB), glyceraldehyde-3-phosphate dehydrogenase (GAPDH) and 18s unsuitable in quantitative miRNA assays. Rather, for normalization of miRNA levels, the endogenous control genes should belong to the small non-coding RNA family (ncRNA) of RNAs, such as small nuclear RNAs (snRNA). Ideally, the endogenous control should show invariable expression across the test sample set and exhibit storage stability, extraction efficiency and quantification efficiency equivalent to that of the target nucleic acids. Additionally, miRNAs represent as little as 0.01% of the total mass of RNA, but with concentrations greatly dependent on sample type (17). Thus, the endogenous control used should mirror this quantitative change in the target miRNA. There is no universal endogenous control suitable for every tissue type, as the expression of most RNAs varies with cell type and condition. A suitable endogenous control should, therefore, be validated for each sample set. The most commonly used endogenous control for miRNA expression studies is U6B small nuclear RNA (RNU6B), a snRNA molecule. A number of reports indicate that snRNAs are expressed both abundantly and stably, making RNU6B a good candidate as a miRNA endogenous control (17, 18). It 64
Source tissue
Human cervical cancer Human acute lymphocytic leukemia Human breast cancer Human colorectal carcinoma Human testicular embryonal carcinoma Human testicular embryonal carcinoma
Table II. Primer overview. Gene
Disease
Slope 3.407 3.442 3.188 3.280 3.349 3.169 2.934 3.565 3.302 3.344 3.555 3.715
Amplification efficiency 96.6 95.2 105.9 101.8 98.9 106.8 116.6 90.8 100.8 99.1 91.1 85.9
Source/ref (26) (27) (28) (29) (30) (30)
Included in further analyses? Yes Yes Yes Yes Yes Yes No Yes Yes Yes Yes No
has, however, been shown to be unsuitable for this purpose for many sample sets due to its low stability across tissues (19, 20). Instead, stably expressed miRNAs have been suggested as endogenous controls (21, 22). In order to select suitable reference genes for normalization, many analysis tools, such as Normfinder, geNorm and Bestkeeper can be used (23-25). In the present study, we used Normfinder, as well as evaluation of the raw Ct values to assess 12 candidate reference genes in six human cancer cell lines. Small RNA extraction was used to efficiently recover all classes of small RNA populations. Our aim was to identify suitable endogenous controls for qPCR analysis of miRNA gene expression in selected human cancer cell lines.
Materials and Methods
Cell lines and RNA extraction. Six human cancer cell lines were used in this study (Table I). The cells were cultured under normal conditions, trypsinized and harvested for RNA isolation. Small RNA was isolated using the mirVana miRNA isolation kit (Life Technologies, Carlsbad, CA, USA) from all cell lines according to the manufacturer’s protocol. RNA concentrations were determined by measuring the A260/280 absorbance on a Nanodrop 1000 (Thermo Fisher Scientific, Wilmington, DE, USA).
Das et al: Endogenous Controls for miRNA Quantification in Cancer Cell Lines
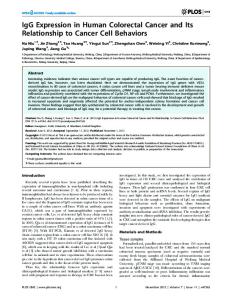
Figure 1. Raw Ct values for 12 candidate endogenous controls tested in six human cancer cell lines. The error bars represent the standard deviation (SD) of the eight replicates used for each sample.
Quantitative PCR. cDNA synthesis was performed on 6 ng small RNA using the miScript II RT kit (Qiagen, Valencia, CA, USA). The cDNA samples were amplified using the miScript SYBR® Green PCR kit (Qiagen), the provided miScript Universal Primer (reverse primer) and a small RNA specific primer (forward primer). Primers targeting candidate control genes were ordered from the miScript Primer Assay catalogue (Qiagen). Candidate endogenous controls were selected from the literature (21, 31, 32) and from suggested miRNA endogenous controls in the miScript Primer Assay catalogue (Qiagen). An overview of the primers used is given in Table II. The PCR reactions were performed in a final volume of 20 μl, and a total of 0.1 ng cDNA was used per reaction. The reactions were performed on a Stratagene Mx3000p instrument using the PCR program recommended in the miScript SYBR® Green PCR kit protocol. All reactions were carried-out using eight replicates. Ct values >35 were regarded as negative and the melting point curves were manually inspected for all assays to verify primer specificity (data not shown).
Data analysis. To obtain a crude measure of the stability for the candidate reference genes, the raw Ct values for each gene were evaluated across all cell lines. The standard deviation between the eight replicates and the PCR amplification efficiencies were calculated for all assays. PCR amplification efficiencies were calculated for each assay using the formula, E=(10–1/slope−1)×100. Assays with efficiency >90% or 3 cycles, whereas only miR-25 had a mean Ct value range