UNITED STATES DEPARTMENT OF LABOR Frances Perkins, Secretary B U R E A U OF L A B O R STATISTICS Isador Lubin, Commissioner (on leave) A . F. Hinrichs, Acting Commissioner •
Hours and Earnings in the United States, 1932-40 With Supplement for 1941, Page 135
By ALICE OLENIN and T H O M A S F. CORCORAN of the
DIVISION OF EMPLOYMENT STATISTICS Lewis E. Talbert, Chief
Bulletin 7S[o. 697
NOTE To economize in the use of paper and printing during the war, the Bureau of Labor Statistics will discontinue the practice of placing heavy paper covers on its bulletins, except where con^ ditions require them.
UNITED STATES G O V E R N M E N T PRINTING WASHINGTON
OFFICE
: 1942
For sale by the Superintendent of Documents, Washington, D . C.
Digitized for FRASER http://fraser.stlouisfed.org/ Federal Reserve Bank of St. Louis
Price 25 cents
UNITED
STATES
D E P A R T M E N T
FRANCES PERKINS, B U R E A U
OF
ISADOR L U B I N , A.
L A B O R
OF
LABOR
Secretary STATISTICS
Commissioner (on leave)
F . HINRICHS,
Donald Davenport, Chief, Employment and Occupational Outlook Branch Henry J. Fitzgerald, Chief, Business Management Branch Hugh S. Hanna, Chief, Editorial and Research
Acting Commissioner
Aryness Joy, Chief, Prices and Cost of Living Branch N.
Arnold Tolles, Chief, , Working Conditions and Industrial Relations Branch
Sidney W. Wilcox, Chief Statistician
C H I E F S OF D I V I S I O N S
Herman B. Byer, Construction and Public Employment
Charles F. Sharkey, Labor Law Information
J. M. Cutts, Wholesale Prices
Boris Sterni L a b o r I n f o r m a t i o n
W. Duane Evans, Productivity and Technological Developments Swen Kjaer, Industrial Accidents John J. Mahaney, Machine Tabulation Robert J.
Myers, Wage and Hour
Statistics Florence Peterson, Industrial Relations i i
Digitized for FRASER http://fraser.stlouisfed.org/ Federal Reserve Bank of St. Louis
Stella
Service
Stewart, Retail Prices
Lewis E. Talbert, Employment Statistics Emmett H. Welch, Occupational Outlook
Faith M. Williams, Cost of Living
CONTENTS Page CHAPTER
CHAPTER
CHAPTER
I.—Movements of hours and earnings, 1932-40 Comparison of 1932 and 1940 General movements of hours and earnings, 1932-40 Changes in selected industries and industry groups Durable and nondurable goods Blast furnaces, steel works, and rolling mills; automobiles Foundries and machine shops; machine tools Aircraft and shipbuilding Lumber; paper and pulp Cottonseed—oil, cake, and meal; fertilizers Cotton goods; woolen and worsted goods Slaughtering and meat packing; bread and bakery products Private building construction Anthracite and bituminous-coal mining Crude-petroleum production; metalliferous mining Laundries; dyeing and cleaning Range of hours and earnings in 1940 II.—Scope and method Manufacturing industries Nonmanufacturing industries Average hourly earnings and average hours per week__ Average weekly earnings III.—General tables
1 2 4 4 6 9 11 13 15 15 17 19 19 23 23 26 26 34
39 41 42 45 47
SUPPLEMENT.—Hours and earnings in 1941
135
Appendixes: A.—Hours and earnings, 1932-34, by months, manufacturing and nonmanufacturing industries B.—Hours and earnings, 1932-41, class I steam railroads C.—Farm wage rates, January 1932 to October 1941 General index of industries in tables 5-10
155 199 203 206
Tables TABLE
1.—Average hours worked per week in 1 9 4 0 in the individual manufacturing and nonmanufacturing industries arranged in descending order and grouped by class intervals 2.—Average hourly earnings in 1940 in individual manufacturing and nonmanufacturing industries arranged in descending order and grouped by class intervals 3.—Average weekly earnings in 1940 in individual manufacturing and nonmanufacturing industries arranged in descending order and grouped by class intervals 4.—Estimated total employment in manufacturing and nonmanufacturing industries in 1940, the percentage of wage earners in the total reporting sample in 1932, 1934, and 1940, and the percentage of wage earners in the man-hour sample in 1932, 1934, and 1940
Digitized for FRASER http://fraser.stlouisfed.org/ Federal Reserve Bank of St. Louis
TTI
29
31
32
35
IV TABLE
CONTENTS
5.—Average hours worked per week, average hourly earnings, and average weekly earnings in manufacturing industries, by years, 1932-40, and by months, January 1935 to December 1940 5-a.—Average hours worked per week, average hourly earnings, and average weekly earnings in manufacturing industries, by months, 1941 6.—Average hours worked per week, average hourly earnings, and average weekly earnings in nonmanufacturing industries, by years, 1932-40, and by months, January 1935 to December 1940 6-a.—Average hours worked per week, average hourly earnings, and average weekly earnings in nonmanufacturing industries, by months, 1941
Page
48 137
122 150
Appendix Tables 7.—Average hours worked per week, average hourly earnings, and average weekly earnings in manufacturing industries, by months, January 1932 to December 1934 8.—Average hours worked per week, average hourly earnings, and average weekly earnings in nonmanufacturing industries, by months, January 1932 to December 1934 9.—Average hours worked per week, average hourly earnings, and average weekly earnings, class I steam railroads, by years and months, 1932-41 10.—Farm wage rates, by years and by quarters, 1932-41
156 193 201 205
Charts CHART
1.—Hours and earnings in manufacturing industries, 1 9 3 2 - 4 0 — a l l
industries combined 2.—Hours and earnings in manufacturing industries—durable and nondurable goods, 1932-40 3.—Hours and earnings in blast furnaces, steel works, and rolling mills, and automobiles, 1932-40, where available 4.—Hours and earnings in foundries and machine shops, and machine tools, 1932-40 5.—Hours and earnings in aircraft and shipbuilding, 1932-40, where available 6.—Hours and earnings in sawmills and paper and pulp, 1932-40-_ 7.—Hours and earnings in cottonseed oil, cake, and meal, and fertilizers, 1932-40, where available 8.—Hours and earnings in cotton goods and woolen and worsted goods, 1932-40 9.—Hours and earnings in bread and bakery products, and slaughtering and meat packing, 1932-40, where available 10.—Hours and earnings in private building construction, 1934-40 where available 11.—Hours and earnings in anthracite and bituminous-coal mining, 1932-40, where available 12.—Hours and earnings in crude-petroleum production and metalliferous mining, 1932-40, where available 13.—Hours and earnings in laundries and dyeing and cleaning establishments, 1932-40, where available 14.—Hours and earnings in class I steam railroads and all manufacturing industries, 1932-40
Digitized for FRASER http://fraser.stlouisfed.org/ Federal Reserve Bank of St. Louis
5 7 10 12 14 16 18 20 21 22 24 25 27 200
Letter of Transmittal
U N I T E D STATES D E P A R T M E N T BUREAU
OF L A B O R ,
OF L A B O R
STATISTICS,
Washington, D. C., June 21, 1941. T h e SECRETARY
OF L A B O R :
I have the honor to transmit herewith a report on hours and earnings in the United States, 1932-40. This work was directed and the report prepared by Alice Olenin and Thomas F. Corcoran, under the general direction of Lewis E. Talbert, Chief of the Bureau's Division of Employment Statistics. The compilation of this material and much of the research work was accomplished by Irvin W. Schmidt, assisted by Ruth Newman, Margaret V. V. Buffum, and Joseph A. Vigness, while Theodore Westerman and Thomas F. Mosimann rendered valuable assistance in connection with manufacturing industries and Susan T. Waite and Joseph F. Bober in nonmanufacturing industries. Harrison F. Houghton assisted with the preparation of the text. The Bureau's regular staff was augmented by additional clerical assistance made available through the District of Columbia W. P. A., which aided in compiling and assembling the data contained in this publication. Respectfully submitted. A . F . H I N R I C H S , Acting Commissioner. H o n . FRANCES PERKINS,
Digitized for FRASER http://fraser.stlouisfed.org/ Federal Reserve Bank of St. Louis
Secretary of Labor. v
Digitized for FRASER http://fraser.stlouisfed.org/ Federal Reserve Bank of St. Louis
Bulletin 1S[o. 697 of the United States Bureau of Labor Statistics
Hours and Earnings in the United States, 1932-40 Chapter I Movements of Hours and Earnings, 1932-40 The monthly compilations of data on average weekly and hourly earnings and average weekly hours of work in 90 individual manufacturing and 16 nonmanufacturing industries were begun by the Bureau of Labor Statistics in 1932, almost at the low point of the depression in both employment and earnings. Since that time hoursand-earnings averages have been published each month in the Monthly Labor Review and the Employment and Pay Rolls pamphlet. They are assembled for the first time in this publication in convenient form for analysis and comparison, by months and by years, from 1932 to 1940, inclusive.1 This comprehensive presentation of the information also permits the inclusion of revisions as well as corrections in the figures previously published. Averages for combined groups of industries fail to reveal many highly important variations between individual industries, just as averages for individual industries do not indicate equally important differences between individual establishments and between individual employees of the same establishment. It should be pointed out, also, that although industry averages of hourly and weekly earnings and hours worked are considered adequate for measuring levels and trends, they may vary somewhat from averages computed from special industry surveys. In these surveys it is possible to give more adequate consideration to such factors as size and type of plant, 1 Recent publications of the Bureau of Labor Statistics relative to the hours and earnings of industrial workers include: Hours and Earnings Before and After the N. R. A., Monthly Labor Review, January 1937 (reprinted as Serial No. R. 496); Average Hourly Earnings in Manufacturing, 1933 to 1936, Monthly Labor Review, April 1937 (reprinted as Serial No. R. 542); Work and Wages in 1939, Monthly Labor Review, March 1940 (reprinted as Serial No. R. 1088); Wages, Hours, and Productivity of Industrial Labor, 1909 to 1939, Monthly Labor Review, September 1940 (reprinted as Serial No. R. 1150); Employment and Earnings in 1940, Monthly Labor Review, March 1641 (reprinted as Serial No. R. 1269); and Average Weekly Hours in Manufacturing, October-November 1940, Monthly Labor Review, April 1941. Two important monographs concerning hours and earnings were published in 1940 by the Temporary National Economic Committee in cooperation with the Bureau of Labor Statistics: Monograph No. 5, Industrial Wage Rates, Labor Costs, and Price Policies, and Monograph No. 14, Hourly Earnings of Employees in Large and Small Enterprises.
Digitized for FRASER http://fraser.stlouisfed.org/ Federal Reserve Bank of St. Louis
1
2
HOURS AND EARNINGS IN THE UNITED
STATES
unionization, corporate affiliation, size of community, regional location, and occupational coverage. Therefore, an industry average shown in this report may differ from the average for the same industry obtained in a special wage survey by the Bureau of Labor Statistics because of such circumstances as differences in the period covered or the avoidance in the special survey of abnormal or exceptional pay-roll periods. Before the inauguration of the regular monthly series of reports herein summarized, the Bureau of Labor Statistics had secured wageand-hour data periodically through field representatives for a number of industries of major importance. These special field surveys were continued after 1932 at less regular intervals with a broader range of industries and for somewhat different purposes. The great amount of work required for these intensive industry surveys has so far prevented the Bureau from compiling such detailed data for all industries or for any one industry at short intervals. The methods used in the compilation of the hours-and-earnings data contained in this bulletin, the scope of the Bureau's monthly employment and pay-roll surveys, sample adequacy, and the limitations of the figures presented, are discussed in chapter II. Comparison of 1932 and 1940 In 1940 wage earners in manufacturing industries in the United States as a whole earned an average of 67.0 cents per hour, according to data compiled by the Bureau of Labor Statistics. Measured from 1932, the first year for which data were compiled on a monthly basis, this represented an increase of 46 percent over the average hourly earnings of 45.8 cents shown for that year. The average number of hours worked per week by factory employees in 1940 was 38.1, a negligible decrease from the 1932 average of 38.2 hours. These hours and hourly earnings, as explained under "Scope and methods," page 34, are weighted averages based on the relative importance of the various industries included in the survey. The unweighted weekly earnings of these workers in 1940 averaged $26.11 as compared with an average of $17.86 in 1932. Thus, the many forces at work in the industrial economy between 1932 and 1940, including more full-time employment in the higher-paid industries, higher wage rates resulting from collective agreements, and minimum hourly rates of pay and overtime premiums established by legislation, resulted in substantially larger weekly earnings to the average factory wage earner. Among the nonmanufacturing industries which report to the Bureau of Labor Statistics, the increase in the average hourly earnings of bituminous-coal miners was the most outstanding, the 1940 average of 88,3 cents representing a rise of 70 percent over the 1932 average
Digitized for FRASER http://fraser.stlouisfed.org/ Federal Reserve Bank of St. Louis
MOVEMENTS OF HOURS AND EARNINGS,
19 3 2 - 4 0
3
of 52.0 cents. The average hours worked per week in this industry showed a small increase over this period—27.2 hours in 1932 as compared to 28.1 hours in 1940. Average weekly earnings of bituminous-coal miners in 1940 amounted to $24.71, whereas in 1932 they were $13.91, an increase of 78 percent. Average hourly earnings in 1940 in other mining industries surveyed were w^ell above the averages shown for 1932. Employees in anthracite mines averaged 92.4 cents per hour in 1940, an increase of 12 percent over the 1932 figures; in metal mining they averaged 73.3 cents per hour in 1940, an increase of about 48 percent over 1932; and in the quarrying and nonmetallic mining industry workers earned 56.8 cents per hour in 1940, an increase of 28 percent over the 1932 average. The average weekly hours (27.2) in anthracite mining in 1940 fell below the 1932 level of 30.3 hours. On the other hand, average hours in 1940 for both the metalliferous and the quarrying and nonmetallic mining industries were over 6 percent above those in 1932, the 1940 figures indicating 40.9 and 39.3 hours, respectively. Adequate data for the crude-petroleum-production industry are not available prior to 1935. Average hourly earnings and average hours in this industry in 1940, however, showed increases over the averages for 1935. Average weekly earnings in 1940 in all of the mining industries except anthracite were well above those for 1932. In anthracite there was a slight decrease of 0.2 percent over the interval, the decrease in hours worked offsetting the gain in hourly earnings. Employees in the electric light and power and street railway and motorbus industries of the public-utilities group surveyed also received higher average hourly pay in 1940 than in 1932. While averages for these industries prior to 1938 are not strictly comparable with later data, since the figures for 1938 and subsequent years exclude corporation officers, executives, and other employees whose duties are mainly supervisory, a substantial increase is indicated when the figures are adjusted for the change in employee classification. Average hours in these industries in 1940 were lower than in 1932 while average weekly earnings were higher. Data relating to average hours of work per week and average hourly earrings for telephone and telegraph are not available prior to 1938, those for wholesale trade are not available prior to 1935, and for retail trade, hotels, laundries, dyeing and cleaning establishments, and private building construction, they are not available prior to 1934. For the most part, the levels of average hourly and weekly earnings in 1940 in these industries were above those for the earliest year shown. The average weekly earnings of employees in insurance and brokerage companies in 1940 showed slight changes from those for 1932, according to the Bureau's records. Here again, however, direct comparison cannot be made because of the inclusion of corporation officers, executives, and other supervisory
Digitized for FRASER http://fraser.stlouisfed.org/ Federal Reserve Bank of St. Louis
4
HOURS AND EARNINGS IN THE UNITED
STATES
employees in the figures prior to 1938. Average hours and average hourly earnings data are not available for either brokerage or insurance employees. General Movements of Hours and Earnings, 1932-40 In industry at large, two major upward movements in average hourly earnings occurred during the period covered by this report, one in the summer and early fall months of 1933, mainly as a result of the President's Reemployment Agreement and the provisions of the N. R. A. codes, and the other in the late months of 1936 and early months of 1937, when wage increases were widespread. The second general rise was followed by a slight recession during the first 8 months of 1938, although the level of hourly earnings of factory workers (see chart 1) remained relatively high in comparison with other indices. Hourly earnings began to move upward again in September 1939, due primarily to increased activity in the durable-goods industries, and by December 1940, when the National Defense effort was characterized by overtime hours at premium rates in many key defense industries, hourly earnings had reached 68.3 cents per hour, the highest level up to that time. Average weekly hours in manufacturing reached 41.1 in December 1936, the highest figure in recent years except for the brief period in 1933, prior to the introduction of N. R. A. codes. By January 1938, however, factory hours had receded on an average to 33.3 per week. Improvement in conditions beginning in the fall of 1938 and continuing through 1939 and 1940 resulted in substantial increases in hours worked and by December 1940, when overtime conditions prevailied in many defense industries, factory hours reached an average of 39.8 per w^eek. Small reductions in average hours worked per week were noted in November 1938 and again in November 1939 and 1940, partly as a result of the establishment of maximum hours and overtime pay under the Fair Labor Standards Act. The effects of this law are more apparent, however, on nondurable industries in which exceptionally long hours were worked.2 Changes in Selected Industries and Industry Groups The following charts present graphic comparisons of monthly movements of average weekly earnings, average hourly earnings, and average hours worked per week in selected industries and industry groups. Data are shown from 1932 to 1940 in a number of industries, and from 1933, 1934, or 1935 to 1940 in others for which data for the earlier periods were not considered adequate for presentation. The 2 See Work and Wages in 1939, Monthly Labor Review, March 1940 (reprinted as Serial No. R. 1088); also Employment and Earnings in 1940» Monthly Labor Review, March 1941 (reprinted as Serial No. R . 1269).
Digitized for FRASER http://fraser.stlouisfed.org/ Federal Reserve Bank of St. Louis
MOVEMENTS OF HOURS AND EARNINGS,
19 3 2 - 4 0
5
ALL MANUFACTURING INDUSTRIES OOLLARS
Digitized for FRASER http://fraser.stlouisfed.org/ Federal Reserve Bank of St. Louis
AVERAGE WEEKLY EARNINGS
dollars
6
HOURS
AND
EARNINGS
IN
THE
UNITED
STATES
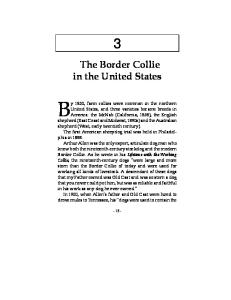
detailed data on which these charts are based appear in tables 5, 6, 7, and 8 at the end of this bulletin. Owing to the wide field covered, a detailed analysis of the significant changes shown in each chart is not feasible. Attention, however, will be called to some of the highlights. Only a few industries have been selected for graphic presentation. In most cases, these few were chosen with a view to presenting a cross section of all industry surveyed by the Bureau, i. e., manufacturing and nonmanufacturing, durable goods and nondurable goods, high-paid and low-paid industries, and key industries in the National Defense program. In some cases the selected industries illustrate the effects of recent legislation on industry averages (see cotton goods and cottonseed—oil, cake, and meal). Durable and Nondurable Goods The influence exerted on the movements of hours and hourly earnings in total manufacturing by the fluctuations of the two components, the durable- and nondurable-goods groups, is graphically presented in chart 2. The contrast between the movements of hours worked in these two groups is striking. Reduction of hours in many of the nondurable-goods industries as a result of the N. R. A. codes in the summer of 1933 and the rise of production in durable-goods industries brought the two levels into closer conformity until they became practically identical early in 1935. By December 1936, when industrial activity had increased sharply, especially in the heavy industries, the workweek in the durable-goods group rose to an average of 42.9 hours, the highest level reached during the period 1932-40. Many collective agreements signed in 1937 made provisions for a 40-hour maximum workweek and some of these contracts established a workweek of less than 40 hours. Most agreements tended to regulate rather than prohibit overtime work.3 In October 1939, the allocation of French and British orders for materials, particularly machine tools, was reflected by sharply increased weekly hours. By December of that year, average hours in durable-goods industries had reached 39.6 as against 37.1 in December 1938. Over the same interval, hours in nondurable-goods industries showed but slight change—37.5 in December 1938 to 37.7 in December 1939. The first significant rise in average weekly hours in durable goods as a result of expenditures for national defense was noted in August 1940. As the defense program unfolded, the need to effect a rapid expansion of output led to a lengthening of the workweek in the key defense industries, even though many plants were required to pay premium rates for overtime hours under the terms of collective agree3 Monthly Labor Review, February 1938 (pp. 341-348), Hours of Work Provided in Collective Agreements in 1937.
Digitized for FRASER http://fraser.stlouisfed.org/ Federal Reserve Bank of St. Louis
MOVEMENTS OF HOURS AND EARNINGS,
1932-40
DURABLE AND NONDURABLE GOODS AVERAGE WEEKLY EARNINGS
DOLLARS 40
DUR A B L E v y , ^ALLMFCT\
lONDURAt 3LE
AVERAGE HOURLY EARNINGS
CENTS 90
D URABLEv !
Jr—i
1
.ALL MANUFACTURINGy
/
^ NONDU R A B L E
AVERAGE HOURS WORKED PER WEEK
HOURS 60
DUR A B L E ^
. A L L MFG.
1932
7
\
1933
U. S. BUREAU. OF LABOR STATISTICS
Digitized for FRASER http://fraser.stlouisfed.org/ Federal Reserve Bank of St. Louis
NONDUf
1934
1935
1936
1937
1938
1939
1940
1941
7
8
SOURS AND EARNINGS IN THE UNITED STATES
ments or those of the Fair Labor Standards Act. Labor shortages ill some occupations and localities contributed to the increase in hours. Such important industries as aircraft, shipbuilding, machine tools, aluminum manufactures, engines and turbines, and electrical machinery reported widespread use of overtime in order to meet delivery schedules on defense contracts.4 By December 1940, weekly hours in the durable-goods group had reached 41.2, a general average in excess of the Fair Labor Standards individual maximum (without extra compensation) established in October 24, 1940. The consistency of trends in average hourly earnings in the durableand nondurable-goods industries and their effect on earnings in all manufacturing are also shown in chart 2. Earnings in both groups tend to move uniformly. Both durable and nondurable goods reflect the upswing in rates of wages in 1933-34 and again in 1936-37, with a general leveling off after each of these rises. Workers in durable goods, however, generally profited more from wage increases during 1937. Average hourly earnings in the durable-goods industries increased 16.9 percent from 1936 to 1938 as against an increase of 10.4 percent in the nondurable industries over the same period. Few changes in the general averages were recorded during 1938 and 1939 with the result that the levels at the end of 1939 were not significantly different from levels at the beginning of 1938. During 1940, hourly earnings in most durable-goods industries showed sizeable increases. Changes in rates of pay had comparatively little to do with the rise. Two important factors contributed to the increase in hourly earnings in durable-goods industries: (1) The large increase in the numbers of workers employed in the high-wage industries, such as iron and steel automobiles, and shipbuilding; and (2) the increase in overtime payable at premium rates. After October 24, 1940, under the Fair Labor Standards Act, the number of hours payable at straight-time rates was limited to 40 per week. It was estimated that this change affected about 2,650,000 wage earners in any week of average activity. It was, however, further estimated that as many as 700,000 of these workers were already being paid time and a half for overtime when the normal hours were reduced from 42 to 40.5 Average hourly earnings in the nondurable-goods industries were 61.7 cents in December 1940 as against 60.5 cents in December 1939. These earnings were affected to some degree by the applications of recommendations of industry committees under the Fair Labor Standards Act. Although there w^as no general increase in the minimum rate in 1940, orders effective in 1940 were issued for the following 4 See Extent of Week End Shut-Downs in Selected Defense Industries, Monthly Labor Review, March 1941 (reprinted as Serial No. R. 1270). 4 See Employment and Earnings in 1943, Monthly Labor Review, March 1941 (reprinted as Serial No. R . 1269).
Digitized for FRASER http://fraser.stlouisfed.org/ Federal Reserve Bank of St. Louis
MOVEMENTS OF HOURS AND EARNINGS,
19 3 2 - 4 0
9
industries: January 15, millinery, with a minimum of 40.0 cents an hour; April 29, boots and shoes, 35.0 cents; May 6, knitted underwear and commercial knitting, 33.5 cents; June 17, woolen textiles, 36.0 cents; July 1, knitted outerwear, 35.0 cents; July 1, fur-felt hats, 40.0 cents; July 15, 26 branches of apparel manufacturing, minimum rates ranging from 32.5 to 40.0 cents; September 16, leather, 40.0 cents; and September 16, pulp and primary paper products, 40.0 cents. The estimated number of workers whose wages were increased by these orders ranged from 2,700 in the leather industry to approximately 200,000 in the apparel group. Previous orders effective on October 24, 1939, provided a minimum wage of 32.5 cents an hour in the textile industry (except wool) and the seamless branch of the hosiery industry, and for a minimum wage of 40.0 cents in the full-fashioned brauch of the hosiery industry. Blast Furnaces, Steel Works, and Rolling Mills; Automobiles The fluctuations of hours and earnings in two important durablegoods industries, blast furnaces, steel works, and rolling mills, and automobiles—the largest consumer of steel products—are shown in chart 3. The similarity of trends in weekly hours in these industries and also the higher level of average hourly and weekly earnings in the automobile industry, as well as the greater seasonality of the latter industry, are clearly portrayed in this chart. Average weekly earnings in blast furnaces rose from a depression low of $11.52 in July 1932 to an all-time high of $36.07 in April 1937. After decreasing sharply through the 1937-38 recession, weekly earnings rose to $33.91 in October 1939, due primarily to the stimulus given to heavy industry by the European War, and rose further to $34.65 in December 1940 as a result of National Defense orders. Weekly earnings in the automobile industry reached the highest figure shown ($39.25) in October 1940, contrasted with the low average of $14.14 in September 1932. The figures for the automobile industry relate to employees engaged in the production of motor vehicles and motor-vehicle bodies and parts as well as those employed in certain integrated plant departments engaged in the manufacture of basic materials. Average hourly earnings and average hours per week by months are not available for the automobile industry for years prior to 1934. The greatest rise in hourly earnings in both automobiles and blast furnaces, steelworks, and rolling mills occurred between October 1936 and July 1937. In the latter alone, during this period, wage increases affecting approximately 150,000 wage earners were reported to the Bureau. Collective agreements in both industries negotiated in 1937 and renewed periodically have tended to keep hourly earnings at or above the 1937 level.
Digitized for FRASER http://fraser.stlouisfed.org/ Federal Reserve Bank of St. Louis
HOURS AND EARNINGS IN THE UNITED STATES
10
BLAST FURNACES AND AUTOMOBILES AVERAGE WEEKLY EARNINGS
DOLLARS 40
o.
AUTOMOBILES^
A
/ ^ A / ^ l ^ S f
ff^ir^^jC^^^Lf^TURING 1 1 BLAST Fl JRNACES
AVERAGE HOURLY EARNINGS
CENTS 100
AUTO MOBILES-
- H
1
1 1 i I J ^ B L A S T FURNACES 1 ALL MANlIFACTURING
AVERAGE HOURS WORKED PER WEEK
HOURS 50
1
1 ALL IUFACTURING
|
BLAST F
V. URNACES lOBILESft
^AUTOM
1932
1933
U.S. BUREAU OF LABOR STATISTICS
Digitized for FRASER http://fraser.stlouisfed.org/ Federal Reserve Bank of St. Louis
1934
1935
1936
1937
1938
1939
1940
1941
MOVEMENTS OF HOURS AND EARNINGS,
19 3 2 - 4 0
11
Average weekly hours in the automobile industry have a distinct seasonal pattern, whereas those for blast furnaces show but slight seasonal fluctuation, being affected more by the placement of orders as conditions warrant. Average hours in blast furnaces reached 43.5 in late 1936 and early 1937. In the summer of 1937, average hours fell substantially as a result of strikes, which at one time involved over 100,000 employees in the industry. Sharp curtailment of operations during the latter half of 1937 resulted in further declines, and by January 1938 an average of only 24.9 hours per week was reported. The general average did not return to the scheduled 40-hours-perweek level until October 1939, when the industry was operating near capacity. The average fell below this level, however, in the early months of 1940, dropping to 34.4 hours in April. National Defense contracts awarded in June 1940 and later months made unprecedented demands upon the man power of the steel industry. By December, therefore, when operations were close to theoretical capacity, hours in the industry were at 40.4. This increase in hours was coincident with a sharp rise in employment. Average hours in the automobile industry were substantially below 40 per week from December 1936 until October 1940, when they rose to 41.3. The December 1940 figure (38.2) was the highest December level since 1936. Employment in December 1940 was also at the highest December level on record. Foundries and Machine Shops; Machine Tools Chart 4 shows the movements of average weekly earnings, average hourly earnings, and average hours per week in two other closely related durable-goods industries-—foundries and machine shops,6 and machine tools, key industries in the National Defense program. Neither of these industries shows more than slight seasonal fluctuations. In fact, the movements of earnings in the foundries and machineshops industry bear an impressive similarity to the movements of earnings in all durable-goods industries combined. Wage earners in the more highly specialized machine-tool industry received more pay than those in the foundries and machine-shops industry and in general worked longer hours per week. The increase in weekly earnings in machine tools from $24.26 in July 1938 to $39.56 in December 1940, a rise of about 63 percent, serves to emphasize the "boom" character of conditions in the industry at the end of 1940. Over the same period weekly earnings in foundries and machine shops rose from $23.99 to $32.85, an increase of 37 percent. It is noteworthy, moreover, 6 The foundries and machine-shops industry as classified by the Bureau of Labor Statistics includes establishments manufacturing cranes and dredging machinery, boiler-shop products, foundry products, and machinery and machine-shop products, 402097°—42
Digitized for FRASER http://fraser.stlouisfed.org/ Federal Reserve Bank of St. Louis
2
12
HOURS
AND
EARNINGS
IN
THE
UNITED
STATES
MACHINE TOOLS FOUNDRIES AND MACHINE SHOPS AVERAGE WEEKLY EARNINGS
DOLLARS 40 r
DOLLARS 40
[ 1 MACHINE TOOLS!
Ii _
30
; ^NUFACTURING
1
W\
1 FOl INDRIES & MACHINE SHOPS
AVERAGE HOURLY EARNINGS
CENTS 90
IMACHINE T O O L S ^ f A ^ F O U N O R I E S
L—iv^
^ ALL MANUFYEING a
1
1
SUNDRIES
AVERAGE HOURS WORKED PER WEEK
HOURS 60 r
DYEING a CLEANING* ^^
^W
L A I JNDRIES
1932
1933
1934
U.S.BUREAU OF LABOR STATISTICS
402097°—42
Digitized for FRASER http://fraser.stlouisfed.org/ Federal Reserve Bank of St. Louis
3
1935
1936
1937
1938
1939
1940
1941
27
28
HOURS AND EARNINGS IN THE UNITED STATES
classes ranging from 36.0 to 37.9 hours and 34.0 and 35.9 hours, respectively. The remaining industries fell within classes as follows: Twelve averaged in excess of 42 hours per week, six averaged less than 34 hours per week. The level of average hours in any given month or year is not necessarily a measure of activity in the industry. For example, among the industries averaging in excess of 40 hours per week in 1940 (table 1), the following could be characterized as "long-hour" industries: Butter; ice cream; cottonseed—oil, cake, and meal; beet sugar; flour; baking; hotels (year-round); street railways and busses; wholesale trade; retail trade; laundries; and dyeing and cleaning. Similarly, rubber, coal mining, and clothing are "short-hour" industries. The industry averages shown in table 1 for 1940 were, of course, different in many instances from those for the year 1939. In all manufacturing there was only a small general increase in hours of work, the average of 38.1 hours in 1940 comparing with 37.6 in 1939. As noted elsewhere,16 the defense industries, such as aircraft, machine tools, engines and turbines, shipbuilding, explosives, and electrical machinery, showed substantial increases especially during the last half of the year. The provisions of the Fair Labor Standards Act called for a reduction of time payable at straight-time rates from 42 to 40 hours per week in October 1940. In many industries such as those listed above, however, overtime operations prevailed in spite of overtime premiums. The effects of the act were apparent after October 1938, particularly in several nondurable-goods industries in which hours of work were usually long, such as cottonseed—oil, cake, and meal; 17 flour; and cane-sugar refining. 16 See footnote 2, p. 4. Some operations of the cottonseed—oil, cake, and meal—industry are exempted from the overtime provisions of the act. See Interpretative Bull. No. 14, p. 15, Office of the General Counsel, Wage and Hour Division, Department of Labor
Digitized for FRASER http://fraser.stlouisfed.org/ Federal Reserve Bank of St. Louis
MOVEMENTS OF HOURS AND EARNINGS, 19 3 2 - 4 0
29
1.—Average number of hours worked per week in 19J+0 in the individual manufacturing and nonmanufacturing industries, arranged in descending order and grouped by class intervals
TABLE
Industries and class intervals
Average hours worked per week
38.0-89.9 hours—85
Over 46.0 hours—4 industries Machine tools Hotels (year-round) Butter Street railways and busses.
48.2 46.3 46.2 46.1
44.0-45.9 hours—1 industry Ice cream.
45.4
42.0-43.9 hours—7 industries Cottonseed—oil, cake and meal Engines, turbines, water wheels, and windmills Aircraft Sugar, beet— Laundry Retail trade Dyeing and cleaning
43.7 43.7 43.2 43.1 43.0 42.9 42.9
41.4 41.4 41.3 41.2 41.2 41.1 41.0 40.9 40.7 40.7 40.6 40.6 40.5 40.4 40.3 40.2 40.1 40.1 40.0
88.0-39.9 hours—85 industries Shipbuilding.. Explosives Soap. Electric light and power. Druggists' preparations Wire work Typewriters and parts Cutlery (not including silver plated cutlery) and edge tools Bolts, nuts, washers, and rivets Telephone and telegraph Clocks and watches and time-recording devices Furniture Quarrying and nonmetallic mining Structural and ornamental metalwork Boxes, paper Stamped and enameled ware R a y o n and allied products Jewelry
Digitized for FRASER http://fraser.stlouisfed.org/ Federal Reserve Bank of St. Louis
Average hours worked per week
industries—Continued
Agricultural implements (including tractors) Hardware Tin cans Locomotives .. Beverages Lighting equipment Stoves Smelting and refining—copper, lead, and zinc Rubber goods, other Book and job printing Radios and phonographs Cement Rubber boots and shoes Confectionery Knitted cloth Sawmills Cars, electric- and steam-railroad
39.1 39.0 39.0 39.0 39.0 38.9 38.8 38.8 38.7 38.5 38.5 38.5 38.3 38.1 38.0 38.0 38.0
86.0-37.9 hours—17 industries
40.0-41.9 hours—19 industries Flour Baking Forgings, iron and steel Wholesale trade Brass, bronze, and copper products Tools (not including edge tools, machine tools, files, and saws) Foundry and machine-shop products Metalliferous mining Mill work Electrical machinery, apparatus, and supplies Paints and varnishes Silverware and plated ware Paper and pulp Steam and hot-water heating apparatus and steam fittings Textile machinery and parts Slaughtering and meat packing Aluminum manufactures Cash registers, adding machines, tod calculating machines Chemicals
Industries and class intervals
39.8 39.8 39.8 39.7 39.6 39.5 39.5 39.5 39.5 39.4 39.4 39.3 39.3 39.2 39.2 39.1 39.1 39.1
Automobiles Cotton small wares. Plumbers' supplies Crude-petroleum production Sugar refining, cane Leather Dyeing and finishing textiles Blast furnaces, steel works, and rolling mills Cast-iron pipe Pottery Brick, tile and terra cotta Knitted outerwear Canning and preserving Cigars and cigarettes Woolen and worsted goods Petroleum refining Cotton goods
37.9 37.8 37.8 37.8 37.6 37.6 37.6 37.3 37.2 37.2 37.0 36.4 36.3 36.3 36.1 36.1 36.0
84.0-85.9 hours—14 industries Newspapers and periodicals Glass Corsets and allied garments Silk and rayon goods Knitted underwear Marble, granite, slate, and other productsFertilizers Carpets and rugs Chewing and smoking tobacco and s n u f f . . Rubber tires and inner tubes M e n ' s furnishings Boots and shoes Shirts and collars.. Hosiery
35.9 35.8 35.7 35. 7 35.6 35.6 35.4 35. 2 34.9 34.8 34.4 34.2 34.1 34.0
82.0-38.9 hours—4 industries Clothing, women's Building construction.. Clothing, men's Hats, fur-felt
33.1 32.5 32.5
Less than 82.0 hours— 2 industries Bituminous coal. Anthracite
28.1 27.2
30
HOURS AND EARNINGS IN THE UNITED STATES
The range of average hourly earnings by industries in 1940 is shown in table 2. Wage earners in the newspapers and periodicals industry had the highest hourly earnings in 1940, averaging 103.3 cents, while those in the petroleum refining industry were second highest in 1940, averaging 97.4 cents. Other industries in which the average earnings were over 90 cents per hour in 1940 were rubber tires and inner tubes, 96.7 cents; private building construction, 95.8 cents; automobiles, bodies, and parts, 94.8 cents; and anthracite mining, 92.4 cents. Of the 103 industries for which average-hourly-earnings data are available for 1940, the year-round hotels paid the lowest, employees averaging 33.2 cents per hour. This average, however, does not include value of board, room, and tips, which cannot be computed. Wage earners in the cottonseed—oil, cake, and meal—industry received the second lowest, averaging 33.5 cents. On the basis of a 10-cent class interval, approximately one-half of the industries fell within the 2 class intervals, 60.0-69.9 cents and 70.0-79.9 cents. Earnings in 19 industries were above 80 cents and 34 averaged under 60 cents per hour. The Fair Labor Standards Act provided for a minimum of 25 cents per hour after October 24, 1938, and a minimum of 30 cents per hour after October 24, 1939, in the covered industries. In most industries, the average was already above the minimum established by the act. Since there is a wide range of rates within each industry, however, in many industries some workers were affected by the minimum. The effects of the law were more apparent in the industry averages of those industries with low rates of pay, notably cottonseed—oil, cake, and meal; men's furnishings; cotton goods; and shirts and collars. These industries showed significant increases in hourly earnings immediately following the application of the general industry minimum or of the recommendations of industry committees. In 1940, average hourly earnings in most industries showed substantial increases over 1939. As stated elsewhere, the wage orders issued as a result of recommendations of industry committees under the Fair Labor Standards Act established new minimum rates in many industries, particularly in the textile and apparel lines. In addition, overtime hours at time and a half resulted in higher hourly earnings, especially in many defense industries.
Digitized for FRASER http://fraser.stlouisfed.org/ Federal Reserve Bank of St. Louis
MOVEMENTS OF HOURS AND EARNINGS, 1 9 3 2 - 4 0
31
2.—Average hourly earnings in 1940 in individual manufacturing and nonmanufacturing industries arranged in descending order and grouped by class intervals
TABLE
Average hourly earnings
Industries and class intervals
Over 90 cents—6 industries Newspapers and periodicals Petroleum refining Rubber tires and inner tubes Building construction Automobiles Anthracite
—
Cents 103.3 97.4 96.7 95.8 94.8 92.4
80.0-89.9 cents—IS industries Electric light and p o w e r . . Beverages Bituminous coal Crude-petroleum production Shipbuilding Blast furnaces, steel works, and rolling mills. Explosives Cash registers, adding machines, and calculating machines Engines, turbines, water wheels, and windmills Book and j o b printing Telephone and telegraph Chemicals ! Agricultural implements (including tractors)
88.4 88.3 88.3 88.1 87.0 84.8 84.7 82.9 81.7 81.1 80.6 80.4 80.0
70.0-79.9 cents—23 industries Forgings, iron and steel Locomotives Brass, bronze, and copper products Machine tools Electrical machinery, apparatus, and supplies Cars, electric- and steam-railroad Glass Aircraft Wholesale trade Structural and ornamental metalwork Foundry and machine-shop products Hats, fur-felt Metalliferous mining Paints and varnishes Street railways and busses Smelting and refining—copper, lead, and zinc Marble, granite, slate, and other products,. Aluminum manufactures Soap Steam and hot-water heating apparatus and steam fittings Cement Wire work Lighting equipment
79.1 78.5 76.9 76.8 75.8 75.0 74.5 74.3 73.9 73.6 73.4 73.4 73.3 72.2 72.2 72.1 71.9 71.6 71.5 71.4 71.0 70.3 70.1
60.0-69.9 cents—27 industries Plumbers' supplies Bolts, nuts, washers, and rivets Slaughtering and meat packing Hardware Stoves R a y o n and allied products Carpets and rugs Textile machinery and parts
69.7 69.6 68.6 68.3 68.0 67.9 66.9 66.1
Industries and class intervals
60.0-69.9 cents—27 industries—Continued Typewriters and parts Silverware and plated ware Stamped and enameled ware Leather Paper and pulp Sugar refining, cane Ice cream Baking Tools (not including edge tools, machine tools, files, and saws) Pottery T i n cans Cutlery (not including silver and plated cutlery) and edge tools Rubber goods, other Rubber boots and shoes Sugar, beet Radios and phonographs Flour Druggists' preparations Cast-iron pipe 50.0-59.9 cents—17 industries Clocks and watches and time-recording devices Clothing, men's Jewelry Quarrying and nonmetallic mining Woolen and worsted goods Brick, tile, and terra cotta Boxes, paper Hosiery Furniture Mill work Dyeing and finishing textiles Retail trade Clothing, women's Chewing and smoking tobacco and snuff.. Boots and shoes Confectionery Sawmills 40.0-49.9 cents—15 industries Cotton smallwares Knitted cloth Dyeing and cleaning Cigars and cigarettes Butter Knitted outerwear Corsets and allied garments Canning and preserving Silk and rayon goods Knitted underwear Fertilizers Laundries Men's furnishings Cotton goods Shirts and collars Less than 40.0 cents—2 industries Cottonseed—oil, cake, and meal Hotels (year-round) 1
1 Cash payments only; additional value of board, room, and tips cannot be computed.
Digitized for FRASER http://fraser.stlouisfed.org/ Federal Reserve Bank of St. Louis
32
HOURS AND EARNINGS IN THE UNITED STATES
3.—Average weekly earnings in 1940 in individual manufacturing and nonmanufacturing industries arranged in descending order and grouped by class intervals
TABLE
Industries and class intervals
Average weekly earnings
Industries and class intervals
$38. 23 36. 97 36. 86 36. 55 35. 88
Tools (not including edge tools, machine tools, files, and saws) Typewriters and parts Stamped and enameled ware Marble, granite, slate, and other products. _. Flour Druggists' preparations
$25-$29.99—80
Over $35—7 industries Newspapers and periodicals Machine tools Brokerage Insurance Automobiles --Engines, turbines, water wheels, and windmills Electric light and power
35. 60 35.10
$30-$S4.99—21 industries Petroleum refining .. Shipbuilding Beverages Crude-petroleum production Street railways and busses Explosives R u b b e r tires and inner tubes Cash registers, adding machines and calculating machines Forgings, iron and steel Chemicals Building construction Brass, bronze, and copper products Telephone and telegraph Blast furnaces, steel works, and rolling mills. Agricultural implements (including tractors) Book and job printing Electrical machinery, apparatus, and supplies Locomotives Wholesale trade Foundry and machine-shop products
34. 98 34.81 34. 07 34.03 33. 75 33. 73 33. 55 33. 06 32. 56 32.17 31.62 31.61 31.60 31.54 31.40 31.18 30. 78 30. 72 30. 58 30. 39 30.13
$25-$29.99—30 industries Metalliferous mining Ice cream Paints and varnishes Structural and ornamental metal work Steam and hot-water heating apparatus and steam fittings Aluminum manufactures Cars, electric- and steam-railroad Soap Smelting and refining—copper, lead, and zinc Wire work Slaughtering and meat packing Bolts, nuts, washers, and rivets Cement Lighting equipment Hardware Glass Textile machinery and parts Rayon and allied products Silverware and plated ware Stoves Baking Plumbers' supplies — Paper and pulp Sugar, beet 1
29. 86 29.47 29. 26 28. 83 28. 28. 28. 28.
71 71 47 45
27. 97 27. 74 27. 60 27. 50 27. 34 27. 29 26. 64 26. 63 26. 56 26. 51 26. 46 26. 33 26. 32 26. 31 26.13 26.07
industries—Continued
$20-$24.99—26 industries Anthracite Bituminous coal Tin cans Leather Sugar refining, cane Cutlery (not including silver and plated cutlery) and edge tools Millinery Rubber goods, other Hats, fur-felt Rubber boots and shoes Clocks and watches and time-recording devices Radios and phonographs Carpets and rugs Jewelry Pottery Butter Cast-iron pipe Quarrying and nonmetallic mining Mill work Boxes, paper Furniture Retail trade Brick, tile, and terra cotta Dyeing and finishing textiles Dyeing and cleaning Wooien and worsted goods $15-$19.99—19 industries Clothing, women's Clothing, m e n ' s . . Confectionery. Sawmills Knitted cloth Hosiery Chewing and smoking tobacco and snuff. Cotton smallwares Laundries Boots and shoes Cigars and cigarettes Knitted outerwear Corsets and allied garments Canning and preserving Silk and rayon goods.. Hotels (year-round) 1 .. Knitted underwear Cottonseed—oil, cake, and meal Fertilizers Less than $15—8 industries Cotton goods M e n ' s furnishings Shirts and collars
Cash payments only; the additional value of board, room, and tips cannot be computed.
Digitized for FRASER http://fraser.stlouisfed.org/ Federal Reserve Bank of St. Louis
MOVEMENTS OF HOURS AND EARNINGS,
1932-40
33
Table 3 shows average weekly earnings in 1940. As in average hourly earnings, the newspapers and periodicals industry topped the list with average weekly earnings of $38.23. Machine-tools employees were next with earnings of $36.97 per week while insurance and brokerage employees ranked third and fourth with earnings of $36.86 and $36.55, respectively. On the other hand, lowest on the list of the 106 industries for which weekly earnings are available for 1940 was the shirts and collars manufacturing industry with average weekly earnings of $13.91. Other industries showing average weekly earnings of less than $15 per wage earner in 1940 were men's furnishings, $14.56, and cotton goods, $14.85. The total number of industries shown in table 3 is 106. Data are included for the millinery, brokerage, and insurance industries, for which information concerning average hours and average hourly earnings (tables 1 and 2) is not available.
Digitized for FRASER http://fraser.stlouisfed.org/ Federal Reserve Bank of St. Louis
Chapter II Scope and Methods The employment and pay-roll figures published by the Bureau each month for the 90 manufacturing and 16 nonmanufacturing industries surveyed are, of necessity, based on samples secured from representative firms which cooperate by supplying, on a voluntary basis, employment, pay-roll, and man-hour data for the pay period ending nearest the 15th of the month. Early in 1932, however, when the Bureau first requested man-hour information, many companies did not keep records of hours. As additional firms began to keep such records for various purposes, the reported man-hour sample increased sufficiently so that within a relatively short period of time the average hours and average hourly earnings derived from these data were considered adequate to indicate levels and movements in virtually all of the industries surveyed. In manufacturing industries, for instance, the firms furnishing manhour data in 1932 employed only 28 percent of all factory workers, whereas the number of wage earners in all reporting firms constituted approximately 50 percent of total factory employment. By 1940 firms employing 55 percent of all factory workers were supplying man-hour figures to the Bureau each month, the total reporting sample at this date representing 59 percent. Thus, in terms of the reporting sample, the workers in factories supplying man-hour information in 1932 constituted about 56 percent of those in all reporting establishments, and in 1940 over 90 percent. In 1940, an average of 26,065 manufacturing establishments employing more than 5,000,000 wage earners reported to the Bureau each month. Of these, 23,259 establishments employing nearly 4,700,000 wage earners reported man-hours. Similarly, in the nonmanufacturing industries for which the Bureau requests man-hour data, namely, the mining, public utilities, trade, service, and private building construction industries, the proportion of firms supplying man-hour information also has increased noticeably since 1932. The increase in coverage in the man-hour sample from 1932 to 1934, the period of greatest expansion, and from 1934 to 1940 can readily be seen in table 4, which gives by industries (1) estimated total employ34
Digitized for FRASER http://fraser.stlouisfed.org/ Federal Reserve Bank of St. Louis
SCOPE AND METHODS
35
ment in 1940/ presented for the purpose of showing the relative importance of each industry, (2) percentages of estimated total employment in 1932, 1934, and 1940 in all firms reporting to the Bureau, and (3) percentages of estimated total employment in 1932, 1934, and 1940 in firms reporting man-hour data. 4.—Estimated total employment in manufacturing and nonmanufacturing industries in 1940, and the percentages of estimated total employment in the total reporting sample and in the man-hour sample in 1932, 1934, and 1940
TABLE
MANUFACTURING
INDUSTRIES
Industries
All manufacturing. Durable goods Nondurable goods..
Estimated employment
Percentage of Percentage of wage earners in wage earners in the total report- the reporting man-hour ing sample sample
1940
19321 19341 1940 19321 19341 1940
8,483, 900
50
51
59
28
42
55
4,014, 700 4,469, 200
57 46
55 48
65 54
37 22
49 37
63 49
61 73 84 65
76 92 74 88
47 65 69 52
56 67 79 59
74 88 74 86
Durable goods Iron and steel and their products, not including machinery. Blast furnaces, steel works, and rolling mills Bolts, nuts, washers, and rivets Cast-iron pipe Cutlery (not including silver and plated cutlery) and edge tools Forgings, iron and steel Hardware Plumbers' supplies Stamped and enameled ware Steam and hot-water heating apparatus and steam fittings. Stoves Structural and ornamental metalwork Tin cans and other tinware Tools (not including edge tools, machine tools, files, and saws) Wirework
64 977, 300 483,600 79 16,400 2 100 17,800 62 17, 500 17, 500 50,800 26,000 55,900 38,900 44, 400 38, 400 30,000
87 71 84 36 50 81 57 67 37
60 83 79 76 49 65 70 71 41
68 65 84 85 63 78 71 68 88
49 32 58 25 28 55 32 52 13
55 79 73 72 45 62 56 68 33
63 64 84 85 61 77 68 68 82
17, 700 30, 300
80 32
85 18
80 72
63 8
79 16
78 72
33 22
48 61
67 90
Machinery, not including transportation equipment 56 59 69 1, 058, 300 61,100 78 92 Agricultural implements (including tractors) 58 Cash registers, adding machines, and calculating machines 18,100 2 100 2 100 2 100 72 Electrical machinery, apparatus, and supplies 85 87 240, 200 Engines, turbines, water wheels, and windmills 52,400 54 56 85 Foundry and machine-shop products 402, 600 53 51 65 Machine tools 66,000 2 100 96 94 Radios and phonographs 42, 400 67 68 95 44 68 72 Textile machinery and parts 25, 200 16.800 2 100 96 Typewriters and parts 90 Transportation equipment Aircraft Automobiles Cars, electric- and steam-railroad.. Locomotives Shipbuilding
687, 900 90,100 447, 600 35,800 6, 400 93, 700
82 91 87 35 84 81
74 86 92 88 75 88 71 77 85 2 100 80 87
96 2 100 2 100 58 85 45 84 56 30 62 31 47 93 81 95 94 45 28 71 30 60 89 56 93 65 46 76 9 23 35
70 70 72 68 85 68
83 76 87 76 2 100 82
See footnotes at end of table. i T h e estimates of employment for manufacturing industries are based on the Bureau's indexes of employment and 1937 Census of Manufactures' data. Those for all manufacturing industries combined, the durable- and nondurable-goods groups, and the aircraft industry are based on indexes and the preliminary Census of Manufactures figures for 1939 and are subject to revision when final census data for 1939 become available. The totals shown for all manufacturing industries combined and for the various groups relate to total employment and are not the sums of the industry figures shown. The estimates for nonmanufacturing industries shown are likewise based on the Bureau's indexes of employment and respective census data and are subject to revision when more recent census data are made available. With regard to the four industries for which no information is shown, estimates of total employment were not possible because of lack of comparable census data.
Digitized for FRASER http://fraser.stlouisfed.org/ Federal Reserve Bank of St. Louis
HOURS AND EARNINGS IN THE UNITED STATES
36
4.—Estimated total employment in manufacturing and nonmanufacturing industries in 19^0, and the percentages of estimated total employment in the total reporting sample and in the man-hour sample in 1932, 1984, and 1940—Con.
TABLE
MANUFACTURING
INDUSTRIES-Continued
Industries
Estimated employment 1940
Durable
Percentage of Percentage of wage earners in wage earners in the reporting the total reportman-hour ing sample sample 1932
1934 1940 1932 1934
1940
goods—Continued
Nonferrous metals and their products.,Aluminum manufactures Brass, bronze, and copper products Clocks and watches and time-recording devices. Jewelry Lighting equipment Silverware and plated ware Smelting and refining—copper, lead, and z i n c . . .
284,600 28, 300 90.600 20,800 24,300 20, 900 12, 200 30, 500
44 45 69 35 56 27 79 57
45 41 59 68 41 22 82 74
56 55 69 92 59 52 90 86
23 11 38 19 18 10 50 38
40 25 57 63 26 18 78 67
55 55 68 92 49 52 84 86
Lumber and allied products Furniture Lumber: Millwork__ Sawmills.
636, 600 157, 700
31 44
32 48
38 54
17 21
27 38
36 50
68, 500 300, 000
50 39
60 39
52 39
25 24
51 32
50 38
Stone, clay, and glass p r o d u c t s . . . — Brick, tile, and terra cotta. Cement Glass Marble, granite, slate, and other products.. Pottery
290,100 62, 500 25, 400 75,300 17, 600 35, 200
53 59 81 82 30 65
52 51 81 79 32 72
51 58 81 80 33 74
26 29 56 34 16 26
40 34 73 65 29 43
47 51 81 78 30 57
1,648, 700 1,022,200 26, 300 409. 400 12, 700 81,800 12,800 135,900 23,000 35,100 9,100 81, 300 149,800
45 58 76 68 82 56 47 64 30 69 32 45 50
51 66 63 79 72 94 75 88 79 95 56 58 54 48 65 67 36 69 73 2 100 36 70 44 90 73 86
23 35 24 46 49 37 3 36 10 24 8 33 26
40 51 64 59 65 47 36 51 26 55 16 39 65
60 75 94 85 88 56 46 60 64 95 61 84 84
552,900 191,400 209, 900 17, 200 23, 800 24, 000 69, 400
27 39 17 41 28 38 27
33 49 19
4o
34 34 37
53 66 38 65 57 38 74
5 7 3 11 6 6 5
23 39 11 23 21 14 25
41 53 26 59 46 18 63
Leather and its manufactures. Boots and shoes Leather
297, 800 192, 500 45, 300
49 58 63
50 58 68
59 74 74
14 15 26
31 35 52
47 56 68
Food and kindred productsBaking..
864, 500 235,100 76, 700 18, 500 122, 200 53, 600 26, 500 18,100 139, 600 9, 000 13, 900
46 46 48 34 33 36 55 51 46 26 31 38 52 60 67 72 69 71 67 73 58 65 56 80 82 82 79 2 100 96 2 100 72 94 74
21 14 22 11 22 31 38 29 43 64 24
34 25 46 15 40 56 55 37 56 91 53
42 29 47 25 62 61 54 40 76 89 94
62 88 58
33 65 29
49 84 44
Nondurable goods Textiles and their products. Fabrics Carpets and rugs Cotton goods Cotton smallwares Dyeing and finishing textiles. Hats, fur-felt Hosiery Knitted outerwear Knitted underwear Knitted cloth Silk and rayon goods Woolen and worsted goods. __ Wearing apparel. Clothing, men's Clothing, women's Corsets and allied garments. M e n ' s furnishings Millinery Shirts and collars
Butter . Canning and preserving Confectionery Flour Ice cream Slaughtering and meat packing.. Sugar, beet Sugar refining, c a n e . - . T o b a c c o manufactures Chewing and smoking tobacco and snuff. Cigars and cigarettes See footnotes at end of table.
Digitized for FRASER http://fraser.stlouisfed.org/ Federal Reserve Bank of St. Louis
88,400 9, 300 79,100
77 61 95 2 100 57 71
1
73 2 100 68
SCOPE AND METHODS
37
4.—Estimated total employment in manufacturing and nonmanufacturing industries in 1940, and the percentages of estimated total employment in the total reporting sample, and in the man-hour sample in 1932, 1984, and 1940—Con.
TABLE
MANUFACTURING
INDUSTRIES—Continued
Industries
Estimated employment 1940
Nondurable
Percentage of Percentage of wage earners in wage earners in the reporting the total reportman-hour ing sample sample 1932
1934 1940 1932 1934 1940
goods—Continued
Paper and printing.. Boxes, paper Paper and pulp Printing and publishing: Book and job Newspapers and periodicals
614, 700 67, 200 138, 700 134, 000 135,900
57 44
50 33
Chemical, petroleum and coal products Chemicals Cottonseed—oil, cake, and meal Druggists' preparations Explosives Fertilizers Paints and varnishes Petroleum refining Rayon and allied products Soap
404, 700 80,100 12, 900 16,100 7, 600
61 72 43 66 75 68 72 87 96 2 100
58 71 40 45 75 67 70 79 96 »100
Rubber products Rubber boots and shoes Rubber tires and inner tubes. Rubber goods, other
118, 700 14,500 54, 500 49, 600
93
91 ' 100 99 77
NONMANUFACTURING Coal mining: Anthracite Bituminous Metalliferous mining Quarrying and nonmetallic mining Crude-petroleum production Public utilities: Telephone and telegraph Electric light and power Street railways and busses Trade: Wholesale Retail General merchandising Other than general merchandising,. Hotels (year-round) Laundries Dyeing and cleaning Brokerage Insurance Building construction.
44 58
20, 000
29, 800 78,800 49,600 13,600
2 100
2 100
80
INDUSTRIES
72,400 403,900 76, 900 42,900
88 48 58 47
84 57 61 70
84 59 83 83
79 30 50 34
74 38 57 59
73 44 82 78
392, 600 249, 900 192, 200
70 75 81
73 93 81
74 98 71
56 46 55
62 66 58
73 83 57
1,450, 700 3, 535, 900 818,100 2, 717,800
6 12 35 6
15 21 44 14
23 29 59 20
2 4 13 2
9 12 24 8
16 18 36 12
268, 500 229,900 61,400
62 30 25
57 35 28
56 35 29
17 12 12
23 25 20
29 27 20
(3)
(3) (33) ()
(3) (3) (3) (3) (3) (3)
(3) (3) (3) (3) (3) (3) (33) (33) (33) (33) (33) (33) () () () () () ()
1 T h e percentages for 1932 and 1934 are based on the estimated employment figures for the respective years and not on those shown for 1940. 2 Where reporting establishments manufacture products falling into more than 1 industry classification and separate employment reports are not available, the classification of establishments b y major product results in a coverage of wage earners equal to, or in excess of, total employment based on a more refined census industry total. 3 N o t available.
As a general rule, the Bureau does not publish average hours and average hourly earnings for an industry if the number of employees in firms reporting man-hours is less than 20 percent of total employment. An exception to this rule, however, has been made for wholesale trade
Digitized for FRASER http://fraser.stlouisfed.org/ Federal Reserve Bank of St. Louis
38
HOURS AND EARNINGS IN THE UNITED STATES
and for retail trade other than general merchandising, notwithstanding the fact that the employment coverage in these man-hour samples is considerably below that in other industries. The reason for this is twofold. First, in many lines of both wholesale and retail trade, the average number of employees per establishment is relatively small when compared with other industries. The collection of data from a sufficient number of the smaller establishments (employing only a few workers) to bring the employment coverage into line with that in other industries, would not be feasible on a current reporting basis. It would require handling thousands of additional reports each month, which would result in unnecessary delay in compiling the monthly tabulations. Secondly, because of the fairly wide distribution and comparatively even geographical representation, it may be assumed, with a fair degree of accuracy, that a larger sample would not materially affect the representativeness of the man-hour data. Averages based on a sample of less than the usual 20 percent have, therefore, been published monthly in recent years for these two fields and are shown in this bulletin. The general expansion in the Bureau's reporting man-hour sample in manufacturing industries between 1932 and 1934 as shown by the percentages in table 4 was due largely to the cooperation of the various code authorities during N. R. A. days. The durable-goods industries, as contrasted with the nondurable, have had in all periods a higher coverage in employment in both the industry and man-hour samples as indicated in this table. Between 1932 and 1940, however, the number of establishments in the nondurable industries reporting man-hour data increased to such an extent that in 1940 the Bureau's coverage in the nondurable-goods industries compares favorably with that in the durable-goods industries. The rubber industries as a group, in 1940, had the highest proportion of employment in the man-hour sample, 91 percent, the transportation group coming next with 83 percent. The iron and steel and tobacco groups ranked third and fourth, showing 74 and 73 percent, respectively, although the fabrics subdivision of the textile group showed a slightly higher coverage, 75 percent. The lumber group, on the other hand, had the lowest coverage (36 percent), notwithstanding the fact that each of the individual industries within this group showed a higher percentage coverage. (See footnote 1, table 4.) Considered from the standpoint of a total group, food and kindred products had the next lowest proportion of employment in the man-hour sample, representing 42 percent. Apparel, a subgroup of textiles, showed only 41 percent. Of the 90 manufacturing industries, only 14 showed that the number of wage earners in 1940 in establishments reporting man-hour information represented less than 50 percent of total wage earners in
Digitized for FRASER http://fraser.stlouisfed.org/ Federal Reserve Bank of St. Louis
SCOPE AND METHODS
39
the industry* The millinery industry had only an 18-percent coverage, the lowest shown under manufacturing. There were 18 manufacturing industries in 1940 in which practically all reporting establishments furnished man-hour data. There were 14 in which employment in the man-hour sample covered over 90 percent of the total wage earners in the industry, 19 in which it represented between 80 and 90 percent, 43 between 50 and 80 percent, and only 1 (millinery) in which it was less than 20 percent. In the nonmanufacturing industries surveyed, the employment coverage in the man-hour sample in 1940 varied considerably as compared with estimated total employment, ranging from 83 percent in electric light and power to 12 percent in retail trade other than general merchandising. This range does not, however, take into account the crude-petroleum production, brokerage, insurance, and building construction industries. Estimates of total employment for these industries are not available because of lack of comparable census data from which such estimates could be derived. As a result, the percentage coverage in these industries could not be computed. The Bureau does not compile man-hour data for the brokerage and insurance industries, due to the impracticability of securing information for some types of personnel. In building construction, man-hon^ information was not collected prior to 1934. Manufacturing Industries The data for manufacturing industries shown in tables 5 and 7 cover the 90 individual industries for which the Bureau compiles monthly information, the several industry groups, the durable- and nondurable-goods groups, and all manufacturing industries combined. The figures relate to wage earners only, as the original reports from which they are compiled request the exclusion of office, sales, executive, managerial, supervisory, technical, and professional personnel.2 Several outstanding changes affecting the composition of the manufacturing industries for which the Bureau publishes monthly employment and pay-roll data have been made within recent years. Although the effects of these changes were incorporated in the regularly published figures of average hours and earnings, comparable data by months for all earlier periods except for total manufacturing and the 2 Wage earners —Covers all skilled and unskilled piece and time workers in production and other departments such as maintenance, shipping, warehousing, power plant, etc., including working foremen and gang and straw bosses, but not those whose work is primarily supervisory. Does not include office and clerical, sales, executive, managerial, supervisory, technical, and professional personnel nor persons working in their homes or in other establishments on materials furnished by the reporting company nor those who are installing products or who are engaged in construction, if such work involves additions to or major repairs of equipment or plant. Pay rolls— Covers wages, including overtime and vacation pay for the period covered. Includes employee contributions for old-age benefits, unemployment insurance, and jgroup insurance; but does not include estimated value of free rent, fuel, and other payments in kind. Bonus payments, unless earned and paid more or less regularly each pay period, are not included.
Digitized for FRASER http://fraser.stlouisfed.org/ Federal Reserve Bank of St. Louis
40
HOURS AND EARNINGS IN THE UNITED
STATES
durable- and nondurable-goods groups have not been published heretofore. Revised data are now shown for all periods from 1932 to date. There were several important changes: (1) The railroad repair-shop group, which was formerly included as a component of the Bureau's manufacturing series, has been omitted and removed from the durable-goods group and from all manufacturing industries combined. (2) The iron and steel group was revised by including data for the stamped and enameled ware industry which was formerly in the nonferrous metals group. (3) The nonferrous metals group was revised by deleting stamped and enameled ware data. (4) The agricultural implements industry has been revised by the inclusion of data for tractor manufactures, which the Bureau formerly classified in the engines, turbines, tractors, and water wheels industry. (5) The latter industry was consequently revised by excluding such data and the name of the industry changed to engines, turbines, water wheels, and windmills. These shifts were made in connection with the revision of the indexes of factory employment and pay rolls to conform to 1935 Census of Manufactures data,3 and were based on similar changes made in the 1935 Census of Manufactures, with the exception of the exclusion of the railroad repair-shop group, which the census abandoned in connection with the 1937 survey. In addition, the series here presented also differs in some instances from previously published figures because of revisions in the basic material due to such factors as (1) the inclusion of reports received too late for the regular monthly tabulations, (2) the reclassification of certain establishments according to the latest information regarding their principal products, and (3) the weighting of certain averages to overcome unbalanced distribution of samples. In three industries, sawmills, fertilizers, and soap, the average weekly earnings, average hours, and average hourly earnings as presented in these tables have been completely revised and are not comparable to those published prior to September 1939, at which time the revised figures were published for the first time. The revisions in the averages for these three industries are the result of special studies made of the currently reporting sample, and in the fertilizer and soap industries, of surveys made by the Bureau's Division of Wage and Hour Statistics. These studies revealed the fact that the currently reporting sample in sawmills was not proportionately balanced geographically, while that in fertilizers was not well distributed by type of establishment. In the soap industry it was disclosed that the sample lacked balance by size of establishment. In order to correct these biases the basic material for each of these industries was broken down into the neces3 In keeping with a Bureau policy, the indexes of factory employment and pay rolls are adjusted biennially to conform to trends indicated by Census of Manufactures data as described in Bull. No. 610, Revised Indexes of Factory Employment and Pay Rolls, 1919 to 1933, and in subsequent press releases. Indexes revised to conform to 1937 Census of Manufactures data were released in September 1939.
Digitized for FRASER http://fraser.stlouisfed.org/ Federal Reserve Bank of St. Louis
SCOPE AND METHODS
41
sary segments, which were variously weighted by factors designed to equalize the effects of the uneven distribution in the reporting sample. These weighting processes will be continued until the reporting sample can be properly stratified as to geographic area, type of establishment and size of establishment, respectively. Although every effort has always been made to keep the reporting sample in the industries surveyed as well balanced as possible, difficulties are encountered in securing adequate data for the smaller establishments and from certain geographic areas. From time to time, therefore, similar tests for other industries will be undertaken w^hich may result in additional revisions. Nonmanufacturing Industries The 16 nonmanufacturing industries for which information is shown in tables 6 and 8 are anthracite mining, bituminous-coal mining, metalliferous mining, quarrying and nonmetallic mining, crude-petroleum production, telephone and telegraph, electric light and power, street railway and bus, 4 wholesale trade, retail trade, year-round hotels, laundries, dyeing and cleaning, brokerage, insurance, and private building construction. The figures presented for these industries show the hours and earnings of the major categories of workers. Data relate to wage earners only in building construction, in laundries and dyeing and cleaning establishments, and in the mining industries. In crude-petroleum production both wage earners and clerical field force employees are included. In the public utilities industries, the data pertain to wage earners and salaried employees, and in hotels to both office and service personnel. In all of the other nonmanufacturing industries shown, namely, retail and wholesale trade and brokerage and insurance, the figures consist largely of data for salaried workers. The definition of salaried employees, however, as relating to these industries and to public utilities was revised in January 1938 to exclude corporation officers, executives, and other employees whose duties are mainly supervisory, although prior to that date such employees were in many instances included in the data supplied by cooperating companies. Therefore, the average weekly earnings, the average hours and the average hourly earnings for periods prior to January 1938 for the industries concerned are not strictly comparable with those for January 1938 and later months, and are shown in italics in tables 6 and 8. * This industry was formerly designated as electric-railroad and motorbus operation and maintenance. The Bureau's coverage of this industry includes both private and municipal street railway companies and affiliated, subsidiary, or successor trolley-bus and motorbus companies.
Digitized for FRASER http://fraser.stlouisfed.org/ Federal Reserve Bank of St. Louis
42
HOURS AND EARNINGS IN THE UNITED
STATES
As for changes in industry composition, the only changes made in the nonmanufacturing series which affect the levels of the hours and earnings presented are in the street railway and bus industry, and the electric light and power industry. These changes in composition were, in general, made in connection with the recent revision of the Bureau's indexes of employment and pay rolls in these industries for conformity with the classifications as shown in the Censuses of Electrical Industries.5 The employment, pay-roll, and man-hour figures for the electric railroad repair-shop industry formerly shown as a separate industry under the manufacturing series (see p. 40) were combined with those for street railways and busses, whereas the former electric light and power and manufactured gas industry was revised by deleting data for manufactured gas. All averages shown in tables 6 and 8 for these industries are based on the revised series. Although the Bureau has in recent months revised its indexes of employment and pay rolls in retail trade, making certain changes in composition, these changes have not been carried through the manhour sample for periods prior to January 1939 since the change in procedure did not result in significant differences in hours-and-earnings levels. As in manufacturing industries, the averages shown in tables 6 and 8 differ in some instances from those previously published because of revisions in the basic material due to the inclusion of late reports or additional information, or for other reasons previously mentioned. Average Hourly Earnings and Average Hours Per Week 6 In some industries, the samples of man-hour data did not meet one or more of the various tests of adequacy as to representative character, and in consequence the computed average hours or average hourly earnings figures, even though published currently in the Bureau's earlier monthly reports, are omitted from the accompanying tables, especial^ in some of the earlier years. As has been pointed out elsewhere, during the earlier years of this series inadequate man-hour coverage in some industries caused considerable variation in the month-to-month industry averages, rendering them noncomparable. The introduction into the sample of new man-hour reports from geographic areas in which wage-and-hour differentials affected the levels of existing averages; the inclusion of data for single large establishments in which levels of hours and earnings differed materially from those of firms already reporting; a refinement in the Bureau's defmi« Revised indexes of employment and pay rolls are available in mimeographed form upon request. They will also be shown in a forthcoming bulletin. 6 Average hours worked per week are computed by dividing the total number of man-hours reported for an industry for the week ending nearest the fifteenth of the month by the total number of employees who worked any part of the same period. Average hourly earnings are obtained by dividing the total pay rolls for the week covered by the corresponding total number of man-hours worked.
Digitized for FRASER http://fraser.stlouisfed.org/ Federal Reserve Bank of St. Louis
SCOPE AND METHODS
43
tion of wage earners which in a few industries resulted in deleting many of the higher-paid employees from the data submitted—all these causes served to impair comparability over the period as a whole. In cases, however, where such discrepancies in the monthly figures did not have an appreciable effect on the annual figures, yearly averages are presented. As explained heretofore, certain of the averages presented for individual industries and groups may differ from previously published figures because of revisions in the basic material. Tables 6 and 8, which show averages by months for 1932, 1933, and 1934, are published as appendix tables since considerable data are not available for the earlier years when man-hour coverage was limited. It should be noted, moreover, that since some reporting firms do, not furnish man-hour data, average hours and average hourly earnings are based on reports from a slightly smaller number of establishments than the average weekly earnings. An average, of course, may represent a wide range of individual observations. In the shoe-pattern branch of the boot and shoe industry, recently surveyed by the Bureau, wage earners averaged 81.5 cents per hour during the first quarter of 1939. Yet, 2.7 percent of these workers earned less than 30 cents per hour. Likewise in the Bureau's 1939 survey of hourly entrance wage rates for common laborers, individual rates varied from 72.5 cents to less than 25 cents per hour in the fertilizer industry and from $1.10 to less than 20 cents in building construction. Wage rates, however, should not be confused with earnings. A wage rate represents a scale of pay for a specified unit of time (or product in the case of piece work). Earnings consist of compensation actually received and are affected by overtime rates, bonuses, deductions, and other factors. Fluctuations in average hourly earnings in an establishment from one period to another may be caused by (1) changes in wage rates, (2) overtime pay, shift premiums, production bonuses, commissions, and similar factors, (3) deductions such as for damaged work, or in mining industries for explosives or other supplies furnished by the company, and (4) changes in the actual composition of the working force such as male or female, skilled or unskilled, etc. Average hourly earnings in an industry group may rise from one month to the next if the number of wage earners employed in a high-wage industry increases proportionally more than employment for the entire group. This increase might take place even though there was no change whatsoever in the rate of pay of any wage earner in any one of the establishments. It is apparent, therefore, that the Bureau's averages reflect not only changes in the individual rates of pay but also various other changes, notably the changes in the composition of the wage earners in the group. 402097°—42
Digitized for FRASER http://fraser.stlouisfed.org/ Federal Reserve Bank of St. Louis
\
44
HOURS AND EARNINGS IN THE UNITED
STATES
Variations from month to month in the average hours of work in a plant may be caused not only by changes in scheduled hours but also by short time, overtime, labor turnover, or the shifting of work from one department to another. The causes of variations in industry averages from month to month have been discussed elsewhere. The average hours worked per week and the average hourly earnings in the accompanying tables for total manufacturing industries and total retail trade are weighted. In the manufacturing series, each of the several groups and the durable- and nondurable-goods groups are also weighted. Group averages for a given month are obtained by multiplying the average hours (or the average hourly earnings) in each industry in the group by the estimated number of employees and dividing the sum of the products by the sum of the employees. Hence, the weights vary from month to month in accordance with changes in the level of employment. The durable- and nondurablegoods group averages are computed by multiplying the component industry group averages by the respective group employment estimates and dividing the sum of the products by the sum of the employment totals. In turn, those for all manufacturing industries combined are computed in like fashion from the weighted durable- and nondurable-goods averages. The retail-trade hours and hourly earnings shown in this bulletin for periods prior to 1939 are the weighted averages of the two main groups shown, namely, general merchandising and retail trade other than general merchandising. As mentioned heretofore, the Bureau has completed the work of compiling the retail-trade employment and pay-roll data by lines of trade, and has made available indexes of employment and pay rolls, but a similar break-down of the manhour sample has not been undertaken for the years 1932 to 1938. The average hours and average hourly earnings for total retail trade for subsequent periods have been weighted, however, by a method similar to that used for manufacturing industries, as described above. So far as possible, a like process will be followed in the weighting of the average hours and average hourly earnings for wholesale trade when the work incident to the construction of indexes for separate wholesale lines is completed. The annual averages for the separate industries are computed from yearly aggregates of employment, pay rolls, and man-hours in the reporting sample and are not the arithmetic means of the 12 monthly averages. For all manufacturing industries combined and for the several industry groups, annual averages are computed not from the reporting samples but from the estimated totals as computed from the indexes of employment and pay rolls. Every effort has been made to exclude nominal man-hour data, derived by multiplying establishment operating time by number of
Digitized for FRASER http://fraser.stlouisfed.org/ Federal Reserve Bank of St. Louis
SCOPE AND METHODS
45
Workers employed. The average hours-per-week data as used in this bulletin are the averages worked by all employees in reporting establishments, including part-time and overtime, and are not to be confused with "normal" hours, shifts, or hours of operation. Average Weekly Earnings The average weekly earnings shown in tables 5 to 8 were obtained by dividing the total weekly pay rolls reported by cooperating establishments by the total number of wage earners who worked in these establishments during any part of the pay period ending nearest the 15th of the month. They relate, therefore, to the earnings of fulltime, part-time, and overtime workers combined and cannot be considered as representing full-time or straight-time earnings of employees in any industry. These average weekly earnings may differ from the weekly earnings obtained by multiplying the average hours worked per week by the average hourly earnings as stated elsewhere, because not all of the firms which report employment and pay-roll figures, from which the average weekly earnings are computed, supply man-hour data. In addition, average weekly earnings as computed from the comparatively large employment and pay-roll samples may be affected by bonuses, vacation pay, or other forms of income not reported in such way as to have equivalent effect on average weekly earnings as computed by multiplying average weekly hours by average hourly earnings. The annual average weekly earnings are not the arithmetic means of the 12 monthly averages but are averages derived by dividing the sum of the total weekly pay rolls reported by cooperating firms for the 12 months of a given year by the total number of employees reported by these firms. The average weekly earnings for all manufacturing industries combined, for the several manufacturing groups, and for total retail trade, unlike the average hours and average hourly earnings, are not weighted. As an exception to the usual procedure, the average weekly earniings for sawmills, soap, and fertilizers, which had special handling as described elsewhere, have been obtained by multiplying the weighted ;average hourly earnings by the weighted average hours. The respective group averages in which these industries appear have been adjusted accordingly. In private building construction, although average weekly earnings for the years 1932 and 1933 were published in monthly issues of the Employment and Pay Rolls pamphlet and in the Monthly Labor Review, they are not shown in tables 6 and 8 because of noncomparability with the weekly averages for later years.
Digitized for FRASER http://fraser.stlouisfed.org/ Federal Reserve Bank of St. Louis
46
HOURS AND EARNINGS IN THE UNITED STATES
Fluctuations in average weekly earnings, as in average hourly earnings, may result from a number of causes, such as changes in wage scales, changes in hours, bonuses, commissions or deductions, and changes in the composition of the working force. The fluctuations of weekly earnings in dollars and cents without reference to the cost of living do not give a complete picture of the wage earner's economic status. Changes in the purchasing power of earnings may be shown approximately by reducing earnings to index form and dividing this index by the index of the cost of living.7 Recent trends in real earnings have been discussed in other articles in the Monthly Labor Review.8 i For the Bureau's cost-of-living index, June 1933 to March 1940, see Monthly Labor Review, July 1940, p. 145. 8 For comparison of real earnings between 1929 and 1939, see Wages, Hours, and Productivity of Industrial Labor, 1909 to 1939, Monthly Labor Review, September 1940 (reprinted as Serial No. R. 1150).
Digitized for FRASER http://fraser.stlouisfed.org/ Federal Reserve Bank of St. Louis
Chapter III General Tables Tables 5 and 6 following show average hours worked per week, average hourly earnings, and average weekly earnings in manufacturing and nonmanufacturing industries respectively, by years from 1932 to 1940, and by months from January 1935 to December 1940. These tables represent in general a recapitulation of the averages published monthly since 1932 in the Monthly Labor Review, the Employment and Pay Bolls pamphlet, and more recently in mimeographed releases showing data by years from 1932 to 1939 and by months from January 1938 to August 1940. The averages presented for some of the individual industries and groups may differ from previously published figures because of revisions in the basic materials, as explained in chapter II, " Scope and Methods." Monthly averages for the years 1932, 1933, and 1934 for those industries and groups in which man-hour data were considered adequate to indicate monthly movements are published as separate tables (tables 7 and 8) in appendix A. It will be noted that considerable data are not available for these earlier years when many firms did not keep man-hour records. An analysis of sample coverage by industry for the years 1932, 1934, and 1940 will be found in table 4 on page 35. Average hours and average hourly earnings are computed from figures furnished by establishments reporting man-hour information, whereas average weekly earnings are based on the reports received from all cooperating establishments. As all firms do not supply man-hour figures, the results obtained by multiplying average weekly hours by average hourly earnings derived from the man-hour sample do not necessarily produce the average weekly earnings obtained by dividing total weekly pay rolls for the more complete sample by number of workers employed. Although the averages are not strictly comparable from month to month because of changes in the size and composition of the reporting sample, the variations in the averages due to such changes are relatively unimportant.
Digitized for FRASER http://fraser.stlouisfed.org/ Federal Reserve Bank of St. Louis
47
48
HOURS AND EARNINGS IN THE UNITED STATES
5.—Average hours worked -per week, average hourly earnings, and average weekly earnings in manufacturing industries, by years, 1932 to 1940, and by months, January 1935 to December 1940 1
TABLE
Total manufacturing Year and month
1932. 1933 1934. 1935. 1936 1937. 1938. 19391940.
Durable-goods group
Nondurable-goods group
Average Average Average Average Average Average Average Average Average hours hours. hours hourly weekly hourly weekly worked hourly weekly worked earnings worked earnings per week earnings earnings per week earnings earnings per week
____ —
38.2 37.8 34.5 36.5 39.1 38.6 35.5 37.6 38.1
Cents
45.8 $17. 86 45.5 17. 36 54.1 18. 93 55.9 20.85 56.4 22. 60 63.4 24.95 63.9 22. 70 64.4 24. 58 67.0 26.11
32.5 34. 7 33.7 37.1 40.8 39.8 34.8 37.8 39.2
35.0 36.3 36. 4 36.1 35.5 35.3 35.2 36.6 37.4 38.1 37.6 38.5
55.7 55.9 56.1 56.2 56.2 56.5 55.9 55.8 55.3 55.5 55.7 56.2
19. 83 20. 76 20. 90 20. 96 20. 55 20. 32 19. 91 20. 64 20.93 21. 43 21.59 22.10
37.3 37.3 38.5 38.6 39.1 39.1 38.5 39.5 38.8 40.5 40.5 41.1
56.3 56.1 56.2 56.3 56.3 56.3 56.2 56.0 55.7 56.2 56.9 58.3
39.6 40.5 41.0 40.4 39.7 39.2 38.0 38.7 37.5 37.6 35.4 34.5 33.3 34.4 34.7 34.3 34.5 34.5 35.0 36.5 37.1 37.6 36.6 37.3
Cents
Cents
50.8 48.5 56. 7 58.7 59.7 68.6 69.8 71.0 73.4
$17. 66 17.80 19.81 22. 72 25. 24 28. 09 24. 77 27.83 29.88
41.9 39.7 35.1 36.1 37.7 37.4 36.1 37.4 37.0
34.5 36.6 36.8 37.0 36.0 35.5 34.8 36.9 38.0 39.3 39.1 39.7
58.3 58.4 58.7 58.8 58.7 59.2 58.7 58.5 58.1 58.4 58.9 59.2
20.99 22. 62 22. 70 22. 92 22. 29 21.90 21. 21 22. 21 22. 72 23. 66 24.19 24. 52
35.4 36.0 36.1 35.5 35.1 35.0 35.5 36.4 37.0 37. 2 36.4 37.5
53.8 54.0 54. 2 54.2 54.3 54.4 53.8 53.8 53.2 53.2 53.2 53.7
18.87 19.14 19. 33 19. 21 18.94 18. 89 18. 74 19. 26 19. 43 19. 46 19.15 19. 85
21. 40 21. 21 21.99 22. 44 22. 72 22.70 22.19 22. 46 21.97 23. 20 23. 69 24. 65
37.9 37.8 39.7 40.8 41.4 41.3 39.8 40.8 40.5 42. 7 42.8 42.9
59.3 59.1 59.3 59.6 59.5 59.5 59.4 59.0 58.8 59.4 60.4 62.3
23. 34 22. 80 24. 30 25.42 25. 69 25. 56 24. 58 24. 76 24. 46 26.13 26. 83 27. 79
36.8 37.0 37.5 36.8 37.1 37.2 37.3 38. 5 37.5 38.7 38.5 39.5
53.8 53. 7 53.6 53. 5 53.6 53.6 53.6 53.6 53.2 53.6 53.8 54.8
19. 58 19. 95 19. 84 19. 58 19. 79 19.87 19. 87 20. 36 19. 71 20. 39 20.53 21.42
58.7 59.2 60.4 62.9 64.0 64.4 64.8 64.8 64. 7 65.5 65.6 65.6
23. 83 24. 54 25. 35 26.12 26. 22 25. 80 25. 16 25. 64 24. 73 25.17 23. 66 22. 68
40. 7 41.9 42.5 42.1 41.4 40.8 38.7 40.2 38.8 39.1 36.2 34.2
62.3 63.1 65.1 68.6 69.6 69.6 70.5 70.3 70.3 71.0 71.3 71.0
26. 33 27. 35 28. 62 29. 87 29. 90 29.19 28. 23 29.10 28. 01 28. 61 26. 47 24. 59
38.7 39.3 39.6 38. 7 38.2 37.7 37.3 37.3 36.3 36.2 34.7 34.7
55.5 55. 7 56.2 57.5 58.7 59.4 59.5 59.6 59.6 60.3 60.2 60. 7
21. 29 21.67 21.96 22.12 22.16 22.13 21.80 21.98 21.28 21.36 20. 52 20. 69
65.2 64.7 64. 5 64.2 64.0 63.8 63.1 62.5 62.6 63.4 63.9 64.2
21.66 22. 07 22. 23 22. 05 21.92 22. 07 21.95 22. 83 23. 24 23. 90 23. 77 24. 26
32.2 33.0 33.6 33.5 33.8 33.9 33.4 35.8 36.4 37.5 36.7
70.5 70.2 70.2 70.1 69.9 69.6 •68.8 68.5 69.0 69.6 70.6 70.9
22.90 23. 42 23. 69 23. 80 23. 93 23. 86 23. 32 24. 84 25. 65 26. 86 27. 02 27. 27
34.3 35.5 35.6 35.0 35.1 35.0 36.1 37.0 37.6 37.6 36.5 37.5
60.9 60.3 60.1 59.6 59.5 59.4 59.0 58. 5 58.2 58. 7 58.6 58,9 ,
20. 47 20. 83 20. 92 20. 49 20.11 20. 51 20. 84 21. 24 21. 32 21. 34 20.84 21.52
42.7 $18. 01 43. 7 17.04 52.3 18. 23 19. 20 53.8 20. 09 53.7 58.5 21. 60 59.3 20. 89 59.1 21. 54 22. 03 61.2
1935 January February March... April May. June.
__
July.... August.. September.. October November December 1936 January February March April May June July.... August... September October November December 1937 January February March.. April May June July. August September October November. December 1938 January February March April May June. July... August September. October November December
See footnotes at end of table,
Digitized for FRASER http://fraser.stlouisfed.org/ Federal Reserve Bank of St. Louis
37.1
GENERAL TABLES
49
5.—Average hours worked per week, average hourly earnings, and average weekly earnings in manufacturing industries, by years, 1982 to 1940, and by months, January 1935 to December 19401—Continued
TABLE
Total manufacturing Year and month
Durable-goods group
Nondurable-goods group
Average Average Average Average Average Average Average Average hours Average hours hours weekly hourly hourly weekly hourly weekly worked earnings worked earnings earnings worked earnings earnings earnings per week per week per week
1939 January February March. April May... June
36.6 37.1 37.3 36.6 36.8 37.3
Cents 64.4 64.3 64.5 64.2 64.3 64.2
July August September. October November December
36.7 38.0 38.0 39.1 38.5 38.6
63.7 63.4 63.8 64.6 65.3 66.2
23. 24. 24. 25. 25. 26.
37.4 37.3 37.5 37.2 37.2 37.5 37.3 38.4 38.8 39.3 38.6 39.8
36.1 36.6 36.8 36.6 36.9 37.4
Cents 71.0 70.9 71.1 71.0 70. 7 70.8
64 52 70 81 73 26
36.2 38.4 38.2 40.1 39.6 39.6
66.3 66.3 66.5 66.5 66.9 67.2
25. 51 25. 20 25. 46 25. 33 25. 43 25.79
66.7 66.8 67.1 67.3 67.8 68.3
25. 25 26. 10 26. 54 27.13 26.93 27.89
$23.80 24. 01 24.18 23. 79 23. 84 24.17
53 78 02 92 82 26
37.0 37.5 37.7 36.6 36.7 37.2
Cents 59.2 59.1 59.1 58.8 59.2 59.0
$21.29 21. 47 21. 58 20.89 21.09 21.31
70.2 69.9 70.9 71.3 71.5 72.7
26. 31 27.92 28.15 29. 71 29.41 30.04
37.1 37.8 37.8 38.2 37.6 37.7
58.7 58.5 58.3 59.0 59.9 60.5
21. 25 21. 58 21.54 22.02 22.03 22.03
38.1 37.9 38.3 38.2 38.2 38.7
72.7 72.6 72.8 72.9 73.0 73.2
28. 96 28. 60 28.90 28. 92 28.80 29. 48
36.9 36.8 36.9 36.2 36.3 36.4
60.7 60.8 61.0 60.9 61.5 61.7
21. 87 21. 73 21. 86 21.49 21. 72 21. 81
37.9 39.7 40.2 41.0 40.2 41.2
72.7 73.1 73.7 73.9 74.4 74.9
28. 52 29.98 30. 57 31. 42 31.11 31.96
36.7 37.2 37.5 37.6 37.1 38.4
61.5 61.3 61.1 60.9 61.3 61.7
21. 87 22.10 22. 20 22. 28 22.08 23.09
$26. 26. 27. 26. 26. 27.
1940 January February March. April. May__ June July August. September October November December __
_ _
-
See footnotes at end of table.
Digitized for FRASER http://fraser.stlouisfed.org/ Federal Reserve Bank of St. Louis
50
HOURS AND EARNINGS IN THE UNITED STATES
5.—Average hours worked per week, average hourly earnings, and average weekly earnings in manufacturing industries, by years, to 1940, and months, January 1935 to December 19401—Continued
TABLE
Iron and steel and their products, not including machinery Blast furnaces, steel works, and rolling mills
"Iron and steel' group Year and month
Bolts, nuts, washers, and rivets
Average Average Average Average Average Average Average Average Average hours hours hours hourly weekly hourly weekly hourly weekly worked earnings earnings worked earnings earnings worked earnings earnings per week per week per week
1932 1933 1934 1935 1936
30.0 33.8 32.3 36.0 40.8
Cents 50.6 50.3 59.1 61.2 62.0
1937 1938 1939 194fr:
39.1 31.5 36.8 38.1
73.7 75.3 75.9 77.3
28. 23. 28. 29.
33.6 36.1 35.9 35.7 35.1 34.0
26.1 32.5 30.5 34.9 40.9
Cents 52.7 53.1 63.2 66.4 67.1
$13.91 17.27 19. 25 23.12 27. 37
32.8 37.1 41.9
54.1 56.9 57.5
$15.54 16.91 17.82 21.12 24. 08
92 37 00 57
38.7 28.7 35.5 37.3
81.8 83.5 84.3 84.8
31.46 23. 78 29. 92 31. 54
39.5 30.5 37.7 39.5
65.4 70.2 69.0 69.6
25. 79 21.42 26. 04 27. 50
61.1 61.4 61.4 61.5 61.2 61.1
20. 37 22. 21 22.12 21.96 21.56 20. 78
32.2 35.9 35.2 34.7 34.2 32.4
66.4 66.8 66.8 66.7 66.3 66.2
21.19 23. 81 23. 45 23. 05 22. 65 21.39
34.8 37.1 38.8 38.6 37.5 33.7
56.1 55.5 56.6 56.8 56.7 57.3
19. 51 20. 54 21.97 21.92 21.24 19.48
32.4 35.9 37.0 38.1 37.6 39.5
60.8 60.9 61.1 61.0 61.2 61.5
19. 72 21.98 22. 80 23. 34 23.13 24. 47
30.2 34.9 36.0 36.5 36.4 38.9
65.7 66.0 66.2 66.3 66.3 66.7
19. 96 23.05 23. 80 24.15 24.10 25. 89
32.6 36.2 36.6 39.3 37.9 41.4
57.5 57.2 57.5 57.1 57.0 57.3
18. 81 20. 72 21.04 22. 38 21.62 23. 73
37.3 37.9 39.9 41.0 41.5 41.4
61.2 60.9 61.4 61.4 61.3 61.7
23. 23. 24. 25. 25. 25.
09 33 74 49 80 95
36.9 37.5 39.8 41.4 41.9 41.7
66.1 65.7 66.2 66.3 66.2 66.7
24. 24. 26. 27. 27. 27.
39 60 38 47 75 86
40.4 39.3 40.0 43.0 42.7 41.0
57.1 56.9 57.0 57.3 56.7 56.6
23. 06 22. 34 22. 85 24. 65 24. 21 23.24
39.1 40.7 40.3 42.8 43.3 43.6
61.8 61.9 61.6 61.8 62.6 66.2
24. 55 25. 50 25.13 26. 48 27. 23 28. 97
39.2 40.9 40.8 42.2 43.5 43.5
66.9 66.8 66.1 66.4 67.3 73.0
26. 40 27.31 26.90 27. 91 29.04 31.41
39.7 40.9 40.5 44.3 44.2 45.4
56.9 57.7 57.8 57.7 57.5 60.2
22. 75 23. 59 23. 34 25. 53 25. 41 27.24
January. February March April May June
41.9 42.2 43.1 42.4 41.3 40.1
66.2 66.4 68.1 74.8 76.5 75.1
28. 28. 29. 32. 32. 30.
21 43 67 22 04 64
42.7 42.9 43.5 42.6 41.3 40.2
72.6 72. 7 74.8 85.0 86.6 85.4
30. 95 31.16 32. 29 36. 07 35.61 34. 32
43.2 45.4 44.9 43.3 41.6 39.8
60.6 61.0 61.9 66.5 66.4 65.2
26.12 27.66 27. 79 28. 76 27. 56 25.96
July August September October... November December
38.1 39.9 37.8 37.2 32.8 30.3
76.6 76.8 76.1 76.1 75.6 75.5
29. 62 31.09 28. 99 28. 16 24. 37 22. 28
38.1 40.5 37.5 35.7 30.7 27.3
85.8 85.7 84.2 83.7 82.8 82.8
32. 57 34. 56 31.48 29. 73 25. 01 22.18
36.4 39.6 37.6 38.2 32.3 29.7
66.8 67.3 67.3 68.0 68.8 68.9
24. 29 26.48 25. 21 25. 94 22.16 20. 39
$15.20 17. 03 18. 96 22.10 25.61
Cents
1985 January February-. March April May June July August September October November December
_ __
1936 January February March, April May June
-
July August September.. October November _ _ December. 1937
See footnotes at end of table.
Digitized for FRASER http://fraser.stlouisfed.org/ Federal Reserve Bank of St. Louis
GENERAL TABLES
51
5.—Average hours worked per week, average hourly earnings, and average weekly earnings in manufacturing industries, by years, 1932 to 19 40, and by months, January 1935 to December 1940 1 —Continued
TABLE
Iron and steel and their products, not including machinery "Iron and steel" group Year and month
Blast furnaces, steel works, and rolling mills
Bolts, nuts, washers, and rivets
Average Average Average Average Average Average Average hours Average Average hours hours weekly weekly hourly weekly hourly hourly worked worked earnings earnings worked earnings earnings earnings per week per week earnings per week 1938 27.9 29.2 30.0 30.1 30.4 29.8
Cents 74.8 75.2 75.1 75.3 75.5 75.6
$20.36 21.41 21.96 22.28 22. 54 21.99
24.9 26.4 27.1 27.6 27.6 26.5
Cents 81.8 82.6 82.6 83.2 83.7 84.1
$19. 93 21.39 22. 00 22. 65 22. 82 21.97
25.3 27.0 27.3 27.1 29.2 28.3
Cents 69.7 70.2 70.7 70.5 70.5 71.1
$17.62 18.94 19. 34 19.11 20. 56 20.16
29.4 32.2 32.9 34.8 35.1 35.6
75.5 75.1 75.2 75.3 75.7 75.7
21.51 23. 90 24.40 25. 94 27. 64 26.91
25.8 29.2 29.7 31.9 33.6 33.8
84.0 83.3 83.8 S3. 9 84.2 84.2
21.51 24. 35 24.92 26. 79 28. 48 28. 49
27.3 30.7 32.5 35.0 37. 1 38.0
70.9 70.7 70.5 69.9 69.5 69.6
19. 37 21.68 22. 82 24. 42 25. 69 26. 36
34.8 35.4 35.8 35.1 34.9 35.6
75.5 75.3 75.2 75.2 75.2 75.6
26. 37 26. 70 27. 01 26. 46 26.17 26. 89
33.7 34.0 34.4 33.6 32.8 33.6
83.5 83.5 83.5 83.5 83.5 84.2
28.18 28. 47 28. 81 28. 07 27. 40 28. 30
36.1 37.9 36.9 33.5 33.7 34.0
69.7 69.6 69.5 69.4 69.6 69.5
25.11 26. 33 25. 64 23. 26 23. 46 23. 59
34.2 37.0 37.0 40.3 39.6 39.4
75.9 75.7 76.1 76.4 76.7 77.2
25. 81 28.17 28. 25 31.09 30. 55 30. 71
32.1 35.7 35.2 40.0 39.2 39.0
84.9 84.3 84.5 84.8 84.7 85.1
27.12 30.13 29. 77 33. 91 33. 08 33.19
31.8 38.0 39.2 42.8 43.0 42.3
68.5 68.9 68.7 68.9 68.2 68.3
21.79 26.17 26. 90 29. 56 29. 32 28.91
January February March April May.. June
37.6 36.5 36.1 36.0 36.6 37.6
76.6 76.4 76.3 76.4 76.7 77.4
29. 07 27. 95 27. 47 27. 50 28.16 29.30
37.1 35.4 34.7 34.4 35.5 37.1
84.1 83.8 83.8 83.8 84.2 84.9
31.25 29. 69 28. 88 28. 73 29. 87 31.53
37.4 39.0 37.2 37.0 36.5 37.3
68.4 68.2 68.3 68.4 68.7 69.1
25. 61 26. 54 25. 40 25.31 25. 07 25. 79
July August. September October. November. December
37.2 38.8 39.2 39.9 39.6 41.0
77.7 77.7 77.9 77.8 78.1 78.0
28. 89 30.24 30. 60 30. 97 31.01 32.18
36.4 38.1 38.4 38.8 39.1 40.4
84.7 84.8 85.4 85.1 85.7 85.8
30. 32. 32. 33. 33. 34.
35.4 41.5 40.9 42.4 42.4 44.4
69.5 70.0 69.4 70.0 71.5 71.7
24. 60 29.02 28. 38 29.68 30. 30 31.82
January February March April May June
__
July August September October November December 1939 January. February March April May... June July August September. October November December
_. . _.
mo
See footnotes at end of table.
Digitized for FRASER http://fraser.stlouisfed.org/ Federal Reserve Bank of St. Louis
75 25 77 04 43 65
52
HOURS AND EARNINGS IN THE UNITED
STATES
Average hours worked per week, average hourly earnings, and average weekly earnings in manufacturing industries, by years, 1982 to 1940, and by months, January 1985 to December 1940 1—Continued
TABLE 5 . —
Iron and steel and their products, not including machinery--ContinuedCutlery (not including silver and plated cutlery) and edge tools
Cast-iron pipe Year and month
Forgings—iron and steel
Average Average Average Average Average Average Average Average Average hours hours hours weekly hourly hourly weekly hourly weekly worked earnings earnings worked earnings earnings worked earnings earnings per week per week per week
32.5 29.7 29.7 31.0 38.2
Cents 44.4 45.3 48.9 49.0 49.3
$14.21 13. 33 14. 57 15. 40 18. 99
35.8 37.8 41.0
37.8 32.8 36.4 37.2
55.5 57.7 58.1 60.1
21.17 19.15 21. 33 22. 51
28.9 28.9 28.3 30.3 30.8 31.1
49.2 49.3 48.5 49.3 49.0 48.9
30.4 31.5 32.0 31.3 32.4 35.5
January.. February March April May June.. July. August September October. November December.
3932 1933 1934 1935 1936
Cents
Cents
51.9 53.5 52.6
$18. 67 17.53 18. 66 20. 30 21.53
38.5 41.7
61.5 62.7
$16.06 17.28 20. 46 23. 62 26.11
41.2 35.7 39.1 39.5
59.0 61.3 60.1 62.2
23. 81 21.36 23.11 24.19
40.9 32.3 38.4 41.2
71.1 74.4 76.7 79.1
28. 84 23. 97 29. 45 32.56
14.78 14. 39 13. 91 15.09 15. 26 15. 42
36.1 37.7 37.3 36.2 36.4 36.8
53.5 53.8 53.9 54.2 54.3 53.7
19. 34 20.37 20.18 19. 63 19.83 19. 92
37.6 40.3 39.7 38.9 37.3 34.4
60.5 60.5 61.4 61.7 62.3 61.9
22.49 24. 27 24. 39 24.00 23. 41 21. 25
49.0 49.5 48.7 48.9 49.1 48.7
15.08 15.81 15.80 15. 49 16. 09 17.46
35.9 37.1 38.0 39.9 40.5 41.4
54.7 52.8 52.7 52.1 52.8 54.2
19. 71 19. 66 20.11 20. 92 21.34 22. 39
33.2 37.9 38.5 39.2 40.2 42.1
61.3 62.5 62.0 61.5 61.5 61.7
19. 85 23. 59 23. 85 24.15 24. 71 25. 97
34.1 34.5 35.6 36.4 39.5 39.4
49.2 49.6 48.8 48.8 48.2 48.4
16. 96 17. 31 17. 50 18.16 19. 34 19. 26
38.6 39.0 38.6 39.7 38.8 40.4
52.6 51.9 51.5 52.4 52.9 53.0
20. 26 20.28 19.88 20.70 20.39 21.23
39.5 40.8 41.8 41.8 41.9 41.1
62.1 61.8 62.3 62.5 61.7 61.5
24. 48 25.22 26. 05 26. 15 25. 89 25.30
39.1 39.6 37.2 40.0 39.6 41.3
48.4 48.6 49.4 49.7 49.7 51.1
18. 97 19. 59 18. 54 20.17 19. 92 21. 33
38.2 41.0 40.8 44.6 45.4 45.8
53.2 52.8 52.9 52.3 52.3 53.6
20.37 21.54 21.52 23. 27 23. 75 24.18
38.8 40.0 38.7 42.1 44.5 47.3
61.7 63.1 62.9 62.7 63.6 65.2
23.98 25.16 24. 33 26. 35 28. 21 30.79
January. February March-. April. May June
38.7 40.1 40.9 41.6 41.0 39.6
51.1 51.0 52.0 55.3 56.6 57.0
20. 03 20. 69 21.63 23. 28 23. 47 22. 73
42.6 42.4 43.3 42.6 42.6 42.9
55.3 55.6 56.5 58.2 59.1 60.1
23.24 23.31 23. 89 24. 21 24. 60 25.22
43.8 44.6 44.9 44.4 42.9 42.0
67.3 67.3 68.9 70.7 71.7 72.3
28.74 29.39 30. 37 31.29 30.71 30.25
July. August. September. October November December
36.5 37.2 35.2 34.4 33.5 33.7
56.8 56.9 56.8 57.7 58.5 58.1
20. 85 21.28 20.15 19. 98 19. 68 19. 65
39.6 40.9 40.7 40.4 38.9 37.5
60.1 60.1 61.0 60.6 60.2 61.2
23.44 24.09 24. 32 24.06 22.94 22.32
38.3 39.8 39.7 39.5 35.6 33.7
70.7 72.2 73.9 73.3 74.1 73.3
27.00 28. 53 29.14 28.79 26.28 24.64
-
1937 1938. 1939. 1940-
1935
January February March April May June
__
July August September.. October.. November. December 1986
1937
See footnotes at end of table.
Digitized for FRASER http://fraser.stlouisfed.org/ Federal Reserve Bank of St. Louis
GENERAL TABLES
53
5,—Average hours worked per week, average hourly earnings, and average weekly earnings in manufacturing industries, by years, 1982 to 1940, and by months, January 1935 to December 1940 1 —Continued
TABLE
Iron and steel and their products, not including machinery—Continued Cutlery (not including silver and plated cutlery) and edge tools
Cast-iron pipe Year and month
Forgings—iron and steel
Average Average Average Average Average Average Average Average Average hours hours hours weekly hourly weekly hourly weekly worked hourly worked worked earnings earnings per week earnings earnings earnings earnings per week per week 1988 February March April May
29.3 29.5 31.9 32.5 32.7 32.7
Cents 58.5 57.3 57.9 57.6 57.5 57.6
$17.37 17.24 18.80 19. 03 19.06 19.11
33.6 34.2 35. 2 33.4 33.9 33.6
Cents 62.5 61.5 61.6 61.6 62.1 62.8
$20. 27 20. 38 20. 96 20.04 20. 28 20. 51
28.6 29.2 30.7 30.0 29.6 28.9
Cents 74.7 74.2 73.8 73.3 73.9 73.8
$21. 22 21.58 22. 59 21.96 21.82 21.36
July August September October November December
34.4 34.3 34.2 34.1 33.9 34.0
57.9 57.8 57.4 56.9 58.0 58.4
20. 02 20.00 19. 77 19. 54 19.71 20.01
33.6 34.6 36.9 39.3 39.0 39.8
62.5 60.8 60.1 59.7 60.2 61.0
20. 59 20. 63 21.88 23. 22 23.11 24.06
29.5 33.0 34.5 36.3 36.3 38.4
74.8 74.1 73.9 74.3 74.9 76.2
22.06 24. 48 25. 45 26. 94 27.18 29.25
January February March April May June
32.5 34.3 33.7 35.4 38.2 37.2
58.3 57.8 58.0 58.2 58.1 58.0
19.15 20.06 19.80 20.71 22. 32 21.73
38.1 38.3 38.7 37.6 38.1 38.8
60.9 59.9 60.0 59.8 60.4 61.4
22. 95 22. 65 22. 94 22.17 22. 65 23. 56
36.3 37.4 37.3 36.8 36.7 36.5
76.3 76.0 75.2 76.0 77.0 76.6
27. 74 28. 48 28.10 28. 05 28.17 27. 95
July August September October November December
36.6 37.4 34.9 38.5 39.4 37.9
57.8 58.0 57.9 58.3 58.3 58.7
21.28 21.81 20.48 22. 60 23.12 22. 43
37.6 38.1 39.3 41.0 41.3 41.3
61.2 59.8 59. 0 58.8 59.8 60.2
22.66 22. 34 22. 72 23. 54 24. 22 24. 46
36.2 38.3 38.4 40.4 41.8 42.1
75.8 76.0 75.8 77.4 78.1 78.6
27. 43 29.10 29.15 31.24 32. 59 33.05
35.1 2 35.5 31.4 33.0 34.6 35.9
59. 8 2 59.5 59.9 60.1 60.3 60.5
21.14 2 21. 30 18. 98 19. 96 21.00 21.80
38.8 38.3 38.5 38.9 38.7 38.4
60.5 60.5 60.6 61.4 61.4 62.3
23.12 22. 74 22. 92 23. 47 23. 40 23. 63
41.3 40.8 39.7 39.3 38.5 39.1
78.2 78.2 77.6 78.0 77.7 78.1
32. 27 31.86 30. 79 30. 60 29. 90 30.48
37.9 37.9 38.3 39.8 40.6 43.0
60.3 59.4 59.7 60.2 60.3 61.3
22. 97 22. 72 23. 02 24.10 24. 57 26. 44
38.6 38.8 40.2 40.9 40.4 42.2
62.4 62.6 62.4 62.2 63.5 65.3
23.81 23.91 24. 65 25. 02 25.13 27.11
39.4 40.6 3 41.4 43.1 42.6 45.0
79.1 79.3 3 78.4 79.7 80.7 80.8
31.09 32. 22 32. 51 34.30 34. 35 36.28
1939
mo January February March April May June — July August September October November December
-
See footnotes at end of table.
Digitized for FRASER http://fraser.stlouisfed.org/ Federal Reserve Bank of St. Louis
54
HOURS AND EARNINGS IN THE UNITED STATES
5.—Average hours worked per week, average hourly earnings, and average weekly earnings in manufacturing industries, by years, 1932 to 1940, and by months, January 1935 to December 1940 1 —Continued
TABLE
Iron and steel and their products, not including machinery--Continued Hardware
Plumbers' supplies
Stamped and enameled ware
Year and month Average
Average Average Average Average Average Average Average Average hourly weekly hourly weekly hourly weekly worked earnings earnings worked earnings earnings worked earnings earnings per week per week per week
1932 1933 1934 1935 1936
31.4 35.2 33.1 37.1 41.0
Cents 50.6 46.5 53 8 54.9 56.2
$14.98 15. 61 17.74 20.27 22.90
30.6 37.4 39.0
1937 1938 1939 1940
38.5 33.6 38.1 39.0
64.1 66.2 66.8 68.3
24. 69 22. 25 25. 47 26.64
34.4 37.2 35.9 36.0 34.8 36.0
54.5 55.2 54.8 54.8 54.5 54.9
35.0 35.5 37.7 39.6 41.0 41.7
Cents
Cents
54.1 55.6 57.0
$15. 66 15. 73 16. 65 20.74 22. 23
35.2 37.4 40.0
52.7 53.4 55.8
$16.85 15 gg 18.' 56 19. 97 22. 44
38.9 33.4 38.2 38.9
63.4 66.6 67.6 69.1
24. 70 22. 28 25. 80 26.83
38.8 35.9 38.1 39.1
62.5 62.9 62.7 65.2
24. 29 22. 65 23.92 25. 51
18.74 20.42 19.61 19. 69 18. 65 19. 59
36.2 36.3 36.9 37.3 36.5 36.0
54.7 55.2 55.2 55.5 55.8 55.6
19. 75 20. 01 20. 35 20. 68 20. 33 19.93
35.3 37.9 38.4 37.6 36.4 34.2
53.5 52.6 52.7 53.1 52.9 52.7
18. 97 19. 92 20.22 19.96 19. 24 18.06
54.6 54.1 54.9 55.2 55.8 55.7
18. 87 19.14 20. 63 21. 80 22. 71 23.08
35.6 38.2 38.5 39.6 37.4 38.7
55.3 55.1 56.0 55.9 55.9 56.2
19. 34 21.03 21.58 22.13 20.95 21.74
32.8 36.7 38.2 40.2 39.4 40.8
53.4 53.5 53.9 53.7 53.8 54.4
17.61 19. 65 20. 54 21. 46 21.17 22.14
39.2 38.0 39.1 39.9 41.0 40.9
54.7 54.1 54.7 55.6 55.8 56.1
21. 27 20.47 21.27 22. 03 22. 77 22.80
35.9 38.3 39.2 37.6 39.7 40.1
56.0 56.5 57.4 57.0 57.4 56.7
20.15 21.67 22. 50 21. 45 22. 77 22. 75
37.2 38.2 40.9 41.0 40.5 40.1
54.2 53.5 54.5 54.6 54.4 54.8
20.19 20.60 22.24 22. 40 22.09 21.88
37.8 39.1 39.4 44.6 44.8 46.2
55.6 54.7 55.2 55.8 59.3 60.3
21.04 21. 28 21.68 24. 76 26. 20 27.43
36.4 38.9 38.0 41.5 39.1 42.8
55.6 56.3 57.1 58.0 57.8 57.9
20. 24 21.94 21. 73 23.89 22.61 24.78
37.2 39.9 38.2 43.4 42.8 43.2
55.8 55.5 55.6 56.9 57.1 57.0
20.88 22.16 21. 46 24.79 24.63 24.68
41.6 37.6 43.3 42.4 41.5 36.1
55.5 55.8 61.1 61.1 65.0 62.4
22.98 20.97 26. 31 25.79 26.96 22. 53
40.6 40.1 43.3 41.2 40.5 40.7
57.9 59.0 60.6 61.8 63.2 63.7
23. 50 23. 49 26. 24 25. 64 25.59 25.96
40.5 41.5 41.2 40.8 39.5 38.7
58.3 57.9 57.9 60.1 62.5 62.9
23. 70 23.99 23.96 24.53 24.69 24.30
38.0 38.6 36.5 39.3 35.4 32.2
68.8 67.5 67.2 69.3 69.4 67.2
26. 26. 24. 27. 24. 21.
38.4 39.7 37.0 39.0 33.6 32.3
64.3 65.5 65.9 66.4 66.8 67.9
24. 69 25.98 24. 40 25.83 22.45 21.96
36.3 38.9 37.3 38.8 36.6 34.6
64.4 65.0 64.8 65.5 66.8 66.4
23.43 25. 21 24. 22 25. 58 24. 54 23.14
1935 January February March April.., May June. July August September. October... November December
_
_
1936 January.. February March April May June July August. September. October November _ December
_
...
1937 January February March April May June
...
July August... September__ __ ___ October November. December
See footnotes at end of table.
Digitized for FRASER http://fraser.stlouisfed.org/ Federal Reserve Bank of St. Louis
09 02 58 26 55 63
GENERAL TABLES
55
5.—Average hours worked per week, average hourly earnings, and average weekly earnings in manufacturing industries, by years, 1932 to 1940, and &?/ months, January 1935 to December 1940 1 —Continued
TABLE
Iron and steel and their products, not including m a c h i n e r y --Continued Plumbers' supplies
Hardware
Stamped and enameled ware
Year and month Average Average Average Average Average Average Average Average Average hours hours hours weekly hourly hourly hourly weekly weekly worked earnings earnings worked earnings earnings worked earnings earnings per week per week per week 1938 27.4 30.1 29.9 30.0 31.4 31.8
Cents 65.1 66.6 65.1 64.6 64.9 65.3
$17.94 20.07 19. 47 19.42 20. 37 20. 77
32.3 30.8 31.3 32.1 34.7 34.1
Cents 66.5 67.0 67.1 67.5 67.0 66.0
$21.45 20. 61 21.06 21.66 23. 28 22.55
31.8 34.2 35.5 35.3 33.9 33.8
Cents 64.6 63.0 63.4 63.0 62.9 62.7
$20. 64 21.54 22. 45 22.26 21. 45 21. 35
31.8 35.2 36.3 38.8 39.0 38.0
65.2 65.7 65.8 68.0 68.9 66.7
20.77 23.06 23. 86 26. 32 26. 79 25.31
33.0 34.0 35.0 36.1 32.0 35.7
65.6 65.8 66.3 66.7 66.6 66.8
21.70 22. 38 23. 21 24.14 21.34 23. 83
34.0 37.0 37.9 39.7 38.1 38.5
61.8 62.7 62.6 62.7 63.0 62.9
21.14 23.13 23. 67 24.88 24.03 24. 33
35.5 35.4 36.6 35.2 36.7 38.5
66.0 65.1 65.5 65.5 65.1 65.5
23. 42 23.04 23. 93 23. 05 23. 87 25.21
35.9 37.1 36.1 37.0 38.2 38.1
66.8 67.2 67.2 67.6 67.6 67.1
23. 95 24. 95 24.28 24.98 25. 81 25. 56
36.9 37.6 38.1 36.9 37.1 37.3
63.7 62.5 62.7 63.0 62.4 62.5
23. 50 23. 55 23. 92 23. 34 23.19 ^3. 44
37.4 39.0 41.4 40.2 40.3 40.2
62.5 66.9 72.2 67.6 68.5 68.0
23. 38 26.10 29.85 27. 13 27. 58 27.44
36.8 38.9 38.8 41.3 39.7 39.4
67.3 68.0 67.4 68.3 68.2 68.4
24. 70 26. 43 26,13 28.18 27. 07 26. 96
36.1 38.8 38.5 40.4 39.3 39.4
62.8 62.5 62.5 62.1 62.2 63.4
22.68 24. 37 24. 07 25.08 24.49 25. 01
January February March April May June
38.8 36.8 38. 4 38.1 37.8 38.0
67.0 67.1 68.1 68. 5 69.2 68.0
26. 01 24. 65 26.15 26.13 26.14 25. 85
38.1 37.8 37. 7 38.3 38.4 38.2
67.3 68.2 68.4 69.2 69.2 69.1
25. 63 25.78 25. 82 26. 42 26. 59 26. 35
37.9 37. 7 37.8 38.0 38.1 38.3
63.5 62.6 63.6 63.8 64.3 65. 7
24.18 23. 69 24.10 24. 37 24. 67 25. 34
July August September. _ October November December
37.3 39.1 39.8 40.6 40.4 41.2
68.3 69. 7 69.1 68.4 68.3 68.1
25. 45 27.29 27.53 27.74 27.56 28.03
37.9 39.6 39.1 40.1 39. 7 40.5
69.4 69.3 68.9 69.0 69.7 70.2
26. 28 27.42 < 26. 93 27. 66 27.66 28. 42
38.6 39.9 40.5 40.9 38.9 40.8
66.5 65.7 66.0 65.7 66.2 66.1
25. 68 26. 21 26. 71 26.81 25. 76 26. 91
January February March April May June
-
July August September October November December 1939 January February March _ April May June... _
_
July August September October November. December
mo
See footnotes at end of table.
Digitized for FRASER http://fraser.stlouisfed.org/ Federal Reserve Bank of St. Louis
4
56
HOURS AND EARNINGS IN THE UNITED STATES
5.—Average hours worked per week, average hourly earnings, and average weekly earnings in manufacturing industries, by years, 1932 to 1940, and by months, January 1935 to December 1940 1 —Continued
TABLE
Iron and steel and their products, not including machinery—Continued
Year and month
Steam and hot-water heat ing apparatus and steam fittings
Structural and ornamental metalwark
Stoves
Average Average Average Average Average Average Average hours Average Average hours hours hourly weekly hourly weekly hourly weekly worked worked worked per week earnings earnings per week earnings earnings per week earnings earnings Cents
Cents 35.8 35.1 38.1 41.7
48.2 54.0 56.6 58.2
$17. 34 17. 67 18. 94 21.58 24.12
32.2 32.8 33.3 35.2 41.7
Cents 54.3 48.0 57.9 58.6 58.4
$18.42 16. 08 19. 27 20. 58 24. 32
27. 08 23.15 26.19 28. 71
39.4 36.0 38.1
63.8 66.3 66.6 68.0
25. 02 23. 67 25. 25 26.33
41.2 36.0 38.5 39.2
68.4 72.3 72.7 73.6
28.18 25. 98 27. 95 28. 83
59.2 58.0 58.3 58.0 58.3 58.7
20. 71 21.16 21.03 21.13 21.24 21.11
34.7 35.2 36.9 37.1 36.8 36.9
54.3 55.9 56.5 57.3 57.3 57.1
18. 92 19. 72 20. 95 21.26 21.06 21.05
33.9 32.9 33.6 34.1 34.4 34.5
58.2 59.6 58.8 58.9 59.1 58.2
19. 80 19. 61 19. 70 20. 05 20.28
35.3 37.2 38.9 41.3 38.8 38.8
57.9 58.0 58.4 57.8 . 57. 7 58.1
20. 48 21.69 23.94 22. 36 22. 61
36.7 39.0 40.9 43.2 38.6 39.7
56.1 56.3 56.6 56.4 57.5 57.3
20. 21. 23. 24. 22. 22.
42 94 24 44 19 65
34.9 36.1 37.1 37.6 36.1 37.6
58.9 58. 2 58.0 58.1 58.6 58.1
20. 53 20. 99 21.44 21.80 21.14 21.86
January... February . March April May June
38.1 38.9 39.7 39.7 41.0 41.9
58.6 58.2 58.4 58.2 58.1 58.2
22. 22. 23. 23. 23. 24.
38 70 22 13 84 44
36.4 40.3 41.3 40.7 41.3 41.7
57.1 58.2 58.3 57.3 57.2 58.0
20. 67 23.24 23. 85 23.18 23. 51 24. 05
37.3 36.8 39.0 40.6 42.6 43.1
58.4 57.9 58.1 57.9 57.1 58.2
21.80 21.35 22.72 23. 52 24. 34 25. 03
July August SeptemberOctober November.. December..
40.6 42.6 39.7 43.6 43.3 43.9
57.5 58.4 58.5 59.4 59.5 60.6
23. 44 24. 94 23.31 25.91 25. 79 26. 61
39.5 46.1 44.2 43.7
56.4 58.7 58.5 58.8 59.1 59.3
21.99 24. 01 24. 34 26. 89 25. 99 25. 73
41.8 42.6 42.4 44.0 43.0 43.4
58.4 58.1 58.3 58.5 58.7 60.8
24. 37 24. 70 24. 69 25. 76 25. 23 26.37
January... February. March April May June.
42.1 44.1 44.5 44.0 43.0 40.5
64.7 63.7 64.0 68.2 68.0 68.3
27. 20 28.15 28. 46 29.91 29. 23 27. 67
42.8 42.7 42.8 41.6 40.5
59.2 62.1 62.2 63.6 64.4 65.1
23.18 26. 30 26. 63 27. 09 26. 75 26. 24
40.6 42.3 43.0 42.7 41.7 42.3
62.1 62.4 63.5 68.2 69.0 69.5
25. 27 26. 32 27. 38 29.17 28. 80 29. 36
July.. August SeptemberOctober NovemberDecember.
39.0 39.1 38.7 37.7 33.1 32.8
68.2 69.0 69.7 69.4
26. 61
37.1 39.3 38.9 39.3 32.3 33.1
62.6 64.7 65.3 65.4 65.5 65.5
23.15 25. 28 25. 37 25. 59 21.02 21.26
40.6 41.5 40.7 40.9 39.3 38.4
70.8 70.5 70.6 71.2 71.4 72.0
28. 67 29.20 28. 69 29. 04 27. 99 27. 59
1932.. 1933.. 1934.. 1935..
33.5 34.6 37.3 41.2
51.6 57.6 58.1 58.7
$17. 73 17. 38 19. 92 21.76 24. 25
40.0 33.1 37.6 40.3
67.6 69.9 69.7 71.4
January... February. March April May June
34.9 36.4 36.0 36.4 36.4 35.9
July August SeptemberOctober November.. December..
1937.. 1938.. 19391940-. 1935
22. 80
41.0 41.9
20.11
1937
69.6
See footnotes at end of table.
Digitized for FRASER http://fraser.stlouisfed.org/ Federal Reserve Bank of St. Louis
27.11 26. 97 26. 24 23.18 22. 90
GENERAL
57
TABLES
TABLE 5.—Average hours worked per week, average hourly earnings, and average weekly earnings in manufacturing industries, 6?/ years, 1932 to 1940, and 6?/ months, January 1935 to December 1940 1 —Continued Iron and steel and their products, not including machinery—Continued Steam and hot-water heating apparatus and steam fittings
Year and month
Structural and ornamental met.alwork
Stoves
Average Average Average Average Average Average Average hours hours hours Average Average weekly worked hourly weekly worked hourly weekly worked hourly earnings earnings earnings earnings per week per week per week earnings earnings 1938 January February March April May June
31.1 30.9 30.5 30.4 30.9 34.1
Cents 70.9 70.6 70.9 71.4 70.9 69.8
$22.21 21.94 21.76 21.76 22. 01 23. 79
31.8 34.5 35.2 35.0 35.7 34.9
Cents 65.0 66.5 66.2 66.2 66.6 66.4
$20.21 22. 56 23. 21 23. 09 23. 61 22. 95
35.8 35.8 35.9 35.4 35.8 34.7
Cents 72.1 72.0 71.5 71.8 72.2 72.8
$25.74 25.74 25. 63 25. 41 25. 77 25.26
July. August September. October November Decemtsr.
33.4 35.2 33.3 36.3 33.9 35.9
69.1 69.2 69.1 69.0 68.9 69.9
23.18 24. 27 23.00 24. 98 23. 27 25.05
34.4 36.0 39.4 41.0 35.5 36.9
66.1 66.6 65.9 66.2 66.7 67.2
22. 51 23.95 25. 71 26. 98 23.55 24. 30
35.8 36.9 35.8 36.3 36.0 37.4
72.8 73.1 72.6 72.0 72.5 72.7
26.01 •26. 94 25.93 26.12 26. 07 27.18
35.4 36.3 36.0 35.2 35.7 36.9
69.7 69.5 68. 2 69.7 69.6 69.6
24. 71 25. 24 24. 56 24. 52 24. 92 25. 66
35.0 37.4 38.3 38.1 37.3 37.9
65.9 66.9 66.7 66.7 66.5 66.6
22. 78 24. 72 25. 21 25.19 24. 77 25. 20
36.5 37.0 37.7 38.4 38.2 39.1
73.1 72.9 73.1 73.1 72.7 72.1
26. 59 26. 93 27. 54 28.06 27. 71 28.13
35.1 37.9 38.6 41.8 40.1 40.2
69.1 69.9 69.7 70.6 69.9 70.5
24. 23 26.47 26. 84 29.49 28. 00 28. 38
37.0 37.7 38.8 41.2 39.3 38.0
66.1 66.0 66.3 67.4 67.4 . 66.9
24. 13 24. 78 25. 65 27. 68 26.51 25. 24
38.1 39. 7 38.3 39.9 39.3 39.3
72.2 72.6 72.1 72. 5 72.5 73.1
27. 42 28. 74 27. 62 28.87 28. 52 28.74
January February March April May June
38.7 38.9 38.3 38.5 37.8 39.2
70.4 70.6 70.3 71.2 70.9 70.3
27. 20 27. 45 27.04 27. 36 26. 77 27. 47
35.7 36.8 37.6 37.9 38.4 37.3
66.7 67.4 67.4 68.4 68.8 68.4
23. 24. 25. 25. 26. 25.
75 71 40 95 35 49
37.9 37.3 37.3 38.6 38.0 38.6
73.0 73.2 73.5 73.7 74.1 74.1
27. 65 27. 27 27. 39 28. 42 28.13 28. 56
July August September October November December
39.8 40.3 41.2 43.2 42.2 43.0
71.1 71.6 71.5 72.7 72.8 72.3
28. 25 28. 80 29. 34 31. 34 30. 65 31.04
37.3 38.6 40.4 42.0 40.1 40.4
67.7 67.7 68.2 68.6 68.2 68.2
25. 20 26. 09 27. 54 28. 79 27.14 27. 37
39.0 40.1 39.5 41.0 40.0 41.6
73.8 73.6 73.5 73.3 73.2 74.3
28.87 29. 51 28. 99 30. 02 29. 26 30. 80
1939 January. February March April.. May... June July... August September October November. December
-
1940
See footnotes at end of table.
Digitized for FRASER http://fraser.stlouisfed.org/ Federal Reserve Bank of St. Louis
58
HOURS
AND
EARNINGS
IN
THE
UNITED
STATES
5 . — A v e r a g e hours worked per week, average hourly earnings, and average weekly earnings in manufacturing industries, by years, 1982 to 1940, and by months, January 1935 to December 1940 1 —Continued
TABLE
Iron and steel and their products, not including machinery--Continued
Tin cans and other tinware Year and month
Tools, not including edge tools, machine tools, files, and saws
Wirework
Average Average Average Average Average hours Average Average hours hours Average Average worked hourly weekly worked hourly weekly worked hourly weekly per week earnings earnings per week earnings earnings per week earnings earnings Cents
1932 1933 1934 1935 1936
36. 5 38.3 39.3
1937 1938 1939 1940
Cents
52.7 51.3 52.5
$19.89 18. 95 19.31 19. 75 20. 69
39.7 43.5
39.2 37.7 38.8 39.0
57.9 60.5 61.1 63.0
22. 65 22. 68 23.61 24.46
January February March April May June
37.2 35.3 37.3 37.1 38.0 38.7
53.3 51.7 51.5 51.2 51.0 50.5
July August September October. November December
39.2 40.8 39.4 39.4 37.6 37.8
Cents
54.1 53.8
$16.12 16. 87 19.31 21.55 23. 43
37.6 40.4
55.6 55.4
$19. 71 20. 97 22. 36
41.6 35. 7 39.7 41.1
59.5 61.5 61.8 63.5
' 24. 82 22.03 24.49 26.06
37.6 34.1 38.1 39.5
64.9 67.3 68.3 70.3
24.39 22. 89 25. 96 27. 74
19. 86 18.39 19.37 19.16 19.49 19. 67
36.9 39.2 39.7 39.2 39.1 38.6
55.1 54.7 54.5 54.8 54.2 54.0
20.31 21.41 21.68 21.40 21.30 20. 94
36.9 38.3 38.7 40.2 34.7 36.4
55.1 55.2 55.9 56.3 56.3 56.8
20. 55 21.13 21.62 22.59 19. 51 20.67
50.4 50.6 51.2 51.7 52.4 52.4
19. 87 20.63 20. 25 20. 42 19. 81 19. 60
37.0 38.2 39.0 41.8 42.1 44.0
53.8 54.1 53.9 53.5 53.7 53.4
19. 87 20. 81 21.21 22. 44 22. 63 23.59
31.9 33.1 35. 5 39.4 41.2 42.5
56.6 55.1 56.5 54.6 55.1 55.3
18.07 18.28 20. 05 21.52 22. 68 23. 46
37.7 36.5 38.9 39.0 39.6 40.2
52.8 53.0 52.7 52.1 52, 2 51.6
19. 98 19.31 20. 48 20.28 20. 77 20. 84
42.6 42.8 43.3 43.7 43.3 43.3
53.3 53.4 53.2 53.6 53.8 53.8
22.80 22. 88 23.05 23.44 23.19 23.30
37.5 37.6 40.9 42.8 42.2 41.2
55.2 55.2 56.1 55.2 54.8 55.1
20. 71 20. 74 22. 88 23. 59 23.14 22.73
39.6 40.9 41.1 39.3 38.5 39.6
51.9 52.2 52.3 52.6 53.4 53.6
20.67 21.39 21.59 20. 68 20. 56 21.15
40.4 42.6 41.6 46.5 45.1 46.1
54.3 53.9 54.2 52.7 53.9 55.1
21.91 22. 94 22. 64 24. 56 24.34 25.40
38.1 36.8 35.7 42.9 45.2 42.3
54.6 55.0 54.2 54.4 55.4 58.2
20. 81 20.26 19. 33 23.30 25.04 24.62
January February._ March.._ __ April May June
38.6 39.5 40.1 40.5 40.1 40.0
53.9 54.1 54.8 56.7 58.3 57.9
20. 85 21.42 22. 01 23.03 23. 11 23 10
44.7 46.0 45.1 45.2 42.8 43.5
55.4 55.5 56.3 58.5 59.9 60.5
24.69 25. 59 25. 42 26. 44 25. 68 26.36
40.0 38.6 41.0 40.1 40.1 39.6
57.1 58.5 59.8 63.0 65.4 66.5
22. 80 22. 55 24.38 25. 08 26. 21 26.33
July August. September... October.. November December.
39.3 40.5 39.3 38.1 36.8 37.3
58.3 58.6 60.1 60.7 60.3 60.5
22.86 23. 73 23. 46 23. 09 22.11 22.38
40.1 40.2 39.7 39.0 36.7 35.2
61.3 61.6 61.6 61.9 62.2 62.2
24. 58 24. 81 24. 54 24.20 22.95 21.96
36.5 34.8 35.6 39.2 33.5 31.5
67.3 67.8 68.7 70.2 68.7 68.2
24. 55 23. 57 24. 58 27. 48 23.00 21.47
1935
1936 January February. March April Mav._ June
_ ...
July August September October... November.. December 1937
See footnotes at end of table.
Digitized for FRASER http://fraser.stlouisfed.org/ Federal Reserve Bank of St. Louis
GENERAL
59
TABLES
5 . — A v e r a g e hours worked per week, average hourly earnings, and average weekly earnings in manufacturing industries, by years, 1932 to 1940, and by months, January 1935 to December 1940 1 —Continued
TABLE
Iron and steel and their products, not including machinery—Continued
Tin cans and other tinware Year and month
Tools, not including edge tools, machine tools, files and saws
Wirework
Average Average Average Average Average Average hours hours Average Average hours Average weekly worked hourly weekly worked hourly weekly worked hourly earnings earnings earnings earnings earnings earnings per week per week per week 1938 January, February.. March April May June
36.8 36.9 37.5 36.9 37.6 37.9
Cents 61.0 61.3 61.4 61.1 61.0 60.2
$22. 21 22. 46 22. 92 22. 42 22. 89 22.62
34.7 34.4 36.0 34.1 34.0 33.4
Cents 62.0 61.4 61.8 61.8 61.8 61.7
$21. 60 21.32 22. 36 21.18 21. 25 20. 71
30.2 30.4 32.2 31.8 31.6 31.3
Cents 66.8 67.1 67.6 67.9 66. 5 65.8
$20.17 20. 38 21. 70 21.56 20. 99 20. 59
July.... August. September October November December
38.1 39.2 38.2 37.3 37.3 37.7
58.9 59.7 59.9 60.6 60.7 60.8
22. 44 23. 40 22. 85 22. 50 22. 50 22.76
32.7 35.2 36.4 38.2 38.0 39.6
61.8 61.3 61.5 60.8 61.2 61.2
20. 40 21.64 22. 28 23.11 23.24 24.19
30.6 34.0 36.9 37.9 38.8 38.6
65.1 66.7 68.7 68.0 68.1 67.8
19. 87 22. 64 25. 31 25. 65 26. 39 26.16
January February March April May June
37.4 36.8 38.7 38.1 38.9 39.4
61.3 61.0 60.8 61.1 60.9 60.4
22. 78 22.33 23.57 23.19 23.66 23. 82
39.3 39.9 40.0 39.1 38.8 39.0
60.4 61.5 61.4 61.4 61.5 61.8
23.75 24. 45 24. 45 23. 95 23. 83 24.05
35.9 36.8 37.7 36 7 35.9 37.6
67.1 66.9 67.5 67.5 66.8 67.3
24. 01 24. 60 25. 36 24. 68 23. 91 25. 26
July.... August September October... November. December.
38.1 39.9 40.5 39.1 38.9 38.6
60.5 60.8 61.5 6.1.0 61.4 61.9
23.12 24.20 24. 86 23. 86 23.70 23.82
36.8 38.6 38.9 41.2 41.7 43.0
62.3 62.3 61.9 62.2 62.0 62.2
22. 88 23.97 24. 02 25. 58 25. 77 26. 66
35.9 36.8 39.4 40.3 41.1 40.9
68.4 67.4 70.4 68.2 70.0 70.5
24. 54 24.76 27.70 27.47 28. 73 28. 81
January February March... April May June
37.9 36.8 38.7 38.9 38.6 39.8
61.9 62.0 62.6 62.4 62.4 63.2
23. 46 22. 82 24.15 24.20 24. 04 25.04
41.3 40.7 39.8 39.3 39.6 38.9
62.6 62.6 62.4 62.6 62.7 62.8
25. 71 25. 37 24. 74 24. 57 24. 75 24. 42
39.3 38.4 39.1 38.0 37.2 37.5
69.5 70.2 70.6 71.7 71.1 70.7
27. 31 26.93 27.51 27.16 26. 42 26. 48
July August September October November December.
39.1 40.4 39.6 40.0 37.0 40.5
62.7 63.9 6 63.4 63.2 63.5 63.8
24. 38 25.61 25.01 25.16 23.47 25. 72
39.0 39.8 41.4 42.5 43.6 45.4
63.1 63.4 63.8 64.1 64.9 65.7
24. 60 25. 22 26. 33 27.15 28. 24 29. 79
37.1 39.7 40.2 41.9 40.7 41.1
69.7 70.2 70.7 69.9 69.9 69.8
25.87 28. 00 28.39 29. 26 28. 45 28. 68
1939
mo
See footnotes at end of table.
402097°—42
Digitized for FRASER http://fraser.stlouisfed.org/ Federal Reserve Bank of St. Louis
5
60
HOURS
AND
EARNINGS
IN
THE
UNITED
STATES
5 . — A v e r a g e hours worked per week, average hourly earnings, and average weekly earnings in manufacturing industries, by years, 1932 to 1940, and by months, January 1935 to December 1940 1 —Continued
TABLE
Machinery, not including transportation equipment
"Machinery" group Year and month
Agricultural implements (including tractors)
Cash registers, adding machines, and calculating machines
Average Average Average Average Average Average hours hours Average Average hours worked hourly weekly worked hourly weekly worked hourly per week earnings earnings per week earnings earnings per week earnings
30.8 33.5 34.9 37.7 41.2
Cents 56.5 54.1 59.0 61.0 61.3
$18. 99 18.86 20. 90 23. 20 25. 29
37.7 39.4 39.4
59.6 64.6 66.1
$18. 90 18. 86 22. 56 25. 28 25. 94
38.2 39.5 41.3
40.9 34.9 38.9 41.3
69.6 72.5 72.5 74.5
28. 47 25.44 28.19 30.82
39.7 35.8 37.7 39.1
77.3 79.1 78.9 80.0
30.60 28. 25 29.61 31.18
41.5 35.5 37.2 40.1
35.5 36.4 37.1 36.9 37.0 36.5
61.1 61.1 61.0 61.2 61.4 61.6
21.93 22. 59 22. 81
22. 80 22. 95 22. 78
39.1 38.8 39.6 39.7 39.9 39.8
63.4 63.4 63.3 63.2 64.6 64.3
24.38 24. 36 24. 78 24. 87 25. 45 25.20
37.9 39.2 39.2 39.1 39.1 39.4
36.4 37.9 38.7 39.8 39.4 40.1
61.1 60.9 60.5 60.2 60.7 61.1
22. 53 23. 26 23.67 24.12 23. 99 24.62
39.5 39.5 39.3 39.1 39.1 39.7
64.6 65.1 65.4 65.6 65.8 65.7
25. 35 25. 55 25.48 25. 62 25. 61 26.04
39.7 40.0 40.2 40.2 38.5 41.3
38.9 39.5 40.4 41.2 42.0 41.8
61.2 61.0 61.2 61.1 60.9 61.0
24.02 24.26 24. 80 25. 27 25. 58 25. 55
39.8 39.9 40.6 40.5 40.3 40.1
65.9 65.3 65.4 65.2 65.5 65.1
26.12 26. 00 26. 52 26. 34 26. 34 25. 87
41.8 41.0 41.0 41.5 42.0 42.3
40.5 40.8 39.9 42.3 42.4 43.6
60.8 60.7 60.9 61.1 61.8 63.0
24. 67 24. 88 24.31 25. 92 26.16 27. 43
38.2 37.5 35.1 40.0 40.0 40.5
65.1 66.4 66.0 66.2 66.8 70.0
24. 64 24. 69 23.11 26. 32 26. 62 28.26
40.9 40.2 39.0 42.9 40.0 42.9
41.8 42.7 43.3 43.1 42.4 41.9
63.8 64.5 65.9 69.0 69.7 70.4
26. 67 27. 50 28. 51 29. 75 29. 54 29.41
40.1 40.2 41.1 40.9 40.5 40.0
71.3 71.2 72.4 77.1 78.0 78.5
28.44 28. 53 29. 67 31.45 31.45 31.02
41.7 42.8 42.5 43.6 43.0 41.7
40.2 40.9 39.7 39.9 38.0 37.0
70.8 71.1 71.6 72.0 72.6 73.0
28. 51 28. 97 28. 47 28. 86 27. 79 27.25
38.9 39.9 39.2 40.2 39.1 37.0
78. 5 78.9 79.9 79.5
30.49 31. 28 31.31 31.89 31.24 29. 58
41.3 40.3 40.8 41.0 39.2 39.5
See footnotes at end of table.
Digitized for FRASER http://fraser.stlouisfed.org/ Federal Reserve Bank of St. Louis
Cents
80.0
80.1
GENERAL
61
TABLES
TABLE 5.—Average hours worked per week, average hourly earnings, and average weekly earnings in manufacturing industries, 6?/ years, 1932 to 1940, and 6?/ months, January 1935 to December 1940 1 —Continued Machinery, not including transportation equipment
"Machinery" group Year and month
Agricultural implements (including tractors)
Cash registers, adding machines, and calculating machines
Average Average Average Average Average Average Average Average Average hours hours hours hourly weekly hourly weekly worked hourly weekly worked earnings earnings worked earnings earnings per week earnings earnings per week per week 1988 January _ February March April May June
34.5 34.6 34.5 34.1 34.1 33.8
Cents 73.2 72.9 73.0 73.0 72.9 72.8
$25.61 25. 48 25.34 24.94 24. 96 24.68
36.7 36.7 37.2 36.0 35.7 35.1
Cents 80.4 80.0 79.4 79.5 79.6 78.1
$29.50 29.28 29. 54 28. 61 28. 37 27. 36
37.6 36.3 36.8 34.0 34.8 35.2
Cents 81.0 80.4 80.7 80.9 81.2 81.8
$30.34 29.13 29.54 27.49 28.16 28. 56
July August September October November December
33.6 34.7 35.4 36.3 36.2 37.4
72.4 72.0 72.1 71.8 71.9 72.1
24. 34 25.08 25. 57 26.07 26. 04 27.00
34.7 34.5 34.6 35.2 34.3 37.4
78.1 76.8 77.1 77.7 79.4 80.3
27.05 26.43 26. 55 27.11 27. 08 29. 85
35.8 35.7 35.3 34.9 35.0 35.1
81. 7 81.6 81.8 82.2 82.3 82.1
28.93 28.82 28. 62 28. 43 28. 57 28. 51
January February March_. April May. June
36.6 37.6 38.0 37.7 38.3 38.6
72.4 72.5 72.8 72.6 72.5 72.5
26. 51 27.27 27. 67 27.45 27. 86 27.97
35.3 37.5 37.8 37.9 37.7 37.1
79.4 80.4 80.3 79.5 78.7 78.0
27.92 29.96 30.19 30.00 29. 56 28. 85
35.0 35.7 35.9 36.7 37.3 37.6
82.2 81.9 82.0 81.8 82.0 82.1
28.47 28.93 29.17 29. 81 30. 29 30.62
July August September October.. November December
38.0 39.0 39.1 40.6 40.9 41.3
72.4 72.1 72.2 72.1 72.3 73.2
27. 55 28.07 28. 23 29.20 29. 51 30. 25
37.4 37.4 37.3 38.4 38.7 39.3
78.5 78.1 77.8 78.2 78.7 79.3
29. 20 29.11 28. 91 29. 92 30. 27 31.07
37.5 37.0 37.5 38.4 38.9 39.4
81.8 82.2 82.5 82.2 82.3 82.8
30. 52 30. 23 30. 80 31.50 31.93 32.48
January February.. March. _ _ _ ___ April May June
40.4 40.1 40.7 40.5 40.5 40.8
73.5 73.7 73.9 73.9 74.1 74.3
29. 74 29. 67 30.15 29. 97 30.11 30.41
38.9 39.2 39.5 39.3 39.4 38.6
79.6 79.7 79.7 80.1 79.9 79.8
30.91 31.14 31.37 31.43 31.42 30.74
39.1 39.1 40.1 39.9 39.7 40.4
82.5 82.5 82.4 82.4 82.4 83.0
32.11 32.17 32. 94 32. 75 32.58 33. 32
July August _ _ _ September October. _ November December
40.5 41.2 41.8 42.4 42.0 43.6
74.4 74. 5 74.6 74.9 75.2 76.1
30. 29 30. 67 31. 22 31.71 31. 65 33.13
38.3 38.6 39.1 39.2 39.0 39.5
79.5 80.1 79.9 80.2 80.6 81.0
30.42 30. 87 31.17 31.41 31.29 31.87
40.0 40.2 40.2 40.6 40.6 41.1
82.7 82.7 83.1 83.3 83.4 83.7
32.92 33.11 33.23 33. 58 33.64 34.15
1939
__
1940
See footnotes at end of table.
Digitized for FRASER http://fraser.stlouisfed.org/ Federal Reserve Bank of St. Louis
62
HOURS
AND
EARNINGS
IN
THE
UNITED
STATES
5 . — A v e r a g e hours worked per week, average hourly earnings, and average weekly earnings in manufacturing industries, by years, 1932 to 1940, and by months, January 1935 to December 1940 1 —Continued
TABLE
Machinery, not including transportation equipment—Continued
Year and month
Electrical machinery, apparatus, and supplies
Engines, turbines, water wheels, and windmills
Foundry and machine-shop products
Average Average Average Average Average Average Average Average Averaee hours hours hours worked hourly weekly worked hourly weekly worked hourly weekly' earnings earnings earnings earnings per week per week per week earnings earnings Cents
32.8 34.6 36.2 37.5 40.6
Cents 58. 3 57.5 63.4 65.1 66.3
$19. 65 19. 77 22. 93 24. 40 26.87
30.0 32.7 34.7 37.8 42.4
Cents 55.1 53.2 58.7 59.9 60.1
$17.03 17.32 20. 30 22. 66 25. 55
05 37 43 72
40.5 36.2 40.0 43.7
75.7 78.6 79.0 81.7
30. 47 28.31 31. 44 35. 61
41.9 35.0 38.9 41.0
68.0 71.1 71.6 73.4
28. 51 24. 94 27. 83 30.13
62.8 62.9 62.6 63.1 62.8 63. J
22. 06 22. 87 22. 82 22. 80 22. 68 22. 23
35. 3 37.5 38.2 38.3 37.6 37.5
64.2 63.7 63. 1 64.3 65.0 64.9
22. 67 23. 89 24.10 24. 62 24. 48 24. 35
35.1 36.6 37.1 37.0 37.0 36.3
59.7 59.9 59.9 59.8 60.0 60.3
20. 95 21.93 22. 23 22.10 22.20 21.92
34.8 36.6 37.8 39. 1 38.3 39.0
62.3 62.1 61.7 61.1 61.5 61.9
21.64 22. 71 23. 33 23. 85 23. 50 24. 08
35. 8 37.9 37.4 37.8 37.6 39.0
65.7 66. 1 66.5 66.0 65.7 65.9
23. 42 25. 03 24. 78 24. 94 24. 68 25. 69
36.3 38.2 38.7 40.0 40.0 41.1
59.8 59.7 59.6 59.5 59 9 60.0
21. 78 22. 88 23. 12 23. 84 24.00 24. 67
37.3 37.8 38.8 40. 1 40.7 40.9
62.3 62.3 62.8 62.4 62.2 62.2
23. 24 23. 54 24. 34 25. 03 25. 30 25. 34
38.7 39.5 41.0 40.8 41.2 41.5
65.9 66.7 65.5 65.4 65.2 65.9
25. 62 26. 32 26. 87 26. 65 26.86 27. 26
39.7 40.5 41.5 42.5 43.3 43.0
59.8 59.4 59.6 59.7 59.6 59.8
23. 82 24.16 24. 75 25. 42 25. 84 25.84
39.5 39.6 38.7 40.9 41.4 42.1
62.4 61.6 61. 5 62.3 62.3 63.4
24. 59 24. 55 24. 09 25. 69 25. 97 26. 86
40.3 39.8 39. 2 40.6 41.0 42.3
65.8 65.8 65.9 66. 1 67.3 70.0
26. 37 26. 23 25. 69 26.81 27. 54 29. 50
41.5 41.8 41.3 43.4 43.8 45.1
59.6 59.9 60. 2 60.0 60.9 61.8
24.79 25.18 24. 99 26.19 26. 71 27.96
January February March April May June
40.1 41.3 41.7 41.2 40.2 39.9
64.3 65. 6 66.6 70.6 71.8 72.5
25. 75 27. 11 27. 82 29.16 28. 85 28. 95
42.3 42.4 42.5 42.5 41.8 41.1
70.4 70.6 71.3 76. 2 76.6 77.2
29. 62 29. 82 30. 18 32. 25 31.67 31.46
43.1 44.3 44.9 44.7 43.9 43.2
62.5 63.0 64.6 67.2 67.7 68.5
27.05 27.94 28. 99 30. 09 29. 77 29. 58
July... August. September October November December
38.8 39.5 38.4 39.0 37. 2 36.1
72.7 72.7 73. 1 73.6 74.6 74.8
28. 29 28. 72 28. 05 28. 65 27. 74 27.01
39.2 38.9 38.5 38.6 39.1 39.8
76.2 76.6 77.1 79.1 78. 1 78.8
29. 73 29. 83 29.29 30. 20 30. 27 31.20
41.0 42.0 40.4 40.6 38.3 37.0
69.2 69.9 70.3 70.6 70.8 71.3 1
28.41 29.19 28. 42 28.69 27.12 26.47
$20. 44 19. 83 20. 83 22. 90 24.98
1932 1933... 1934 1935 1936..
33.1 34.0 36.8 39.9
57.1 60.4 62.3 62.4
1937 1938 1939 1940
39.4 34. 2 38.5 40.7
71.1 74.1 74.0 75.8
28. 25. 28. 30.
January February. March April May. June
35.2 35.9 36.5 36.2 36.2 35.2
July August. September October.November December
1935
1936 January February March April May June.. July August September. October-.. November. December
_ .__ .. ... _ ...
1937
See footnotes at end of table.
Digitized for FRASER http://fraser.stlouisfed.org/ Federal Reserve Bank of St. Louis
GENERAL
63
TABLES
TABLE 5.—Average hours worked per week, average hourly earnings, and average weekly earnings in manufacturing industries, 6?/ years, 1932 to 1940, and 6?/ months, January 1935 to December 1940 1 —Continued Machinery, not including transportation equipment—Continued Electrical machinery, apparatus, and supplies
Year and month
Engines, turbines, water wheels, and windmills
Foundry and machine-shop products
Average Average Average Average Average Average Average Average Average hours hours hours hourly weekly hourly weekly worked hourly weekly worked earnings earnings worked earnings earnings per week per week earnings earnings per week 1938 January February March April May June
.
July August September October November December
33.5 33.3 32.9 32.6 32. 3 32.7
Cents 74.9 74.5 74.9 74.6 74.9 74.7
$25.17 24. 88 24. 73 24. 42 24. 27 24. 49
36.4 36.6 37.7 36.9 35.9 34.6
Cents 78.1 78.7 79.5 78.8 77.6 78.3
$28. 32 28. 72 29. 85 28. 94 27. 78 26. 98
34.4 34.8 34.7 34.4 34.7 33.9
Cents 71.4 71.2 71. 2 71.2 71.3 71.4
$24. 70 24. 85 24. 72 24. 47 24. 74 24. 30
32.7 34.2 35.3 36.5 36.7 37.1
74.2 73.8 73. 7 73.2 73.0 73.6
24. 33 25. 28 26. 07 26. 71 26.69 27. 26
34.6 35.9 35.6 35.8 36.2 37.7
78.5 78.7 78.8 78.5 78.6 79.3
27. 05 28. 13 28. 00 28.01 28. 35 29. 73
33.7 34.9 35. 2 36.0 35.8 37.2
71.0 70.9 71.0 70.9 71.1 71.2
23. 99 24.87 25. 02 25. 54 25. 51 26. 48
36.4 37.3 37.8 37.2 37.8 38.3
74.4 74.3 74.5 74.2 74.4 74.4
27. 05 27. 63 28. 09 27. 57 28.11 28. 42
37.2 39.0 39.5 39.3 39.5 39.2
78.8 78.7 78.8 79.2 78.7 78.2
29.21 30. 50 30. 92 30. 94 30. 95 30. 57
36. 6 37.5 37.8 37.4 38.3 38.7
71.3 71.1 71.5 71.4 71.0 71.6
26.11 26. 69 27. 02 26. 70 27. 23 27. 71
37.8 38.8 38.9 40.0 40.2 40.4
74.3 73.7 74.0 73.3 73. 1 74.2
28. 05 28. 50 28.71 29. 24 29. 34 29. 89
39.2 40.1 39.6 41.1 42.1 43.0
77.9 77.8 78.7 79.4 79.9 80.5
30. 36 31.01 30. 97 32. 48 33. 46 34. 49
37.6 38.9 38.9 40.8 40.9 41.7
71.5 71.4 71.5 71.8 72.0 72.7
26. 95 27. 78 27. 86 29. 27 29. 43 30. 35
39.7 39.3 39.8 39.4 39.8 40.2
74.9 75.3 75.5 75.6 75.7 76.4
29. 67 29. 53 29. 98 29. 70 30.01 30. 52
42.6 42. 1 42.9 42.9 43. 1 43.8
80.4 81. 3 80.7 80.3 79.7 80.3
34.10 34. 09 34. 43 34. 35 34.21 35. 05
40.4 39.9 40.5 40.3 40.1 40.4
72.6 72. 3 72.5 72.6 73.0 72.8
29. 28. 29. 29. 29. 29.
39.8 40.7 41.3 41.7 41.9 43.2
76.2 76.3 6 75.7 75.2 75.7 76.6
30.14 30. 92 31. 21 31. 26 31.61 32.95
43.5 44.0 44.7 44.4 43.2 45.5
80.7 81.9 81. 2 83.0 84. 2 84.1
35.04 36. 00 36.24 36. 74 36. 35 38.20
40.1 41.0 41.2 42. 1 41.6 43.6
73.0 73. 3 73.4 74.0 74.5 75.5
29. 33 30.12 30. 31 31. 18 30. 95 32. 85
1939 Januarv February March April. May.. June July August September October November December.
_. -
mo January. February March.. April May June.
_ . .
July August September October November. December
.
See footnotes at end of table.
Digitized for FRASER http://fraser.stlouisfed.org/ Federal Reserve Bank of St. Louis
27 89 39 27 29 41
64
HOURS
AND
EARNINGS
IN
THE
UNITED
STATES
5 . — A v e r a g e hours worked per week, average hourly earnings, and average weekly earnings in manufacturing industries, by years, 1932 to 1940, and by months, January 1935 to December 1940 1 —Continued
TABLE
Machinery, not including transportation equipment—Continued Machine tools
Radios and phonographs
Textile machinery and parts
Average Average Average Average Average Average Average hours hours hours Average hourly weekly worked hourly weekly worked earnings worked hourly earnings earnings earnings per week per week per week earnings
31.0 33.9 37.2 41.5 44.6
Cents 60.4 56.8 60.4 62.4 63.6
$19. 48 19. 44 22. 49 25. 89 28. 40
33.7 35.9 37.3
54.0 54.2 54.0
$19. 92 18. 30 18. 45 19. 40 20.10
36.5 35.2 36.7 41.0
45.1 36.3 42.9 48.2
71.6 73.3 75.2 76.8
32. 24 26.61 32. 25 36.97
36.3 36.0 38.5 38.5
60.1 58. 1 61.4
21.26 21. 55 22. 34 23. 60
42.4 34.7 39.8 40.3
38.7 39.9 40.5 40.1 40.7 40.5
61.4 61.4 61.9 61.7 62.3 62.2
23.74 24. 45 25. 09 24. 75 25. 34 25.25
32.3 31.0 33.2 32.9 33.6 34.1
57.8 56.8 55. 9 57.0 57.2 56.3
17.63 18. 57 18.71 19.16 18. 49
18. 62
36.1 36.3 36.5 35.9 36.3 36.7
41.0 42.1 42.2 43.2 42.6 44.6
62.5 62.5 62.8 62.7 63.0 63.2
25. 59 26. 24 26. 48 27.12 26. 85 28. 23
34.9 36.8 39.5 40.0 39.0 35.3
54.3 52.8 51.3 51.0 52.7 55.0
18. 87 19. 46 20. 24 20. 60 20. 52 19. 37
36.2 36.5 35.8 37.6 36.7 40.7
44.0 44.2 44. 1 43.6 44.6 44.7
62.7 62.9 62.9 63.1 63.1 63.6
27. 62 27. 87 27. 77 27. 54 28. 22 28. 45
33.5 32.7 33.4 35.5 38.2 38.7
54.9 55.2 54.7 54.6 53.5 53.5
18. 37 18. 04 18.23 19. 36 20. 42 20. 69
40.5 41.0 42.0 41.0 41.6 39.7
43.9 44.9 42.4 45.8 45.5 47.5
62.8 63.6 63.8 63.8 64.3 65.6
27. 58 28. 52 27. 04 29.24 29. 28 31.16
37.8 39.4 37.6 40.1
52.4 52.8 52.4 54.0 54.7 55.7
19.74 20. 71 19.68 21. 55 21.11 21. 67
40.7 39.4 40.9 40.7 44.6
45.8 46.4 46.8 46.8 46.6 46.3
67.2 67.3 69.1 71.4 71.6 71.8
30. 73 31.18 32. 42 33. 39 33.28 33. 21
36.4 34.1 36.5 36.8 37.8 38.4
56.3 56.0 56.0 57.0 54.3
20.48 19.11 20. 36 20. 95 20.41 22. 47
45.2 46.2 45.4 45.3 44.8 43.8
44.4 44.0 44.2 45.1 42.9 42.2
72.5 72.7 73.3 73.9 73.8 73.5
32.14 31.94 32. 36 33.31 31. 63 31.03
37.4 38.5 36.5 35.6 33.2 33.2
59.9 59.8 60.6 61.1 62.5 63.0
22.16 22.78 21.94 21. 67 20.74 20.90
42.2 41.6 41.3 39.3 37.0 35.7
See footnotes at end of table.
Digitized for FRASER http://fraser.stlouisfed.org/ Federal Reserve Bank of St. Louis
Cents
GENERAL
65
TABLES
TABLE 5.—Average hours worked per week, average hourly earnings, and average weekly earnings in manufacturing industries, 6?/ years, 1932 to 1940, and 6?/ months, January 1935 to December 1940 1 —Continued Machinery, not including transportation equipment--Continued Radios and phonographs
Machine tools Year and month
Textile machinery and parts
Average Average Average Average Average Average Average Average Average hours hours hours hourly weekly worked hourly weekly worked hourly weekly worked earnings earnings per week earnings earnings per week earnings earnings per week 1938
32.7 31.7 30.7 33.5 35.9 36.9
Cents 63.8 62.8 61.6 62.6 60.7 59.9
$20.81 19.99 18. 78 20.91 21. 64 22. 07
32.8 32.6 32.9 33.2 33.4 33.7
Cents 66.0 66.5 66.4 66.9 66.9 67.8
$21.61 21. 65 21. 82 22.18 22. 30 22.80
26 86 87 12 78 44
36.3 35.7 37.5 39.1 38.5 38.9
61.0 59.5 59.4 57.7 58.2 58.2
22.11 21. 20 22. 21 22. 53 22. 40 22. 62
33.2 33.9 35.5 36.6 36.6 41.0
66.1 67.3 66.6 66.0 67.9 63.5
21.92 22.78 23.56 24.09 24. 83 25.98
74.0 74.6 74.2 74.6 74.9 75.0
28.17 29. 75 29. 83 30. 46 31. 70 31.78
37.7 36.7 36.6 36.2 36.9 37.2
59.1 57.7 57.8 58.6 58.9 58.3
22.15 21.15 21.14 21.19 21. 73 21. 63
38.1 38.2 39.0 38.8 38.7 40.5
65.4 66.5 65.9 66.6 66.4 66.1
24. 25. 25. 25. 25. 26.
41.8 42.6 43.0 44.9 47.0 48.2
74.8 74.6 75.0 75.4 76.5 77.0
31.23 31. 72 32. 19 33. 80 35. 91 37. 03
37.7 38.9 39.8 41.6 40.3 38.6
57.6 57.6 57.7 57.3 58.3 59.0
21.71 22. 38 22. 92 23.79 23. 47 22.71
40.5 40.1 39.8 40.2 41.2 41.5
65.8 66.1 65.8 65.0 65.7 66.3
26. 63 26. 47 26. 15 26. 14 27. 01 27.48
47.4 47.8 48.3 47.9 47.5 47.9
76.9 76. 6 76.7 76.7 76.6 76.6
36.41 36. 60 36 99 36. 72 36.35 36. 68
36.9 36. 6 36.4 36.8 38.2 38.5
59.5 60.6 61.4 61.1 60.6 61.4
22.12 22. 19 22. 30 22. 46 23. 09 23. 61
40.6 39.9 40.3 40.1 39.6 39.4
65.8 65.2 65.2 65.0 65.1 65.4
26. 65 25. 97 26. 23 26. 01 25. 71 25. 70
47.5 46.7 48.4 49.1 48.0 50.6
76.8 76.0 76.6 76.9 76.8 78.1
36. 45 35. 48 37. 02 37. 73 36. 85 39. 56
38.5 38.5 40.2 40.1 39.2 40.5
62.1 61.1 62.1 61.8 61.3 62.6
23. 23. 24. 24. 23. 25.
39.2 39.6 40.4 41.0 39.9 42.8
66.8 66.6 66.6 66.5 66.7 67.8
26.13 26. 30 26. 84 27.24 26. 56 28. 94
January February March April May June
39.7 38.0 37.0 35.0 34.9 33.4
Cents 73.2 72.8 73.1 72.9 73.0 72.7
July August September October November December
33.3 35.4 36.3 36.8 36.3 38.4
72.8 73.2 74.1 73.8 73.8 74.0
24. 25. 26. 27. 26. 28.
January February. _ March April May June
38.1 39.9 40.2 40.9 42.4 42.4
July August September October November December.
$29.01 27. 64 27.01 25. 51 25. 54 24.31
1939 89 32 68 79 65 70
1940 January . February March April May June July August September October _ November December
_
See footnotes at end of table.
Digitized for FRASER http://fraser.stlouisfed.org/ Federal Reserve Bank of St. Louis
90 49 89 74 97 32
66
HOURS
AND
EARNINGS
IN
THE
UNITED
STATES
5 . — A v e r a g e hours worked per week, average hourly earnings, and average weekly earnings in manufacturing industries, by years, 1932 to 1940, and by months, January 1935 to December 1940 1 —'Continued
TABLE
Machinery, not including transportation equipment— C ontinued
Year and month
Typewriters and parts
Transportation equipment
"Transportation" group
Aircraft
Average Average Average hours Average Average hours Average Average hours Average Average weekly weekly hourly weekly worked hourly worked worked hourly earnings earnings earnings earnings earnings earnings per week per week per week
1932.. 1933.. 1934.. 1935.. 1936..
26.1 36.3 39.2 38.2 42.1
Cents 51.7 48.0 54.7 57.4 56.9
$15.11 17.04 21.44 21.92 23.98
33.3 36.7 38.3
1937.. 1938.. 1939.. 1910.
40.2 32.5 37.3 39.5
62.0 64.8 64.3 65.7
24. 92 21.05 23.98 25.94
January. __ February. March April May June
37.8 36.2 37.5 37.4 37.2 36.1
57. 6 57.8 57.5 57.0 57.5 56.9
July August September.. October November.. December..
36.3 36.7 40.2 40.7 40.9 39.8
57.7 57.1 57.6 57.5 57.6 57.5
January._ February . March April May June
37.8 38.7 39.2 40.4 40.6 40.1
56.9 57.5 56.6 57.2 57.4 57.2
July August September.. October November.. December..
42.3 43.9 43.7 45.8 45.5 44.5
January. _ February. March April May June July August September.. October November.. December..
Cents
Cents
69.6 73.3 75.9
$21. 74 21.05 23.13 26.83 29.08
39.4 40.9 42.1
63.6 65.0 63.2
$31.42 27.46 24. 65 25. 75 26.08
36.6 33.8 36.3 38.9
86.3 89.2 89.4 89.9
31.26 30.25 32.30 34. 65
42.3 40.1 41.5 43.2
66.6 72.8 74.5 74.3
27.83 29.02 30.34 31.40
21.79 20.94 21.62 21.34 21.44 20. 62
35.0 38.9 38.9 39.5 37.0 34.1
70.7 70.7 71.3 71.9 72.2 75.1
24. 81 27.18 27. 41 28.19 26. 39 25. 62
40.1 43.0 39.7 40.2 39.9 40.6
63.2 61.9 67.7 67.1 66.9 66.7
24.06 25.75 26.37 25.98 25. 86 25. 68
20.92 20.98 23. 17 23.45 23. no 22. 84
33.3 33.2 34.2 36 9 39.6 37.7
75.2 75.6 74.7 74.4 74.4 74.5
25.05 25.06 25.32 27.42 29.58 28. 34
39.5 41.3 40.9 41.3 41.5 42.1
64.8 65.0 64.5 63.9 64.4 64.8
24.88 26. 32 25. 82 26.19 25.34 26.43
21.54 22. 27
74.9 75.0 75.2 75.6 75.4 75.7
26. 60
23. 09 23.29 22. 92
35.7 33.1 36.6 40.2 40.5 39.5
24.66 27. 42 30. 32 30.47 29.79
41.6 41.4 40.9 40.9 42.5 43.0
63.7 64.1 63.8 63.5 63.5 63.7
26.24 25. 45 25.60 25. 38 26.30 26. 72
57.4 55.6 56.8 56.2 56.8 57.4
24.28 24.42 24.77 25. 85 25. 81 25. 59
38.2 36.5 36.9 39.7 40.9 40.2
75.9 75.7 75.2 75.2 77.0 78.9
28.92 27.56 27. 59 29. 69 31.29 31.46
40.9 39.5 41.4 43.1 43.1 45.3
61.6 62.9 62.8 63.1 63.0 62.9
24.88 24.54 25.40 26. 78 26.86 28.21
41.9 43.0 44.1 42.9 42.7 41.6
57.2 58.3 60.7 63.1 63.2 63.0
23.95 25.07 26. 76 27.11 26. 96 26.22
36.7 38.9 39.2 38.1 38.4 37.0
77.5 80.0 83.5 85.8 87.0 87.4
28.21 30.67 32.43 32.47 33.19 32.00
42.7 44.0 45.3 45.2 44.4 44.9
62.3 62.6 62.6 62.9 64.8 64.3
26.29 27.08 27. 87 28.32 28.33 28.37
40.4 39.7 39.5 37.0 32.5 35.2
63.1 63.6 63.8 62.6 62.7 63.7
25. 53 25. 25 25.20 23.17 20.43 22.40
34.7 35.8 34.9 37.6 35.0 31.8
89.0 88.2 89.4 89.4
30. 89 31.71 30. 57 33. 37 31.03 27.40
39.7 40.6 38.8 41.2 40.4 40.3
70.2 70.1 69.6 70.0 70.9 70.7
27.25 28.14 26.62 28.60 28.44 28.39
1935
1936
22.21
1937
See f o o t n o t e s a t e n d of t a b l e .
Digitized for FRASER http://fraser.stlouisfed.org/ Federal Reserve Bank of St. Louis
GENERAL
67
TABLES
5.-—Average hours worked per week, average hourly earnings, and average weekly earnings in manufacturing industries, by years, 1940, and months, January 1985 to December 1940 Continued
TABLE
Machinery, not including transportation equipment—Continued Typewriters and parts
Year and month
Transportation equipment
"Transportation" group
Aircraft
Average Average Average Average Average Average Average Average hours Average hours hours hourly weekly hourly weekly hourly weekly worked earnings earnings worked earnings earnings worked earnings earnings per week per week per week 1938
Cents 64.6 65. 7 66.0 65.1 64.9 65.1
$17.69 21.04 19. 58 19. 27 19.19 19. 56
29.9 30.1 30.7 32.8 31.9 33.4
Cents 88.3 88.5 88.5 88.6 88.4 88.8
$26.23 26. 86 27.05 28. 94 28.14 29.64
39.4 40.4 40.3 39.8 40.3 39.6
Cents 71.3 71.1 70.9 71.4 72.1 72.6
$27. 85 28.52 28. 33 28. 20 28.81 28.66
65.0 64.3 64.6 64.6 64.4 64.1
19.02 19. 97 22.85 24. 55 24.39 24.46
33.3 35.2 36.4 37.6 37.1 36.4
88.7 88.9 89.7 90.0 90.7 90.1
29. 43 31.22 32. 64 33. 88 33.64 32. 72
39.4 39.6 39.9 40.2 40.2 42.0
72.5 72.5 73.6 74.1 75.1 76.5
28.27 28. 49 29.28 30.20 29.81 31.72
35.4 36.6 39.0 38.5 37.1 34.5
63.7 64.1 65.7 65.3 66.0 64.0
22.60 23. 45 25. 63 25.13 24. 49 22.13
35.0 34.3 34.4 35.5 34.9 35.6
89.8 89.7 90.0 89.7 89.4 89.5
31.32 30. 69 30.81 31.80 31.04 31.73
41.7 41.8 42.1 40.8 41.2 42.0
76.8 75.8 76.1 74.6 73.7 73.6
31.61 31.18 31.38 30.09 30.04 31.17
36.0 37.8 38.5 39.2 37.9 36.6
64.0 64.1 63.8 63.5 63.5 64.0
23.05 24. 24 24. 58 24.88 24.09 23. 41
35.1 38.1 37.3 38.1 37. 6. 38.5
88.6 88.8 89.5 89.1 88.6 90.1
31.06 33.71 33.25 33.82 33. 26 34. 51
40.7 42.0 40.0 41.8 41.8 42.3
73.7 73.8 74.2 74.8 74.8 73.5
29. 94 30.59 29.07 30.30 30. 65 29. 39
34.9 35.6 36.6 37.2 38.1 37.7
63.7 64.4 64.7 64.7 64.9 65.6
22. 27 22. 96 23. 72 24.06 24. 73 24. 75
37.4 37.6 38.4 38.3 36.7 38.1
89.4 89.6 90.0 90.2 90.2 90.5
33. 23 33.47 34.39 34. 40 32. 83 34.21
41.5 41.1 42.1 41.4 41.2 42.7
74.1 73.0 73.4 73.3 73.2 74.2
29.21 28. 73 29. 96 29. 75 29. 69 31.18
38.5 39.7 42.1 45.8 45.5 41.7
65.1 65.6 65.2 68.9 68.4 65.4
25.05 26.04 27. 43 31.52 31.13 27.31
36.2 39.9 40.0 41.6 40.4 40.2
89.1 89.7 90.0 89.8 90.2 90.0
31.88 35. 41 35. 60 37. 39 36. 39 35.96
42.0 43.8 44.6 44.3 44.3 44.6
73.8 73.9 73.8 75.0 75.5 75.7
30. 48 31.79 32. 37 32. 62 32.93 33.25
January February March___ April May June.
27.3 32.0 29.6 29.5 29.5 30.0
July August September October November December
29.3 31.0 35.4 38.0 37.9 38.1
January February March April May June July August September October November December
1939
1940 January February March April May. June July August September. October November December
_
See footnotes at end of table.
Digitized for FRASER http://fraser.stlouisfed.org/ Federal Reserve Bank of St. Louis
68
HOURS
AND
EARNINGS
IN
THE
UNITED
STATES
5 . — A v e r a g e hours worked per week, average hourly earnings, and average weekly earnings in manufacturing industries, by years, 1932 to 1940, and by months, January 1935 to December 1940 1 —Continued
TABLE
Transportation equipment—Continued Cars, electric- and steam-railroad
Automobiles Year and month
Locomotives
Average Average Average hours Average Average hours Average Average hours Average Average worked hourly weekly worked hourly weekly worked hourly weekly earnings earnings earnings earnings per week per week per week earnings earnings
1932 1933 1934 1935 1936-_
31.3 35.2 33.3 37.1 38.5
Cents 68.0 59.3 70.0 73.9 77.4
$21. 27 20 96 23.31 27. 41 29. 75
33.9 35.2 38.1
59.0 62.0 62.2
1937 1938 1939 1940
35.9 32.9 35.5 37.9
89.1 92.5 92.9 94.9
31.94 30. 45 32. 90 35. 88
39.4 34.8 36.0 38.0
35.3 39.7 39.7 40.4 37.3 34.2
71.0 71.1 71.6 72.4 72.7 76.2
25. 26 28. 20 28. 38 29. 24 27.12 26. 02
33.3 33.0 34.1 37.1 40. 5 38.0
76.2 76.7 75.7 75.2 75.2 75.2
35.6 32.4 36. 5 40.9 41. 1 39.8
Cents
$18. 18. 19. 21. 23.
Cents
51 85 99 77 74
34.9 34.4 40.4
61.9 63.0 63.3
$22. 72 18. 71 21. 65 21.70 25. 54
71.5 74.3 74.1 75.0
28.14 25. 82 26.71 28. 47
43.7 34. 2 36.7 39.4
72.5 77.2 77. 1 79.3
31.79 26. 43 28. 33 31.25
33.0 34.6 36.0 37.2 36. 6 33.2
60.2 61.4 62.0 63.3 63. 9 63.2
19. 87 21.16 22. 24 23. 43 23.37 20.91
34.4 34.2 34.1 34.7 33.8 32.9
62.0 62.5 63.9 64.1 64.8 65.4
21.31 21.38 21. 77 22. 22 21.91 21. 54
25. 38 25. 38 25. 76 27. 76 30. 33 28. 59
31.5 33.6 34. 2 30. 4 35.5 37.3
61.7 61.1 59.8 60.1 61.6 62.4
19. 32 20. 43 20. 46 21.86 21.83 23. 25
31.0 31.5 33.4 36.8 36.4 38.7
63.1 63.7 63.8 62.0 60.9 60.9
19. 57 20. 08 21.29 22. 84 22. 16 23.61
75.8 76.0 76.6 77.1 76.9 77.4
26. 93 24. 66 27. 96 31.44 31. 50 30. 75
36.2 36.1 37. 2 38.1 38.0 38.7
61.9 62.5 62.1 62. 5 61. 5 60.8
22. 40 22. 58 23. 12 23.80 23. 37 23. 52
33.3 36. 5 37.4 39.0 39.5 39.4
61.3 61.8 62.1 62.3 63.1 63.4
20. 39 22. 56 23.18 24. 26 24.89 24.99
38.4 36. 2 36.9 40.0 41.5 40.4
77.7 77.7 77.0 76.6 78.6 80.4
29. 74 28.11 28. 34 30. 53 32. 52 32. 40
38.1 38.6 36.4 40.2 38.7 40.0
61.0 60.4 62.3 62.8 63. 2 64.7
23. 23 23. 52 22. 80 25. 25 24. 50 25.83
40. 2 41.9 42.0 42.3 42.9 43.6
63.6 63. 7 64.1 63.4 63.6 64.4
25. 55 26. 72 26. 92 26. 82 27.31 28.10
36.2 38.9 38.8 37.5 38.0 36.1
79.0 82.2 86.6 88.8 90.3 90.7
28. 50 31. 67 33. 59 33.27 34.31 32. 67
39.9 39.7 41.2 41.3 40.0 40.1
64.9 65.3 66.8 69.9 70.3 72.7
25. 90 25. 96 27. 51 28. 85 28.16 29.12
41.5 43.5 43.9 43.9 44.4 46.9
65.3 66.0 66.6 69.6 70.3 71.1
27. 07 28.81 29. 39 30. 56 31. 50 33.49
33.8 34.8 34.1 37.2 34.2 29.9
93.3 92.6 91.4 92.3 91.9 91.4
31.50 32. 26 31.18 34. 34 31.40 27. 34
38.5 39.4 37.4 38.9 38.5 36.9
72.7 73.3 74.7 74.8 76.9 75.7
27. 97 28. 84 27. 89 29.13 29. 58 27. 93
44.0 43.6 43.7 44.0 41.4 43.5
70.9 74.0 76.1 77.4 78.5 80.8
31.16 32. 25 33. 28 34. 08 32. 47 35.15
1985 January February March __ April May June. July AugustSeptember October November December
___
...
1936 January February March April May June
_
July August. September October November December 1937 January February March April May June July August September October November December
.
See footnotes at end of table.
Digitized for FRASER http://fraser.stlouisfed.org/ Federal Reserve Bank of St. Louis
GENERAL
69
TABLES
TABLE 5.—Average hours worked per week, average hourly earnings, and average weekly earnings in manufacturing industries, 6?/ years, 1932 to 1940, and 6?/ months, January 1935 to December 1940 1 —Continued Transportation equipment—Continued Cars, electric- and steam-railroad
Automobiles Year and month
Locomotives
Average Average Average Average Average Average Average Average Average hours hours hours hourly weekly hourly weekly hourly weekly worked earnings earnings worked earnings earnings worked earnings earnings per week per week per week 1938 27.6 27.7 28.4 31.4 30.0 31.9
Cents 91.5 91.6 91.9 92.0 92.0 92.5
$25. 27 25. 34 26.10 28. 83 27. 65 29. 49
35.4 36.1 35.4 34.2 34.6 35.0
Cents 74.6 75.6 75.5 74.8 74.2 74.6
$26.41 27. 25 26. 72 25. 56 25. 67 26.14
36.4 38.4 37.6 34.5 33.8 32.7
Cents 77.3 78.4 77.5 77.4 78.0 76.8
$28.14 30. 09 29. 09 26. 68 26. 38 25. 08
31.8 34.6 36.3 37.7 37.5 36.0
93.0 93.6 93.3 92.8 93.2 92.4
29. 56 32. 33 33. 81 34. 98 34. 89 33. 22
32.9 34.7 34.9 34.7 32.7 35.5
74.3 72.8 73.0 73.9 74.0 73.0
24. 45 25. 26 25. 48 25. 62 24.21 25. 96
32.1 31.1 29.0 29.2 31.7 32.9
76.4 75.2 76.4 75.9 76.5 77.0
24. 51 23. 37 22.13 22.14 24. 30 25. 34
34.3 33.3 33.3 34.9 33.5 34.3
92.1 92.4 92.6 92.8 93.1 93.3
31.55 30. 80 30. 87 32. 33 31.18 31.94
34.5 35.5 35.4 34.6 36.7 36.5
73.0 73.2 74.8 75.3 74.0 73.8
25. 21 26. 00 26. 44 26. 06 27. 21 26.94
33.9 31.5 34.4 35.2 36.6 37.7
77.7 76.9 77.5 77.1 77.0 77.0
26. 38 24. 22 26. 67 27.14 28.15 29. 01
34.0 37.7 36.9 37.7 37.2 38.1
92.8 93. 5 93.4 92.2 92.2 94.0
31.50 35. 15 34 41 34. 75 34. 25 35.81
32.8 36.2 34.8 37.5 37.1 38.6
74.2 74.4 74.6 76.8 72.8 72.9
24. 36 26. 90 25. 96 28. 85 27. 03 28.12
37.2 37.6 37.3 38.5 38.0 38.6
76.3 76.4 76.6 77.3 77.8 78.1
28. 38 28. 72 28. 57 29. 75 29. 54 30.12
January February _ _. . March.. _ April May June ...
36.7 37.1 37.7 37.9 35.4 37.0
93.4 93.8 94.4 94.5 94.7 95.4
34. 34. 35. 35. 33. 35.
38.5 39.1 39.4 37.4 37.2 36.7
72.9 73.8 75.9 75.7 75.4 75.3
28. 06 28. 83 29. 92 28. 36 28. 05 27. 68
37.7 37.4 36.3 36.7 37.4 38.2
78.2 77.3 77.4 77.9 78.5 78.9
29. 49 28. 93 28. 08 28.61 29. 35 30.12
July August. September OctoberNovember December
34.0 38.8 38.6 41.3 39.8 38.2
94.9 95.6 95.0 95.1 95.7 95.4
32. 26 37.06 36. 67 39. 25 38.05 36. 49
35.0 38.4 38.0 37.7 7 37. 9 39.8
75.5 75.3 76.3 74.3 7 73. 5 75.6
26. 43 28. 87 28. 94 28. 12 7 27. 73 30. 08
39.1 38.6 41.3 41.4 40.2 41.9
79.2 79.2 79.9 79.2 80.6 81.1
30. 99 30. 62 32.98 32. 79 32.43 34.00
January . . . February. March April. May June July August. September October November December.
-
1939 January February March _ April May June
_
.
July August. September October November December 1940
__
See footnotes at end of table.
Digitized for FRASER http://fraser.stlouisfed.org/ Federal Reserve Bank of St. Louis
28 80 53 78 47 28
70
HOURS
AND
EARNINGS
IN
THE
UNITED
STATES
5 . — A v e r a g e hours worked per week, average hourly earnings, and average weekly earnings in manufacturing industries, by years, 1932 to 1940, 6?/ months, January 1935 to December 1940 1 —Continued
TABLE
Transportation equipment—Continued Shipbuilding
Year and month
Nonferrous metals and their products "Nonferrous" group
Aluminum manufactures
Average Average Average Average Average hours hours Average Average hours Average Average worked hourly weekly worked hourly weekly worked hourly weekly per week earnings earnings per week earnings earnings per week earnings earnings
1932 1933 19341935 1936
34.4 31.0 31.0 32.8 35.7
Cents 63.5 60.8 72.8 75.0 76.0
$23. 62 20.81 22. 80 24.77 27. 35
38.8 41.1
1937 1938 1939 1940
-
37.1 36.6 38.0 39.8
81.4 83.7 83.5 87.0
30. 51 30.91 31.91 34.81
January February. _ _ . _. March . _ ___ __ April May -. June
31.7 31.8 32.0 32.1 33.4 32.4
74.4 73.7 75.3 74.0 74.8 74.1
July August. September October November... December
32.6 32.8 32.9 33.5 32.7 34.3
Cents
Cents
55.5 57.0
$17. 57 17.69 19. 57 21.63 23. 57
39.0 41.3
54.2 57.0
$15. 64 16.85 18. 24 21.09 23.52
39.9 35.6 39.0 40.0
65.4 67.1 67.7 70.8
26.09 23.88 26. 36 28. 39
40.7 36.7 39.2 40.4
65.9 69.6 70.1 73.3
26. 78 25. 50 27.55 29.64
23. 57 23. 61 24.48 23.86 25. 04 24. 33
37.0 38.4 38.1 37.7 37.2 37 2
55. 0 54.8 55. 5 55.7 55.9 56.2
20.19 21.17 21.18 21.02 20. 95 21.08
36.8 39.0 39.5 39.4 38.8 37.7
54.5 53.8 53.8 53.9 53.9 53.9
19. 47 20.81 21.25 21.25 20. 91 20. 34
73.3 73.9 75.5 75.9 76.4 77.4
24.15 24. 64 24.98 25. 57 25. 35 26.86
36.2 38.3 39.7 41.7 41.1 41.8
56.2 55.6 55.4 55.0 55.2 55.5
20.45 21.45 22.14 23.05 22.84 23.33
34.6 39.1 39.1 41.2 40.7 41.0
54.6 53.9 54.5 54.1 54.7 54.5
18. 90 21.08 21.35 22. 28 22. 47 22. 58
34.6 34.9 35.9 36.2 36. 7 36.7
76.0 75.8 74.5 74.9 74.9 75.1
26. 56 26. 49 27. 03 27.60 27. 86 27. 57
39.5 39.3 39.6 39.5 40.2 40.4
56.0 55.9 56.1 56.4 56.9 56.8
22.19 22.11 22. 39 22. 42 22. 96 22. 95
40.1 40. 3 40.6 40.2 40.4 40.3
55.2 56.1 55.9 56.0 56. 9 56.5
22.13 22. 60 22. 74 22. 59 23.00 22. 79
35.9 35.4 35.0 36.2 35.8 35.0
76.1 75.9 76.1 76.8 77.1 79.3
27. 55 27. 06 26. 84 27. 78 27. 70 27. 97
39.5 41.4 41.6 43.7 43.9 43.4
56.8 56.5 57.4 57.5 57.8 59.0
22. 64 23. 32 23.95 25. 28 25. 48 25. 80
40.3 41.6 40.4 42.4 43.3 43.3
56.0 56.2 57.1 58.1 58. 4 58.6
22. 53 23.41 23.09 24.59 25. 24 25. 36
35.9 35.5 38.0 37.9 37.5 37.6
78.2 78.3 78.5 81.6 81.0 80.3
28. 40 27.47 29. 99 31.06 30. 79 30. 57
41.2 42.0 42.7 42.0 40.8 40.2
60.3 60.7 62.8 64.8 65.5 66.4
24.90 25. 54 26. 88 26. 46 26. 89 26.95
41.5 43.4 53.6 42.6 42.2 40.2
60.2 59.7 62.5 63.5 66.6 67.9
24.99 25.92 27. 24 27.05 28. 03 27. 23
36.9 38.2 35.8 37. 3 36.9 37.9
81.6 81.7 83.2 83.0 83.8 85.0
30.22 31.44 30. 34 31.49 31.13 32. 79
38.5 39.7 39.5 39.8 37.2 35.0
67.2 66.9 67.3 67.4 67.4 68.0
26.02 26. 74 26. 68 26.74 25.04 23. 84
39.0 40.8 39.2 40.3 38.9 36.3
68.1 67.9 68.2 70.7 68.4 69.0
26.53 27.68 26. 69 28.41 26. 57 25. 04
1935
1936 January February March— April May June July August September.. October November December
-_-
_ __
1937 January February March— April May June July August September. October. November December
.
See footnotes at end of table.
Digitized for FRASER http://fraser.stlouisfed.org/ Federal Reserve Bank of St. Louis
GENERAL
71
TABLES
5.-—Average hours worked per week, average hourly earnings, and average weekly earnings in manufacturing industries, by years, 1932 to 1940, and by months, January 1935 to December 1940 1 —Continued
TABLE
Transportation equipment—Continued Shipbuilding
Year and month
Nonferrous metals and their products "Nonfcrrous" group
Aluminum manufactures
Average Average Average Average Average Average Average hours hours hours Average Averasre hourly weekly worked hourly weekly worked hourly weekly worked earnings earnings earnings earnings per week per week per week earnings earnings 1938 36.4 36.2 37.1 36.4 37.0 37.3
Cents 84.2 84.3 83.2 84.2 82.7 83.3
$31. 21 31.15 31.22 31.57 30. 92 31.61
33.3 33.6 33.9 32.6 33.8 33.3
Cents 68.5 68.1 68.2 67.7 67.2 67.2
$22. 87 22. 87 23.08 22.12 22. 80 22.38
34.5 35.5 37.1 35.0 35.2 33.4
Cents 69.7 69.2 69.7 70.1 69.8 70.0
$23.99 24. 55 25. 87 24. 54 24. 55 23. 39
37.0 35.9 36.5 36.9 34.5 37.5
83.1 83.6 83.7 83.2 83.8 84.7
30. 90 29. 99 30. 60 30. 75 29.05 31.87
34.1 36.3 38.0 39.7 38.7 38.6
66.7 66.6 66.2 65.9 66.2 67.0
22. 79 24.13 25.14 26. 06 25. 70 25.81
33.4 37.0 38.6 39.8 40.1 39.1
70.8 69.8 69.7 69.1 68.1 69.8
23.60 25. 82 26. 92 27. 48 27. 32 27. 29
January February March April, May__ June..
37.5 37.6 37.9 37.6 38.9 38.5
83.7 83.3 83.8 83.1 82.1 83.2
31.60 31.65 31.78 31.22 32. 29 32. 53
37.3 38.3 38.3 37.2 37.7 38.2
66.7 66.6 66.7 67.0 67.3 67.1
24. 85 25. 48 25. 60 24. 90 25. 38 25. 52
38.5 39.6 39.6 39.4 39.1 39.0
70.2 69.3 69.1 69.5 69.2 70.1
27. 03 27.42 27. 36 27.33 27.10 27. 41
July August September October November December
37.6 38.1 37.4 38.3 37.9 38.2
83.2 82.9 82. 5 84.2 84.4 85.3
31.71 31.69 31.41 32. 26 31. 85 32. 73
37.4 39.0 39.9 41.4 41.0 40.9
67.2 66.8 67.4 69.1 69.0 70.3
25.11 25. 98 26. 69 28. 58 28. 26 28. 67
34.4 38.3 39.6 41.0 40.5 41.0
72.3 70.1 70.3 69.9 70.1 71.4
24. 95 26. 88 27.94 28. 80 28. 41 29. 33
38.2 37.1 39.0 38.5 39. 5 39.2
84.6 • 85.7 86.0 85.9 86.2 86.9
32. 32 31. 53 33. 68 33. 25 34.20 34.17
39.2 38.4 38.9 38.6 38.8
39. U
• 70.1 69.6 69.7 70.0 70.1 70.2
27. 37 26. 65 26. 96 26. 76 27.02 27.25
39.6 40.1 39.9 40.3 40.2 40.0
71.6 71.4 71.7 72.4 72.8 72.7
28. 46 28. 69 28.62 29.17 29. 25 29. 08
39.3 40.3 40.9 41.7 38.5 42.6
86.2 86.4 87.4 87.7 s 88.4 89.5
34.03 34.88 36.08 36.93 s 34.46 38.37
38.6 40.1 41. 5 42.0 41.4 42.7
70.1 70.3 71.0 71.2 72.7 73.8
27.12 28.18 29. 38 30.00 30. 02 31.63
36.6 40.4 41.4 41.7 41.7 42.3
73.4 74.2 74.6 74.2 74.5 74.9
26. 90 29. 94 30.88 30. 97 31.04 31.70
January _ February March April May... June July August. September October November December
..
1939
.
19/,0 January February March April May June July... August September October November December
_
... .
See footnotes at end of table.
Digitized for FRASER http://fraser.stlouisfed.org/ Federal Reserve Bank of St. Louis
72
HOURS
AND
EARNINGS
IN
THE
UNITED
STATES
5.—Average hours worked per week, average hourly earnings, and average weekly earnings in manufacturing industries, by years, 1932 to 1940, and by months, January 1935 to December 1940 u—Continued
TABLE
Nonferrous metals and their products—Continued
Year and month
Brass, bronze, and copper products
Clocks, watches, and timerecording devices
Jewelry
Average Average Average Average Average Average Average Average hours hours hours hourly weekly hourly weekly hourly worked earnings earnings worked earnings earnings worked earnings per week per week per week
32.1 35.6 35.7 39.3 41.6
Cents 49.4 49.3 56.3 58.2 59.5
39.6 34.6 39.6 41.3
$17. 26 18.07 20.07
Cents
$14. 29 15. 26 18.08 19. 51 21.50
24. 75
37.7 38.2 39.9 41.9
41.9 47.3 48.5 50.5
69.7 71 9 72.3 77.0
27. 59 24.81 ?8. 57 31.67
40.5 33.0 37.9 39.4
56.2 58.9 58.7 59.9
22. 19. 22. 23.
38.4 39.2 38.8 38.8 37.8 37.7
57.0 57.1 58.5 58.5 58.5 58.7
22. 36 22. 57 22. 62 22.13 22.13
21.81
34.7 38.5 39.4 38.0 37.2 38.3
47.9 47.7 48.0 48.7 48.8 49.1
16.84 18.49 19.00 18.61 18.41 19.07
37.0 38.7 39.7 41.3 41.2 41.8
58.7 58.7 58.5 57.7 57.5
21. 96 22.80 23.28 24. 21 23. 77 24.04
35.7 39.3 41.4 44.2 45.0 44.0
49.5 49.1 48.1 48.2 48.3 48.2
17.97 19. 52 20.19 21.53 21.74 21.45
40.7 40.2 39.7 40.2 41.2 40.9
58.1 58.0 58.3 58.5 58.7 58.6
23. 62 23. 38 23. 21 23. 57 24.19 24.04
38.0 40.6 40.6 39.1 39.3 40.8
48.8 48.6 49.4 50.5 51.5 51.6
19.52 20.40 20.48 20. 34 20. 61 21.01
36.4 35.6 35.6 35.7 36.5 37.0
40.4 42.3 42.0 43.4 43.3 44.0
58.5 58.9 60.6 60.7 60.8 62.1
23. 67 24. 86 25. 40 26. 40 26.28 27. 31
39.8 42.5 42.8 46.7 46.6 43.1
50.9 51.0 50.8 50.4 50.5 51.2
21.68 20.85 21.91 23. 31 23. 92 23.08
36.1 40.8 42.4 45.0 41.7 41.9
42.8 43.7 43.7 42.9 41.1 40.6
63.3 64.3 66.6 68.6 69.1 71.4
27.05 28.11 29.06 29. 43 28. 43 28. 91
41.8 42.6 43.1 42.0 40.7 40.2
52.1 53.2 54.4 56.1 56.0 56.0
21.62 22.68 23. 47 23. 56
37.8 38.6 39.4 38.5 38.7
38.2 38.7 38.1 36.7 33.7 31.9
72.5 73.0 73.4 73.0 73.4 73.0
27. 58 28. 21 27.94 26. 76 24. 77 23. 36
39.8 40.2 41.2 38.7 35.6
57.4 57.0 58.2 58.5 58.3 59.3
21.97 22.70 23. 39 24.10 22. 54
See f o o t n o t e s a t end of table.
Digitized for FRASER http://fraser.stlouisfed.org/ Federal Reserve Bank of St. Louis
22. 86
74 44 27 64
22. 82
22. 51
21.12
39.1 39.4 38.1 39.3 39.1
37.8 39.8 40.9 43.2 40.3 38.4
GENERAL
73
TABLES
TABLE 5.—Average hours worked per week, average hourly earnings, and average weekly earnings in manufacturing industries, 6?/ years, 1932 to 1940, and 6?/ months, January 1935 to December 1940 1 —Continued Nonferrous metals and their products—1Continued Brass, bronze, and copper products
Year and month
Clocks, watches, and timerecording devices
Jewelry
Average Average Average Average Average Average Average Average Average hours hours hours hourly weekly worked hourly weekly worked worked hourly weekly per week earnings earnings per week earnings earnings per week earnings earnings 1938 30.8 30.6 31.6 31.9 33.4 32.6
Cents 73.8 74.3 74.3 72.0 71.4 70.9
if 22.73 22. 77 23. 44 22. 95 23. 78 23.14
33.8 33.6 32.0 27.2 28.5 27.9
Cents 60.5 60.0 60.6 61.3 60.5 60.0
$20. 48 20.19 19.41 16.70 17. 25 16. 75
36.3 36.9 37.0 33.9 33.9 35.2
Cents 61.9 60.3 59.5 60.7 61.2 60.9
J22. 52 22. 26 21.85 20. 58 21.00 21. 82
34.7 35.9 36.9 38.5 38.3 38.2
71.4 71.5 71.3 70.9 71.0 70.7
24. 74 25. 63 26. 32 27.28 27.14 26. 92
29.5 33.0 36.3 37.7 38.1 36.9
57.8 57.8 56.9 57.5 57.4 57.6
17.11 19.11 20.66 21.66 21.88 21.23
36.2 38.6 41.0 45.2 39.2 40.8
58.6 57.7 57.4 56.3 57.6 59.2
21.49 22. 70 23.87 25. 89 22. 81 24.11
36. 9 37.6 38.3 37.6 38.5 38.8
70.1 70.4 70.5 70.4 70.8 70.7
25. 79 26. 42 26. 98 26. 43 27.18 27. 32
35.0 38.0 37.1 36.2 35.6 36.4
58.2 58.5 58.3 58.7 59.1 58.5
20. 41 22. 25 21.63 21.24 21.03 21.30
38.7 39.2 39.3 36.7 37.3 38.8
58.1 57.4 57.9 59.1 59.9 59.1
22. 77 22. 82 23.03 21.90 22. 46 23.12
38.6 39.5 40.9 42.6 41.7 41.8
71.5 71.0 71.4 75.7 75.3 75.8
27. 53 28.00 29.15 32. 21 31.39 31.63
36.3 39.2 39.1 41.4 40.4 38.9
58.7 58.4 58.4 59.0 59.1 59.3
21.34 22.88 22.86 24. 39 23. 84 23.09
37.7 39.7 40.8 41.5 41.0 40.1
57.9 56.8 57.9 58.2 57.7 60.7
22.20 22.89 23. 54 24.50 23. 94 24. 63
January February March April- _ M ay June
40.5 39.2 39.0 38.6 38.8 39.8
74.9 74.3 74.8 74.9 75.0 75.5
30.28 28. 96 29.01 28. 74 29.00 29.95
38.4 38.5 38.8 38.0 38.9 37.5
59.2 59.6 59.6 59.9 59.7 59.8
22. 75 22. 96 23.14 22. 74 23. 25 22. 44
37.7 35.5 38.2 37.0 37.7 38.7
60.2 59.6 59.0 59.9 59.9 59.5
22.89 21.30 22.87 22. 44 22. 84 23. 35
July August September October November December
40.4 41.4 42.7 43.4 42.7 44.4
76.2 76.5 77.5 77.7 80.2 80.8
30. 73 31.55 32. 97 33. 64 34.17 35. 80
37.6 39.6 40.3 42.0 41.6 40.8
59.5 59.7 59.4 60.3 60.6 61.0
22. 42 23. 67 23. 98 25. 35 25. 20 24.88
38.1 39.4 41.8 41.8 39.6 41.5
58.1 57.9 58.2 9 56. 2 57.4 59.6
22.49 23.19 24. 45 9 23. 78 22.97 25.00
January February March April May June
_
July August.. _ September October November December 1939 January February, March April May . June July August. September October.-. November December-
. _
_
_
1940
See footnotes at end of table.
Digitized for FRASER http://fraser.stlouisfed.org/ Federal Reserve Bank of St. Louis
74
HOURS
AND
EARNINGS
IN
THE
UNITED
STATES
5 . — A v e r a g e hours worked per week, average hourly earnings, and average weekly earnings in manufacturing industries, by years, 1932 to 1940, and by months, January 1935 to December 1940 1 —Continued
TABLE
Nonferrous metals and their products—Continued Lighting equipment
Silverware and plated ware
Smelting and refining— copper, lead, and zinc
Year and month Average Average Average hours Average Average hours Average Average hours Average worked hourly weekly worked hourly weekly worked hourly per earnings earnings earnings earnings per per earnings week week week Cents 36.2 36.6 37.2 39.0
49.1 54.6 58.3 58.4
$19. 51 18.06 20.12 21.85 22.90
38.4 41.6
55.1 55.6
$19.18 17.61 19.02 21.14 23.05
38.9 33.7 37.1
64.1 67.6 69.3 70.1
24. 85 22. 74 25. 73 27. 29
40.2 36.7 40.7 40.6
63.1 64.0 64.3 65.5
25. 27 23. 48 26. 03 26.46
41.3 38.2 38.2
January February March April May June
36.4 37.3 36.3 36. 4 34.8 36.3
57.4 55.6 55.5 56.2 55.9 56.4
20. 91 20. 51 20.16 20. 46 19. 51 20. 50
34.4 37.2 37.2 34.7 37.6 37.7
57.3 57.8 57.7 58.3 57.8 58.3
19. 87 21.67 21.65 20. 35 21.78 21.96
37.7 38.6 38.1 38.5 38.3 37.8
July August September.. October November.. December..
36.4 38.8 39.2 41.7 41.9 42.6
55.4 54.7 53.7 53.3 54.2 54.7
20. 23 21.25 21.05 22.19 22. 70 23.09
35.0 35.5 38.0 39.7 40.0 39.3
59.4 58.9 59.0 58.5 58.1 58.8
20. 75 21.06
37.8 37.8 38.8 39.7 40.3 42.1
January _ _ February. March April May June
40.9 38.5 38.9 40.2 41.6 41.7
54.9 54.9 55. 7 56.4 55.4 55.6
22. 34 21.19 21.69 22. 65 22. 96 23. 04
35.2 35.2 37.9 36.7 35.9 35.0
59.3 58.8 58.1 57.3 59.1 59.7
July August September.. October November.. December..
39.2 39.9 41.6 43.1 45.4 44.2
56.6 54.5 54.1 53.8 56.0 58.7
22.11 21.72 22. 40 23. 17 25.31 25. 91
33.6 37.5 38.9 46.2 46.6 45.8
60.5 57.6 59.1 57.5 57.4 58.1
20. 36 21. 66 22. 90 26. 88 26. 76
40.6 41.1 41.1 41.9 43.5 42.4
January. _ February. March April May June.
40.8 39.8 42.5 41.4 39.6 38.5
58.4 58.7 62.4 64.3 65.0 64.8
23. 73 23. 36 26. 45 26. 52 25. 66 24.91
37.7 39.6 41.7 41.3 41.0 39.8
61.5 60.8 61.2 61.8 62.9 63.9
23.08 24.12 25. 40 25. 32 25. 65 25. 50
40.7 41.7 42.7 42.3 42.2 41.8
July August SeptemberOctober November.. December..
37.2 37.4 39.1 39.9 37.9 31.8
65.6 64.7 65.4 65.7 66.5 67.0
24. 32 24.10 25. 50 26.18 25. 22 21.22
38.6 40.2 43.2 42.4 38.8 37.7
64.0 63.9 64.5 64.2 64.1 64.1
24. 57 25. 56 27. 55 27.09 24.86 24.13
40.0 42.3 40.2 41.7 39.9 40.2
1932_. 1933.. 1934.. 1935.. 1936.. 1937... 1939.. 1940..
37.6 38.9 41.5
1935
See footnotes at end of table.
Digitized for FRASER http://fraser.stlouisfed.org/ Federal Reserve Bank of St. Louis
22. 62
23. 43 23. 45 23. 34
20. 95
20. 80 22. 16
21.13 21.38 20. 92
26. 62
40.0 40.1 42.0 40.8 41.6 42.3
GENERAL
75
TABLES
TABLE 5.—Average hours worked per week, average hourly earnings, and average weekly earnings in manufacturing industries, 6?/ years, 1932 to 1940, and 6?/ months, January 1935 to December 1940 1 —Continued Nonferrous metals and their p r o d u c t s - Continued Lighting equipment
Silverware and plated ware
Smelting and refining— copper, lead, and zinc
Year and month Average Average Average hours Average Average hours Average Average hours Average Average weekly worked hourly weekly worked hourly worked hourly weekly earnings earnings per per earnings earnings per earnings earnings week week week 1938 January February March April May June
___ __.
July August September October November _ _ _ _ _ December
Cents $21.11 63.6 63.2 21.80 63.1 ' 22.68 21.00 63.0 63.0 21.41 63.4 20. 85
28.8 30.5 31.1 29.2 31.4 32.1
Cents 67.9 67.5 67.6 68.0 67.2 68.8
39.1 38.7 37.8 38.1 39.1 38.4
Cents 68.9 68.5 68.5 68.1 67.6 68.2
$26.92 26. 52 25. 91 25. 96 26. 42 26.14
31.5 35.4 38.1 38.7 37.6 36.6
67.9 67.1 66.5 65.9 67.7 69.1
21.33 23. 73 25.31 25. 53 25.43 25. 26 •
31.7 35.9 39.5 41.5 42.4 43.3
64." 7 64.6 64.6 64.5 64.9 65.0
20. 55 23.13 25. 56 26. 77 27. 39 28.07
37.1 37.6 37.7 38.2 37.9 38.4
67.7 68.4 68.8 69.9 68.8 69.2
25.09 25. 72 25. 95 26. 34 26.03 26.58
35.2 37.6 35.9 33.2 35.1 35.6
69.3 69.5 69.2 69.9 70.1 69.7
24. 47 26.13 24. 89 23. 27 24.63 24. 79
38.8 40.1 41.4 39.0 39.3 38.5
63.7 64.1 64.8 63.4 63.7 64.0
24. 58 25. 56 26. 64 24.61 24. 80 24. 53
38.6 37.9 37.8 37.5 38.0 38.1
69.1 69.0 69.1 69.1 69.2 69.1
26.68 26. 27 26. 23 25.90 26. 29 26. 34
35.8 37.6 39.5 39.5 39.5 39.5
68.9 69.3 69.4 68.3 68.0 70.0
24. 66 26. 06 27.42 27. 03 26.84 27. 66
37.0 39.0 41.4 43.6 44.0 44.2
64.0 64.1 64.6 64.8 65.2 65.1
23. 44 24.88 26. 54 27.98 28. 52 28.72
37.5 38.2 36.9 38.5 39.1 39.6
69.5 69.8 70.0 70.7 71.2 71.7
26. 05 26. 64 25. 85 27. 20 27.80 28.36
36.2 36.5 38.5 38.1 38.3 36.9
70.6 70.5 71.5 71.7 71.0 70.9
25. 54 25. 68 27. 55 27. 32 27.21 26.19
39.1 38.1 38.7 39.5 38.6 36.5
63.3 63.7 64.1 65.1 65.1 64.7
24.74 24.18 24. 90 25. 60 25. 06 23.58
38.9 38.8 38.8 39.0 38.9 38.7
71.9 71.5 70.7 70.8 71.2 71.3
27. 94 27. 75 27. 44 27. 59 27. 71 27. 57
37.7 39.1 •40.8 40.7 41.1 40.7
69.3 69.4 69.3 69.5 io 68. 6 70.2
26.13 27.17 28. 26 28.28 io 28.18 28. 59
36.4 39.0 42.4 45.2 44.7 46.8
64.6 65.0 65.8 67.1 67.4 68.0
23.44 25. 25 27. 69 29.91 29. 91 31.62
38.2 38.4 39.1 38.3 38.3 40.0
71.5 71.2 71.8 72.7 74.3 75.0
27.29 27. 35 28. 05 27. 82 28. 47 29. 96
$19. 54 20. 61 21.03 19. 86 21.14 22.10
33.2 34.6 36.1 33.4 33.9 32.6
1QOQ luotf January February March. April May June..
__
•
___
July August-.September October November December
_
mo January _ February March April May June
_
July August September October November December
__ ___
See footnotes at end of table.
402097°—42
Digitized for FRASER http://fraser.stlouisfed.org/ Federal Reserve Bank of St. Louis
0
76
HOURS
AND
EARNINGS
IN
THE
UNITED
STATES
5 . — A v e r a g e hours worked per week, average hourly earnings, weekly earnings in manufacturing industries, by years, months, January 1985 to December 1940 1 —Continued
TABLE
and average and by
Lumber and allied products " L u m b e r " group
Furniture
Lumber, millwork
Year and month Average Average Average hours Average Average hours Average Average hours Average hourly weekly hourly weekly hourly worked worked worked earnings earnings earnings earnings per week per week per week earnings Cents
38.1 43.0
41.3 42.4
42.4 39.0 38.9 38.7
47.0 48.4 50.1 52.1
19. 95 18.95 19. 71 20.37
40.7 36.3 38.9 39.3
50.7 52.9 53.0 54.7
20. 50 19. 22 20.51 21.36
42.0 39.2 41.1 40.7
33.7 35.6 36.0 36.8 34.7 37.6
40.6 40.5 41.1 41.1 40.0 40.4
13.87 14. 59 14.97 15. 33 14.45 15.64
35.0 37.4 38.0 37.8 36.8 37.7
44.1 43.6 44.6 44.8 44.9 45.3
15. 68 16. 39 17. 03 16.94 16. 65 17.15
33.6 36.3 36.8 37.2 38.0 39.5
37.0 39.8 40.8 42.1 40.0 40.9
41.0 42.2 42.4 42.0 41.9 41.7
15. 30 16. 67 17. 34 17. 73 16.82 17.12
36.5 40.2 41.5 42.9 40.5 40.8
44.9 44.8 45.0 45.0 45.1 45.4
16. 54 18.13 18. 79 19. 37 18.43 18. 70
39.9 40.6 42.2 43.5 41.4 41.7
39.8 39.7 41.9 41.9 42.7 43.4
41.5 41.6 42.0 42.5 42.7 42.5
16. 54 16. 52 17. 59 17.89 18. 22 18. 50
38.2 39.5 40.1 40.0 40.3 42.1
45.2 45.4 45.6 46.0 45.8 44.9
17.27 17. 86 18. 25 18.31 18. 44 18.89
39.1 39.3 41.9 41.9 43.5 44. 1
41.9 44.3 44.2 45.5 44.5 44.5
42.3 42.5 42.5 42.8 42.6 42.7
17.70 19. 06 18. 79 19. 78 19. 32 19.49
41.1 44.1 44.0 46.2 45.3 45.2
45.1 45.2 44.8 45.3 46. 1 46.8
18. 55 19. 82 19.69 20.80 20. 76 21.11
42.1 44.4 43.6 45.8 45.4 45.7
41.9 43.9 44.4 44.8 43.6 44.1
42.6 43.0 44.9 46.6 47.1 48.7
17.98 18. 92 19. 96 20.79 20.58 21.22
41.8 43.5 43.1 43.0 41.3 41.0
47.6 48.0 48.8 49.7 50.3 51.0
19.69 20.69 20. 81 21.21 20.63 20.80
42.5 44.2 44.8 44.9 43.5 43.9
41.4 43.6 42.1 41.9 38.7 37.6
48.5 48.8 49.0 48.7 48.4 47.7
20.08 21.06 20. 68 20. 48 18. 78 17. 98
39.4 41.2 40.5 40.4 37.0 36.0
51.2 51.3 51.6 52.4 53.2 53.7
20.01 21.04 20.85 21.11 19.66 19.19
41.4 42.3 40.8 40.2 37.7 37.0
See f o o t n o t e s a t e n d of t a b l e .
Digitized for FRASER http://fraser.stlouisfed.org/ Federal Reserve Bank of St. Louis
Cents
$12. 86 12.63 14. 09 15. 92 18. 34
36.2 34.6 38.9 42.4
37.7 44.2 44.8 45.5
$14.02 13. 71 15. 37 17. 58 19. 25
39.5 43.2
GENERAL
77
TABLES
TABLE 5.—Average hours worked per week, average hourly earnings, AND average weekly earnings in manufacturing industries, 6?/ years, 1932 to 1940, and 6?/ months, January 1935 to December 1940 1 —Continued Lumber and allied products Lumber, millwork
Furniture
" L u m b e r " group Year and month
Average Average Average Average Average Average Average Average Average hours hours hours hourly weekly worked hourly weekly worked hourly weekly worked earnings earnings earnings earnings earnings earnings per week per week per week 1938 36.0 37.9 38.8 37.5 38.1 38.9
Cents 47.6 47.3 48.5 49.2 49.0 48.9
$17.06 17.97 18.77 18. 33 18. 60 18.94
31.7 34.8 35.2 33.2 33.2 35.0
Cents 53.9 53.4 53.8 54.4 54.3 53.1
$17.16 18. 56 18. 87 17. 92 17.89 18.42
34.1 36.9 37.8 37.7 38.9 39.0
Cents 55.6 53.8 54.3 54.1 55.1 54.9
$18. 98 19. 89 20. 56 20.43 21.39 21.36
37.6 41.7 41.5 41.9 38.6 38.9
47.5 48.5 48.3 47.9 49.0 49.2
17. 95 20. 30 20.43 20.19 19. 06 19. 36
34.3 39.3 39.9 40.5 37.9 39.5
52.2 52.2 52.4 51.8 52.4 52.6
17.87 20.43 21. 50 20. 77 19. 75 20. 60
39.4 41.8 41.6 42.4 39.7 40.2
54. 5 54.6 53.4 52.8 54.0 54.1
21. 52 22. 79 22.17 22.40 21.40 21. 71
January February March April May, June
37.9 38.5 38.5 38.2 39.1 39.4
49.0 48.7 49.2 49.8 50.2 50.4
18.71 19. 04 19.19 19.18 19. 72 19.95
36.9 38.8 38.5 37.3 37.5 38.0
52.1 52.3 52.7 53.2 53.0 52.7
19.13 20. 26 20.20 19.74 19. 86 19.91
39.0 40.0 39.9 39.7 41.0 41.4
54.8 54.2 54.4 54.0 53.8 54.3
21.33 21.64 21.65 21.40 21.99 22. 45
July August September October November December.
36.9 39.6 39.3 40.9 39.7 38.6
49.8 50.2 50.1 50.2 51.4 51.3
18. 61 20.14 19. 95 20.80 20.63 20.18
37.1 39.7 39.8 41.3 40.5 40.3
52.8 52.9 53.0 52.7 53.6 54.4
19.47 20.90 20.95 21.72 21.63 21.87
39.7 42.3 42.1 43.0 42.6 41.9
54.0 53.7 53.5 53.2 54.0 54.2
21.41 22. 70 22. 51 22.91 22. 94 22. 73
January February March April May June
36.9 38.0 38.4 38.4 38.7 38.5
51.2 51.3 51.5 51.8 52.1 52.3
19.10 19. 69 19. 91 20. 00 20.22 20.17
37.4 39.2 39.2 38.3 38.0 38.1
53.8 53.9 54.7 54.6 54.6 54.8
19.95 20.91 21.15 20. 70 20. 59 20.67
39.3 39.7 39.9 40.0 40.3 40.2
54.2 54.4 54.3 54.7 54.6 54.5
21.27 21.58 21. 59 21.84 22. 02 21. 82
July August September October November December
37.0 39.4 39.9 40.7 38.9 39.5
51.9 52.6 52.5 52.4 52.6 52.8
19. 37 20.81 21. 06 21.49 20. 75 21. 06
37.1 39.4 40.6 41.3 40.2 41.0
55.0 54.6 54.6 54.7 55.5 55.2
20.28 21. 39 22. 07 22.49 22. 23 22. 64
39.7 41.5 41.8 42.6 41.2 41.7
54.4 54.5 54.6 54.7 54.7 55.0
21. 66 22.69 22.84 23. 30 22.58 23.01
January February March April May June July August September October November December
-
1939
1940
See footnotes at end of table.
Digitized for FRASER http://fraser.stlouisfed.org/ Federal Reserve Bank of St. Louis
7 8
HOURS
AND
EARNINGS
IN
THE
UNITED
STATES
5 . — A v e r a g e hours worked per week, average hourly earnings, and average weekly earnings in manufacturing industries, by years, 1932 to 1940, and by months, January 1935 to December 1940 1 Continued
TABLE
Lumber and allied products—Continued
Lumber, sawmills
Year and month
Stone, clay, and glass products "Stone, clay, and glass" group
Brick, tile and terra cotta
Average Average Average Average Average Average Average Average Average hours hours hours hourly weekly weekly hourly hourly weekly worked earnings earnings worked earnings earnings worked earnings earnings per week per week per week
1932-. 1933.. 1934.. 1935.. 1936-
36.9 37.4 33.2 37.2 43.1
Cents 30.6 30.0 38.9 38.7 39.8
$11.30 11.14 12.90 14.41 17.18
32.9 35.3 39.1
1937.. 1938.. 1939.. 1940..
43.3 40.4 38.4 38.0
43.8 44.6 47.6 50.1
18. 97 18. 01 18. 29 19.09
January. _. February _ March April May June
33.1 34.5 34.8 36.2 33.0 37.1
38.0 38.1 38.7 38.4 36.7 36.9
July August SeptemberOctober November.. December..
36.7 39.4 40.2 41. 4 39.5 40.8
January... FebruaryMarch April May June July August September.. October November.. December..
Cents 52.9 54.8 55.5
$17.12 16. 30 17. 63 19. 34 21.47
31.7 32.2 31.8 35.8 41.9
Cents 38.8 36.7 43.7 45.0 45.3
$12. 54 11.88 14. 06 16.14 18.94
38.8 35.2 36.8 36.7
61.5 63.9 65.0 66.8
23. 79 22. 62 24. 01 25.19
40.2 36.1 37.8 37.0
51.9 52.3 54.3 56.3
20. 88 18.88 20. 55 20.95
12. 58 13.14 13. 47 13.90 12.11 13. 69
32.1 33.1 34.1 34.6 34.8 34.7
54.2 54.7 54.9 55.0 55. 1 54.9
17. 60 18. 33 19.18 19. 05 19.06
30.7 32.5 33.2 33.6 34.2 34.6
45.0 45.8 45.6 44.6 44.5 45.0
13. 79 15. 06 15.12 15.11 15. 34 15.44
38.2 40.2 40.6 39.8 39.4 38.8
14. 02 15. 84 16.32 16. 48 15. 56 15. 83
34.4 35.6 36.5 37.6 37.2 38.1
54.8 54.5 54.6 54.8 54.9 55.4
18. 61 19.17 19. 79 20. 45 20. 34 21.13
35.4 36.2 38.0 39.0 39.0 39.4
45.3 45.0 44.6 45.2 45.1 45.1
15.82 16.19 17. 06 17.50 17. 49 17.83
40.8 39.9 42.7 42.8 43.6 43.9
38.7 38.6 39.3 40.2 40.6 40.6
15. 79 15. 40 16.'78 17.21 17. 70 17. 82
35.2 35.9 38.1 38.8 39.6 39.3
55.6 55.2 55.4 55.2 55.5 55.2
19. 53 19. 76 20. 96 21.19 21.46 21. 21
36.7 37.4 40.0 41.4 43.3 42.9
45.5 45.2 45.1 44.4 44.7 44.8
16. 65 16. 76 18.02 18.29 19. 23 19.17
42.2 44.3 44.5 45.1 43.8 43.8
40.0 40.3 40.3 40.5 39.6 39.2
17. 85 17.93 18. 27 17. 34 17.17
16. 88
38.6 39.9 39.3 41.1 41.5 40.2
55.3 55.3 55. 8 56.0 55.6 56.0
20. 90 21. 71 21.64 22. 95 23. 23 22.32
42.1 43.1 42.4 43.9 44.0 43.2
45.1 44.5 44.9 45.4 46.1 47.6
18. 96 19. 21 20. 03 20.17 20.31
January... February. March April May June
41.8 44.0 45.0 45.7 44.8 45.8
38.4 38.8 41.9 44.1 44.6 46.5
18. 86
20.15 19. 98 21.30
38.3 39.5 40.5 40.9 40.0 39.9
56.2 57.5 59.0 61.5 61.5
21.38 22.66 23.95 24.80 24. 59 24. 53
40.5 41.9 43.2 43.4 42.0 41.9
48.0 47.7 49.2 52.2 52.1 52.4
19. 29 19.83 21.07 22.60 21.91 22.13
July August SeptemberOctober November.. December..
42.4 45.2 43.2 43.0
46.0 46.4 46.6 45.5 44.3 42.5
19. 50 20. 97 20.13 19. 57 17.68 16.41
38.1 39.8 38.3 38.6 36.5 33.9
62.0 62.5 63.6 63.7 63.9 64.5
23.41 24. 84 24. 38 24.74 23.71 21.86
39.7 40.9 39.4 39.0 35.8 33.8
52.8 53.1 54.0 54.0 53.4 53.5
20.96 21.75 21.37 21.15 19.18 17.95
18. 88
18. 98
1937
See f o o t n o t e s a t e n d o f t a b l e .
Digitized for FRASER http://fraser.stlouisfed.org/ Federal Reserve Bank of St. Louis
16. 05 17. 07
61.0
GENERAL
79
TABLES
5 . — A v e r a g e hours worked per week, average hoxwly earnings, and average weekly earnings in manufacturing industries, by years, 1932 to 1940, and by months, January 1935 to December 1940 1 —Continued
TABLE
Lumber and allied products—C ontinued Lumber, sawmills
Year and month
Stone, clay, and glass products "Stone, clay, and glass" group
Brick, tile, and terra cotta
Average Average Average Average Average Average Average Average Average hours hours hours hourly weekly weekly hourly weekly worked hourly earnings worked earnings earnings worked earnings earnings per week per week per week earnings 1938 38.8 39.9 40.9 39.6 40.4 40.9
Cents 42.3 42.3 44. 4 45.5 45.1 45.4
$16. 41 16.88 18.16 18. 02 18. 22 18.57
31.2 33.1 34.1 34.7 36.1 35.9
Cents 64.6 64.5 64.0 63.3 63.5 63.5
$20.03 21. 47 21.95 22. 00 23.12 22. 77
31.2 32.1 32.9 34.6 36.6 37.7
Cents 54.1 53.5 52.4 51.6 51.8 51.8
$16. 53 17. 26 17.24 17. 89 19.17 19.43
38.9 42.9 42.4 42.6 38.7 38.3
43.4 45.3 44.9 44.7 46.0 46.0
16.88 19.43 19. 04 19.04 17. 80 17.62
34.7 35.9 36.2 37.1 36.3 36.9
63.1 63.4 63.4 64.0 64.5 64.9
21.90 22. 77 23. 00 23.96 23. 82 24.03
37.0 38.3 38.0 38.8 36.5 37.2
51.1 51.1 51.6 52.6 53.1 53.7
18. 83 19. 56 19.77 20.37 19. 46 20. 06
January February March. April May_June..
38.2 38.0 38.2 38.3 39.4 39.7
45.8 45.2 46.0 47.1 48.1 48.4
17. 50 17.18 17. 57 18.04 18.95 19.21
35.1 35.7 33.2 35.5 36.5 37.2
65.1 64.9 65.2 64.8 64.4 64.7
22. 98 23.43 23.72 22.96 23.47 23.94
36.5 36.1 36.1 36.4 37.4 39.5
54.0 54.2 54.4 53.5 53.4 53.8
19.65 19. 47 19. 59 19. 46 19.91 21.25
July August September October November. December
36.1 39.0 38.4 40.3 38.6 37.0
47.3 48.1 47.9 48.3 49.7 48.9
17. 08 18. 76 18. 39 19. 45 19. 20 18.11
35.1 37.7 37.0 39.2 37.9 37.5
64.6 64.6 64.7 65.4 65.7 66.0
22. 58 24. 26 24. 03 25. 98 25. 24 25. 01
36.6 39.2 38.1 40.5 38.5 37.9
53.1 53.9 54.0 55.1 55.6 55.8
19. 58 21.17 20. 66 22. 51 21.58 21.18
January February___ __ _ March ___ April May _June _
36.1 37.0 37.6 38.1 38.7 38.3
49.1 49.1 49.2 49.7 50.3 50.5
17. 73 18.19 18. 49 18. 93 19. 43 19. 32
35.1 35.3 35.7 36.5 37.1 36.3
66.4 66.2 66.4 66.4 66.4 66.4
23. 58 23.71 24. 03 24. 49 24. 79 24. 20
34.8 34.6 35.0 36.1 37.2 37.4
55.8 55.4 55.3 55.1 55.1 55.1
19. 52 19. 30 19. 55 19. 97 20. 65 20. 74
July August September-__ October November. December
36.4 38.9 39.2 40.0 37.7 38.0
49.6 50.9 50.7 50.6 50.5 50.7
18. 02 19. 79 19.85 20. 23 19. 06 19. 29
35.5 37.0 37.4 38.1 37.1 38.2
66.5 66.8 67.2 67.1 67.1 68.0
23. 49 24. 81 25. 27 25. 75 25.17 26. 25
» 36. 8 37.7 38.1 38.5 37.4 38.5
ii 56. 6 56.8 56.5 56.6 57.2 58.2
ii 20. 95 21.49 21.62 21.87 21.47 22. 52
January February. March April May June July August. _ September _ October November. December
_
_
1989
mo
See footnotes at end of table.
Digitized for FRASER http://fraser.stlouisfed.org/ Federal Reserve Bank of St. Louis
*
80
HOURS
AND
EARNINGS
IN
THE
UNITED
STATES
5.—Average hours worked per week, average hourly earnings, and average weekly earnings in manufacturing industries, by years, £o iP^O, °