March 2011
Recycling in the United States: An Industry Analysis for the Missouri Market Development Program
Prepared by Mike Bellamente Sr. Program Manger NADO Research Foundation
2
Table of Contents 1. Executive Summary......................................................
3
1.1 Background................................................................ 1.2 Research and Methodology.......................................
5 5
2. Current State of the U.S. Recycling Industry..........
5
2.1 Economic Outlook....................................................... Export Markets.................................................... 2.2 Environmental Importance of Recycling ..................... Energy Reduction............................................... Pollution Reduction..... ....................................... 2.3 The Concept of Zero Waste ...................................... 2.4 The Growth of E-Waste ............................................. 2.5 Waste Diversion ....................................................... Waste Exchange.................................................. 2.6 Purchaser Mapping ...................................................
6 8 9 10 10 11 12 12 13 14
3. Market Development trends ..................................... 14 3.1 Public, Private and Regional Partnerships.................. 3.2 Corporate Involvement .............................................. 3.3 Public Purchasing ...................................................... 3.4 Construction and Demolition Waste............................ 3.5 Trade Shows and Expos............................................. 3.6 Notable Practices .......................................................
15 16 17 17 18 18
4. Conclusion................................................................. 19
NADO Research Foundation
3
1. Executive Summary The recycling industry in the U.S. continues to emerge as a sector of innovation and vast market potential. Hampered briefly by the recent financial crisis and a stark decrease in demand for recovered materials, the industry has since rebounded almost entirely to prerecession levels. Recycled materials are derived predominantly from the municipal solid waste (MSW) stream. The U.S. currently ranks third behind Ireland and Norway in terms of the amount of municipal MSW generated per capita among the 34 member countries of the Organization for Economic Co-Operation and Development (OECD). MSW diversion rates in the U.S. continue to hover around 34 percent, meaning approximately a third of commercial and household waste is typically recovered from the waste stream to be recycled or combusted through waste-to-energy applications. Of the waste diverted for recycling purposes, ferrous metals (such as steel), paper, plastic and non-ferrous metals (such as aluminum) represent the largest component sectors of the industry, while glass and organics represent a much smaller segment of the overall market. The domestic recycling industry represents a market exceeding $235 billion. Of that amount, collection, sorting and processing account for approximately 20 percent of payroll and revenues, while the recycling manufacturing
industry accounts for nearly 80 percent. From an economic development perspective, this signifies the importance of recycling as a means to an end and not as an end itself. The economic benefits of recycling versus landfill disposal seem negligible at the front end of the supply chain, but as materials flow further downstream the value of the commodity increases, as do the wages and skilled labor required to render the commodity into an end product. As recycling in the U.S. continues to mature with increased buyers and sellers, the industry becomes more resilient to the whims of the market. Additionally, with a more mature market come improvements in technology, supply chain logistics and overall market efficiency, in turn enabling recycling manufacturers to more quickly realize economies of scale and market parity with virgin resource-based products. The emergence of the Zero Waste concept is evidence that recycling has the potential to be a wholly sustainable loop. A solid waste management philosophy that has been adopted in New Zealand, British Columbia and some parts of the U.S., Zero Waste is the concept that all waste retains an inherent, marketable value that can be used as an input for something else. To encourage industry stability, state recycling offices and market development programs
Recycling in the United States
4 act as conduits of information and assistance for the private sector. These programs, often enacted through state legislation, vary in their approach and ability to strike the appropriate balance of incentives, outreach and collaboration. One readily recognizable flaw in standard state-driven waste diversion models, however, is that these programs are predominantly funded out of landfill tipping surcharges. This is seemingly counter-intuitive, as the more successful a program is at diverting waste from landfills, the less funding it will have to perpetuate itself. Another apparent barrier to improved market development is the flow of information between state agencies and private sector entities such as Material Recovery Facilities (MRFs) and processors. Understandably, private sector data is often proprietary, and therefore not readily available to entities outside the organization. In order to make informed decisions on how to attract new recycling businesses, however, state market development and economic development agencies require reliable data on the availability and supply of certain recovered materials. This magnifies the importance of developing long-standing public-private partnerships. In addition to statewide partnerships, the need for regional collaboration seems equally imperative, if not more so. Access to markets within an individual state is severely limited by the types of industries available. Missouri,
for example, is dependent upon paper mills in Oklahoma for much of its recycled paper consumption. Similarly, Missouri’s waste and scrap exports to China and other countries surpassed $450 million in 2008. Recirculation of even a fraction of this within the region would have lasting economic benefits for the region. At a time when government spending is under great scrutiny, the merits of publicly funded recycling programs will be measured by direct economic results. To date, Missouri has made great strides in developing a robust network of recycling organizations. As of 2005, recycling and the recycling manufacturing industry in Missouri accounted for over 28,000 jobs across 1,200 different businesses.1 However, much of the state’s recovered materials continue to flow outside of the state’s borders. Altering this trend requires a concerted and calculated effort to educate existing businesses on the benefits of employing recycled feedstock in their operations, as well as attracting new end users of recovered materials to the state. Invariably, this will result from the ability to offer the private sector a consistent stream of high quality, high volume secondary materials on a reliable basis over a long period of time.
NADO Research Foundation
5 1.1 Background
1.2 Research and Data Collection Methodology
This analysis is the first phase in a three-part project funded by the Missouri Environmental Improvement and Energy Resources Authority’s (EIERA) Market Development Program (MMDP). The NADO Research Foundation has been sub-contracted by the Missouri Association of Councils of Government (MACOG) to complete all three phases of the project: 1) provide an industry analysis of domestic programs, policies and trends in the recycling industry; 2) develop a multi-state survey to better understand the needs of the industry in and around Missouri; and 3) write a final report of observations and recommendations for the Missouri Market Development Program. The EIERA is a quasi-governmental agency that serves as the financing arm for the Missouri Department of Natural Resources. In 1990, Senate Bill 530 authorized the EIERA to establish the MMDP to encourage the development and maintenance of markets for recovered materials. The Missouri Association of Councils of Governments (MACOG) is the statewide organization representing Missouri’s 19 regional planning commissions and councils of governments. These organizations work to stimulate job growth and private investment across Missouri through regional economic development.
The goal of this analysis is to provide the MMDP a snapshot of the recycling industry as it exists today in the U.S. This analysis is also meant to identify potential “demand-pull” market development initiatives that have the potential to be replicated within the State of Missouri. Additional stakeholders who may benefit from this report include solid waste managers, regional councils, processors, haulers, end users, economic development planners and policymakers. To capture all of the components associated with the recycling industry, the NADO Research Foundation compiled data and research from state recycling organizations, nonprofit recycling groups, academic institutions and representatives of the private sector. Methods for data collection employed for this analysis included in-person interviews, phone interviews, email surveys and internet research.
2. Current State of the U.S. Recycling Industry Today, the impetus for recycling is driven almost as much by its economic benefits as it is for the protection of our natural environment. Throughout the 1990s, recycling was largely considered a disjointed process; one that would feed a system that often yielded an end product of lesser quality and higher price. With the advent of single-stream recycling, and a gradual shift in the corporate mindset to offer
Recycling in the United States
6 greener consumer products and packaging material, recovered materials manufacturing has vastly improved and waste diversion rates have increased substantially to 33.8 percent in 2009.2
by rendering those materials into products of greater value. Recycling and reuse are inherently value-adding, whereas disposal is not, and value-adding processes support jobs and economic activity.4
Measured by percentage of generation, MSW products with the highest recovery rates in 2009 were lead-acid batteries (96 percent), newspapers (88 percent), corrugated boxes (81 percent), office paper (74 percent), major appliances (67 percent), steel packaging (66 percent), yard trimmings (60 percent), commercial printing paper (66 percent), standard mail (63 percent), magazines (54 percent), aluminum cans (51 percent), and folding cartons (50 percent).3
Any material destined for landfill that maintains an otherwise marketable value, is a leakage from the local economy. By diverting these materials from landfill, they are given a second life that have direct and indirect benefits, which can then be leveraged and fed back into the economy in a closed, sustainable loop. Recycling is estimated to create nearly five times as many jobs as landfills, but this estimate rarely includes induced and indirect jobs associated with downstream manufacturing processes.
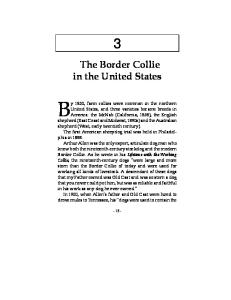
2.1 Economic Outlook The financial crisis of 2008 affected all aspects of the economy, including the recycling industry. With a depression in demand for consumer goods, construction materials and manufacturing inputs, commodity prices decreased dramatically, resulting in a ripple effect of recycling business closures and revenue losses among recycling programs across the country. Commodity prices dropped as much as one-third (copper) to one-half (aluminum), highlighting one of the inherent difficulties of market development for recycled materials: market fluctuation. From an economic perspective, recycling is not an end goal, but the first step in a chain that feeds into larger, more profitable components of the industry. As much as it is true that a municipality can save money on landfill fees by diverting waste into the recycling stream, the real economic benefits come from jobs created
As is evidenced by the graph below from a 2001 National Recycling Economic Information Study performed by R.W. Beck, payroll and revenues in manufacturing of recovered materials comprise nearly 80 percent of the
Source RW Beckber
NADO Research Foundation
7 value of the industry, while collection and processing accounts for only 20 percent. The primary market for recovered PET plastic continues to be fiber for carpet and textiles, while the primary market for HDPE is bottles. Capacity to process material and the market demand for recovered plastic resin continue to exceed the amount of post-consumer bottles that are now recovered from the waste stream. This shortfall in supply has existed for over 10 years. Development of new end uses for recycled PET bottles (like coating for corrugated paper and other natural fibers to make waterproof products like shipping containers) are expected to fuel the demand for more post-consumer plastics in the future. In 2009, Coca-Cola Company built a firstof-its-kind bottle-to-bottle PET facility that produces approximately 100 million pounds of food-grade recycled PET plastic each year, the equivalent of nearly two billion 20-ounce Coca-Cola bottles.5 The recycled plastic lumber industry is also gaining Bench constructed of consumer recognition, recycled plastic lumber as the American Society for Testing and Materials (ASTM) paves the way for use of these materials with standards and test methods in more demanding applications.6
R.W. Beck accounts for this phenomenon as follows: Initially, a relatively small amount of value is added by consolidation (collection). Processors invest significantly more expense (value) in the recovered material by sorting and densification. However, no transformation of the recovered material has yet occurred, the material has simply been concentrated. The greatest value is added in manufacturing where relatively useless raw materials of little value are made into useful products of considerable value.7 More recent evidence supporting these findings can be seen in a 2009 Recycling Economic Information Study commissioned by the Northeast Recycling Council (NERC) and prepared by DSM Environmental, Inc. This study focused on the five-state, $35 billion recycling industry in Delaware, Maine, Massachusetts, New York and Pennsylvania. The study found that businesses utilizing recycling raw materials do so in lieu of “virgin” products that are often mined and manufactured outside of the region. As a result, these businesses create jobs closer to home and have a smaller environmental footprint than companies that rely on raw material extraction. Within the five-state region, research showed that there were 7,313 businesses working in this sector. This is 43 percent more workers than mining operations there, paying wages that were approximately 62 percent higher than those offered by mining jobs, according to U.S. Census figures.8
8 Pennsylvania’s recycling and reuse industry leads all northeastern states in employment, payroll and sales numbers. Over 3,800 recycling and reuse businesses made $20.6 billion in gross annual sales in 2009 and provided more than 52,000 jobs with an annual payroll of approximately $2.2 billion.9 In a 2010 recycling economic information study performed by DSM Environmental for the State of Illinois, the direct and indirect benefits from the Illionois recycling industry accounted for: • • • •
A total of 111,500 jobs Payroll of $3.6 billion $30.3 billion in additional gross receipts Over $1 billion in state and local taxes10
Similar to the 2001 national study, the payroll and revenue values increased significantly as recovered materials moved further downstream into the manufacturing processes. In 2001, over half of the economic activity for the entire recycling and reuse industry in the U.S. was accounted for by the following four recycling manufacturing sector categories: • Paper paperboard, and deinked market pulp mills, which employed 139,375 people and grossed nearly $49 billion in estimated annual receipts • Steel mills which employed 118,544 people and grossed $46 billion in estimated annual receipts
• Iron and steel foundries which employed 126,313 people and grossed over $16 billion in annual estimated receipts.11
Export Markets The appetite for recycled materials has expanded exponentially with the growth of China’s economy in the last 10 years. Unlike the U.S., which came of age on a wave of industrial dominance based largely on access to seemingly endless raw materials, China has built a steadily burgeoning commodity infrastructure around recovery materials. Missouri alone exports approximately $450 million in waste and scrap materials a year, with China being atop the list in all export categories for copper, aluminum, alloy steel, paper and cardboard.12 Other export markets for Missouri’s recovered materials include Canada, Mexico, Korea, India, Thailand, Taiwan, Pakistan and the Netherlands. In total, Missouri waste and scrap sales continues to be one of the State’s fastest rising export categories: 2004: 2005: 2006: 2007: 2008:
• Plastics converters which employed 178,700 people and grossed nearly $28 billion in estimated annual receipts
NADO Research Foundation
$73.5 million $116.2 million $361.0 million $289.1 million $450.5 million
9
The challenge to the recovered glass industry stems from collection management and processing issues. The advent of single-stream recycling has resulted in vast improvements to solid waste diversion, but as glass breaks down it becomes more difficult to sort and process. The result is an increase in contamination of other recovered materials due to the ubiquity of glass fibers and a devaluation of the glass products themselves. Some municipalities have combated this issue by returning to a system where glass is collected separately from other materials. Niche markets have also surfaced around the country to accommodate the issue. Ripple Glass, a subsidiary of Boulevard Brewing Company in Kansas City, Missouri, has established dedicated glass recycling bins around the metro area to be processed and remanufactured into fiber glass insulation. Another company, GlassVac, offers a product that reduces the volume and collection issues associated with glass through a unique implosion technique that renders the glass into edgeless fibers.
As much as this helps to increase volume demand for domestic recovered materials, much of the material is used as feedstock for manufacturing processes, building materials and consumer products that are then resold to the U.S. Domestic market development programs act to counter-balance foreign demand by developing local markets for materials that will, in turn, create jobs and broaden the domestic tax base. This not only protects what remains of American manufacturing, but also insulates the U.S. from foreign market volatility. Manufacturing in Asia and other parts of the world will continue to be cheaper due to low labor rates and the overall low cost of production, but the importance of improving domestic distribution channels for recovered materials is vital to maintaining our foothold in recovered materials markets.
2.2 Environmental Importance of Recycling As important as the free market is to determining the value of a good based on supply and demand, the system fails to account for negative externalities associated with virgin resource extraction, processing, manufacturing and disposal in terms of resource depletion, adverse public health effects and environmental degradation.13 The world’s population has increased from 1 billion in 1800 to nearly 7 billion today, making resource conservation a vital component of long-term environmental sustainability. Using 2005 consumption rates, it is estimated that
10 society is consuming resources at a rate 30 percent more than what the earth can sustain annually.14 This number is expected to increase to 100 percent by 2050, meaning that biological capacity equal to two planet earths would be required to keep up with humanity’s resource demands and waste production.15 Although the effects of this may not be evident to current generations, the consequences of continuing along the current rate of consumption have the potential to be Malthusian16 in nature. Shifting our cultural paradigm from a sense of entitlement toward resource consumption to one that is more harmonious with nature is a shift that requires time and education. As people begin to understand the longterm consequences of a throwaway society, there is a rising sentiment of “generational accountability,” one that drives us to feel responsible for how future generations will inherit the earth. Although solid waste recovery and reuse is a minor component in resource management, it is a vital component nonetheless.
Energy Reduction According to the Bureau of International Recycling, the creation of secondary raw materials through the recycling process expends far less energy than production based on primary raw materials. Recycling just one ton of aluminum cans, for example, conserves more than 207
million BTU, the equivalent of 36 barrels of oil, or 1,665 gallons of gasoline.17 Below is a list of commodities and the amount of energy savings realized by using secondary materials versus harvesting virgin resources: Energy Savings: Recycled vs. Raw Material Aluminum: Copper: Lead: Paper: Plastics: Steel:
96 percent 85 percent 65 percent 64 percent 80 percent 74 percent
Source: Bureau of International Recycling
Pollution Reduction Nationally, in 2009 Americans recycled or composted 82 million tons of MSW. This provides an annual benefit of 178 million metric tons of carbon dioxide equivalent emissions reduced, comparable to removing the emissions from almost 33 million passenger vehicles. Additionally, about 29 million tons of materials, or 11.9 percent, were combusted for energy use.18 According to the Recycling Economic Information study prepared for NERC in 2009 each year recycling operations 2009, in Massachusetts, Pennsylvania, New York, Delaware and Maine save the amount of energy needed to power almost two million households, and avoid 6.4 million tons of greenhouse gas em emissions equivalent to taking close m to 3 million cars off the road.19
NADO Research Foundation
11 Other benefits to the environment derived from the use of recovered materials include water conservation and reduction in air pollution. It is estimated that producing paper via recycling entails 35 percent less water pollution and 74 percent less air pollution than harvesting virgin pulp, while producing steel from scrap translates into 86 percent less air pollution.20 Using recycled glass produces 20 percent less air pollution and 50 percent less water pollution than creating new glass (or fiberglass) from raw material.21
2.3 The Concept of Zero Waste Along with the realization that waste reduction and resource recovery can be economically and environmentally beneficial have come progressive, forward-thinking ideas on how to make solid waste management a wholly sustainable, circular loop. One of the concepts that has gained favorability domestically and abroad is the concept of Zero Waste. A step beyond traditional waste diversion goal setting, zero waste requires support from the public sector and a steadfast commitment from the private sector as well. The Zero Waste International Alliance defines zero waste as “a goal that is both pragmatic and visionary, to guide people to emulate sustainable natural cycles, where all discarded materials are resources for others to use. Zero Waste means designing and managing products and processes to reduce the volume and toxicity of waste and materials, conserve and recover all resources.” In June 2009, the Recycling Council of British Columbia published a report, “On
12 the Road to Zero Waste: Priorities for Local Governments.”22 Similarly, over half of New Zealand’s Local Authorities have adopted the zero waste concept in support of the 2002 New Zealand Waste Strategy, “Towards Zero Waste and a Sustainable New Zealand.”23 Domestically, Seattle, Washington is attempting to become the first “carbon neutral” city, in part by adopting a zero waste strategy. Seattle City Council President and local champion of the effort, Richard Conlin, recently stated that the city’s goal is to “reduce our waste stream to the minimum possible by making cradle-to-cradle responsibility the cornerstone for how we treat products.”24
Total U.S. paper recovery reached a record high 54.3 million tons in 2007, up 87 percent relative to 1990 and 1.9 percent over 2006.25 The Paper Industry Association Council (PIAC) reports that about two-thirds of the paper recovered for recycling in the U.S. is used domestically, with containerboard being the largest end-use, accounting for 31 percent of total collections.26 As demand for most commodity materials continue to rise, however, demand for newsprint is beginning to decline as people continue to switch to electric media for their news.
2.4 The Growth of E-Waste Another industry sector that is garnering attention is E-Waste recycling or eCycling. Short for electronic waste, E-Waste is growing exponentially with the continued expansion of information technology and Moore’s Law, the phenomenon that technology of computing hardware doubles every two years. The Consumer Electronics Association estimates that about 2.9 billion consumer electronics devices exist in U.S. homes and cars.27 As a result, new E-Waste recycling programs continue to sprout up around the country. The U.S. Environmental Protection Agency promotes eCycling through its website and even encourages eCycling providers to earn independent, third party certification for the handling of E-waste.28
2.5 Waste Diversion Diverting waste from landfills into the recycling stream increases the supply of recovered commodities. Without a strong commitment to recycling, however, waste diversion rates have a tendency to remain low. Colorado, for example, had a 12.5 percent waste diversion rate in 2005 and was ranked 41st in the nation (the national average was 28.5 percent at the time). Within two years, following state government-led commitment to support the
13 recycling industry, diversion rates improved by over 100 percent to 3,358,449 tons of diverted material.29 Of the state government-supported diversion programs reviewed for this analysis, including waste exchanges, it became evident that these initiatives are predominantly funded out of landfill tipping fee surcharges. Instead of providing positive reinforcement to state employees who are successful in finding matches for waste products, this approach essentially reduces the revenues available to the state to continue the program. Nowhere was this more evident than with the Iowa Waste Exchange, which began in 1990. The program excelled for a number of years, eventually topping out at 11 employees, before an everdwindling budget forced full-time staff to be reduced to six.30 New York State, on the other hand, is one of the few states that fund waste diversion programs through a dedicated environmental funding pool, derived from real estate transaction surcharges.
According to the U.S. Business Council for Sustainable Development (USBCSD) web site: • A cement manufacturer uses the slag from a neighboring steel mill in its production process, resulting in a 10 percent increase in production output and a 30–40 percent decrease in nitrogen oxide emissions. • A major U.S. chemical company identifies synergies between six of its own plants with an estimated annual cost savings of $15 million and total annual energy savings of 900 billion BTU. • A fiberglass manufacturer connects with a firm that will use its 500 tons/year of off-spec material as well as discovering soy polymers and chicken feathers as more benign and less expensive raw materials. • A brick manufacturer uses incinerated cow bone ash from meat processing plants, industrial ash, and water treatment residue to create a new product line of recycled “eco-bricks,” diverting 16,000 tons of waste from landfills each year.31
Waste Exchanges Outside of traditional recycling programs, waste exchanges are another method for diverting materials back into the supply network. Based on the concept that one company’s trash is another company’s treasure, waste exchanges act as matchmakers to producers and users of waste materials.
Common drawbacks of waste exchanges are that they are difficult to develop and maintain because of the number of materials available, and the amount of turnover that occurs from year- to-year.
Recycling in the United States
Traditionally operated as state-sponsored programs, evidence of private sector waste exchanges has begun to take shape. The USBCSD offers a By-Product Synergy (BPS) program that enables
14 members to access a nationwide database of waste materials. Bridging the Gap, a Kansas City-based nonprofit, acts as one of USBCD’s licensed regional distributors on behalf of the national BPS platform. Companies that wish to join the BPS program are required to pay a $2,500 annual membership fee.32 Recycle Match is another privately-owned waste exchange company that acts as a matchmaker for producers and users of waste. Often dubbed the Craig’s List or eBay of waste exchange, this Texas-based company relies on a commission-based model to turn a profit.
2.6 Purchaser Mapping Similar to waste exchange, GIS-mapping of commodity purchasers enables processers and MRFs the ability to identify downstream markets for recovered materials. In 2010, the Southeast Recycling Development Council (SERDC) developed a thoroughly vetted database of manufacturers in demand of recycled glass, plastic, metal and paper to make new consumer goods. The database, originally funded by the U.S. EPA, is continually updated with the latest industry information.
3. Trends in Market Development To encourage industry stability, state-sponsored market development programs provide information and assistance to the private sector. These programs vary in their approach and ability to strike the appropriate balance of incentives, outreach and collaboration. Depending on the desired outcomes, market development can take many forms. Administrators may focus on the supply side of the recycling chain to increase the number of recovered materials available in the marketplace, or they can focus on the demand side of the equation to incentivize manufacturers and businesses to employ recovered materials instead of virgin resources in their operations. Decisions become more granular still if there is a foreseeable demand increase for a specific commodity. This section offers a glimpse into market development programs around the country that have the potential to be replicated.
Examples of ‘Supply Push’ Market Development Activities
Source: SERDC Web site
• • • •
Pay-as-you-Throw (PAYT) Programs Waste Bans Tipping Fee Increases Community Recycling Programs
Examples of ‘Demand Pull’ Market Development Activities • • • •
‘Buy Recycled’ Initiatives Business Attraction/Entrepreneurship Technical Assistance Grants and Loan Programs
15 3.1 Public, Private and Regional Partnerships Beyond any single recycling program or waste diversion initiative, the primary element required for successful market development is partnership. Business-to-business partnerships, public-private partnerships, multistate regional partnerships, even international partnerships are imperative to the recycling industry as a whole. Of the research and data mined for this analysis, the states that identify and leverage the natural symbiotic relationships within the recycling industry are best positioned for tapping optimum market potential.
3. Private-sector relationships allow DPPEA to keep a pulse on the recycling industry and identify opportunities for additional recycledcontent manufacturing opportunities. 4. International partnerships enable the DPPEA to better understand export markets that support regional commodity demand. 5. Educational Institution partnerships foster recycling engineering programs and primary school recycling programs. In addition to these partnerships, Mouw also mentioned the importance of having the support of the North Carolina General Assembly by reporting on the success of statewide recycling efforts in economic terms.
In an interview with Scott Mouw of the North Carolina Division of Pollution Prevention and Environmental Assistance (DPPEA), there were no fewer than five types of partnerships that he attributed to the success of recycling within the state:
Other states echoed these sentiments, including Jim Gilbert of the Empire State Environmental Services Unit in New York, who Sculpture garden made from emphasized the importance of recycled glass regional partnerships, including the region’s nonprofit recycling association, Northeast Recycling 1. Inter-agency partnership between the Council (NERC). department of commerce and department of natural resources allows for a coordinated According to Gilbert, NERC is able to strategy to recycling and provides access to the accomplish several things on a regional basis business community. that we cannot undertake alone, including: 2. Multi-state regional partnership helps individual states and businesses reach economies of scale, identify regional linkages and collectively fund resources to improve supply of and demand for recycled materials.
• A Newspaper Publishers Agreement – http://bit.ly/g6Hbme • A Regional Recycling Economic Information Study – http://bit.ly/dIN5sF
Recycling in the United States
16 • An Environmental Benefits Calculator – http://bit.ly/gOVV1t Gilbert also identified the benefits of peerdiscussion through the former EPA Jobs Through Recycling email group. Although the EPA program is no longer in existence, over 250 recycling professionals nationwide continue to be members of the List Serv. To request membership, visit: http://groups.yahoo.com/group/ JTRProfessionalRecyclersNetwork Another EPA-sponsored recycling partnership is the EPA WasteWi$e program. Companies in the WasteWi$e program commit to purchasing products that contain either pre-or postconsumer recycled content in lieu of products manufactured from virgin materials. Launched in 1994 WasteWi$e and has more than 1,700 members in more than 54 industry sectors and WasteWi$e partners have reported more than 120 million tons of waste reduced.33 Of the companies in the WasteWi$e Hall of Fame, Missouri’s own Anheuser-Busch (now InBev) stands out for their ability to achieve a 97 percent company-wide recycling rate in 2005.34
3.2 Corporate Involvement As corporations begin seeing the marketing benefits and economic value in waste reduction and recycling, public-private partnerships are becoming more commonplace. In Washington D.C., for example, a public-private partnership with PepsiCo has recently resulted in a donation of 350 recycling bins around the city that have the potential to divert over 1 million
PepsiCo’s Dream Machine Automated Recycling Kiosk
pounds of recyclable material a year from landfills.35 Another form of partnership that is showing signs of promise are business outreach programs through educational institutions. The Materials Innovation Service (MIS), supported by the Iowa Department of Economic Development, is a sub-section of the Recycle Reuse Technology Transfer Center (RRTTC) at the University of Northern Iowa. The MIS employs a full-time person that actively promotes recycled content materials. The MIS also provides low-cost, consulting services for small- to mediumsized Iowa manufacturing companies with regard to product development and materials innovation.36
NADO Research Foundation
17 In South Carolina, a formal statewide partnership has been developed called the Recycling Market Development Advisory Council (RMDAC). The council is comprised of 14 Governor-appointed members representing recycling companies, industry, local governments, higher education and the general public. The council is supported by South Carolina Department of Commerce staff, who coordinate the activities of the council and provide technical and economic development assistance to recycling businesses and industry professionals. The RMDAC tracks the success and growth of the state’s recycling industry and makes policy and program recommendations to the Governor and General Assembly each year.
3.3 Public Purchasing Several states around the country have adopted Comprehensive Procurement Guidelines (CPGs) that either follow or directly relate to the EPA CPG program. As part of the Resource Conservation and Recovery Act (RCRA), the EPA CPG program is authorized by Congress and is required to designate products that are or can be made with recovered materials, and to recommend practices for buying these products.37 In Missouri, state statute dictates that “products that utilize recovered materials of a price and quality comparable to products made from virgin materials shall be sought and purchased, with particular emphasis on recycled oil, retread tires, compost materials and recycled paper products.”38
Such regulatory measures have honorable intentions, but are difficult to monitor or enforce. Often the spirit of the law is lost in the law itself, as government administrators find themselves caught in a question of ideology of whether ‘green’ products merit the often higher cost to taxpayers. Alternatives to formal public purchasing programs include “green challenge” competitions between agencies and local government or forming partnerships with established programs such as the U.S. Communities Government Purchasing Alliance. The Alliance is a government purchasing cooperative that reduces the cost of goods and services by aggregating the purchasing power of public agencies nationwide. Their Go Green Program enables public agencies to access a broad line of green products, services and resources including pre- and postconsumer recycled products.39
3.4 Construction and Demolition Waste Construction and Demolition (C&D) waste comprises between 10–25 percent of waste materials in the waste stream. A large portion
18 of this waste typically comes in the form of wood, drywall, roofing and masonry that have the potential to be separated, processed and marketed for sale. According to the 2008 Missouri Waste Composition Study conducted by the Midwest Assistance Program, nearly 50 percent of all C&D waste in Missouri is wood, which equates to over 400,000 tons.40 Green building certification programs such as Leadership in Energy and Environmental Design (LEED) offer project managers and construction supervisors tools and resources for mitigating the amount of waste accumulation at construction sites.
3.5 Trade Shows and Expos Conferences and trade shows provide networking opportunities for industry stakeholders and act as a forum to honor exemplary behavior. When interviewed for this analysis, state recycling officials noted the importance of highlighting the successes and achievements of businesses within the state as a means of generating greater public interest. Two noteworthy recycling events are the Recycling Exposition (REXPO) in California and the Southeast Recycling Conference and Trade Show sponsored by the Southwest Waste eXchange Index (SWIX).
3.6 Notable Practices California
In 2006, the University of Vermont established a C&D waste management program with the goal of diverting over 50 percent of C&D waste on all campus construction projects, as well as to provide methods and best practices for building material reuse.41 Employing a statewide approach to diverting C&D waste, the South Carolina Sustainability Institute established the South Carolina Green Building Directory, a free online tool of green building resources. The directory provides information on products and services that support green building practices in the state. South Carolina Department of Commerce, Department of Health and Human Control and the South Carolina Energy Office (EO) sponsored the development of the directory.42
To promote market development, California has divided the state into 35 Recycling Market Development Zones (RMDZ). The RMDZ program combines recycling with economic development to fuel new businesses, expand existing ones, create jobs, and divert waste from landfills.43 The major features of the RMDZ are: 1) Low interest RMDZ loans from the state; 2) Technical assistance from the local RMDZ coordinator; 3) Market research support; 4) Employee hiring and training programs; 5) Locating local sources of recycled feedstocks;
NADO Research Foundation
19 6) Identifying available sites for manufacturing operations; and 7) Obtaining local land use permits
Minnesota Minnesota is attempting to achieve a statewide recycling rate of 50 percent through their Recycle More Minnesota initiative. Established in 2008, Recycle More Minnesota is an ongoing campaign with several phases: residential, commercial, schools and public entities, and away-from-home recycling. The campaign is a joint effort between the Recycling Association of Minnesota and the Minnesota Pollution Control Agency.44
while demand for other recovered materials, such as rubber tires, continues to be largely cost prohibitive. Successful market development seems very much a balance between identifying the needs of the current manufacturing base and encouraging other businesses to employ recycled feedstock instead of virgin resources. Stimulating demand for recovered materials requires goal-setting, long-term commitment, adopting achievable metrics and knowledge of industry trends. Methods of accomplishing this vary widely from state to state, but many components to market development remain consistent nationwide. Partnership with economic development agencies to attract new business and support the goals of existing businesses appears to be one of the keys to successful intrastate market development. Likewise, developing regional communication channels with other state agencies, universities, regional commissions, nonprofit groups and private enterprises uncovers opportunities and symbiotic linkages that may not exist within an individual state.
4. Conclusion Recycling in the U.S. has changed dramatically over the course of the last two decades from an industry driven largely by public policy to one governed by the needs of the market. As a result, the industry has expanded into a $235 billion market that creates hundreds of thousands of jobs.45
Finally, maintaining and reporting of reliable industry data seems imperative to promoting state recycling and market development efforts. This includes reports to policymakers on the economic value of specific programs and reports to private sector stakeholders that rely on data to make informed decisions on how to run their business. §
Demand for readily marketable commodities, like PET plastic, continues to outpace supply, Recycling in the United States
20 References: 1
http://www.dnr.mo.gov/eiera/RecyclingFinalReport.pdf
2
http://www.epa.gov/osw/nonhaz/municipal/pubs/msw2009-fs.pdf
3
ibid
4
http://www.epa.gov/osw/conserve/rrr/rmd/rei-rw/pdf/exe-sum.pdf
5
http://bit.ly/ey89Dt
6
http://www.americanchemistry.com/plastics/doc.asp?CID=1581&DID=6011
7
http://www.epa.gov/osw/conserve/rrr/rmd/rei-rw/pdf/exe-sum.pdf
8
http://www.nerc.org/documents/highlights_recycling_economic_information_study_update_2009.pdf
9
http://www.portal.state.pa.us/portal/server.pt/community/recycling/14060
10 11
http://www2.ildceo.net/ENR/REI%20Final%20Report%202010.pdf
http://www.epa.gov/osw/conserve/rrr/rmd/rei-rw/pdf/exe-sum.pdf
12
Missouri waste export spreadsheet courtesy of Rob Didriksen, Coordinator, Missouri State Recycling Program
13
http://www.ecocycle.org/ZeroWaste/index.cfm
14
http://web.archive.org/web/20070927175746/http:/www.bir.org/aboutrecycling/index.asp
15
http://assets.panda.org/downloads/living_planet_report_2008.pdf
16
http://en.wikipedia.org/wiki/Thomas_Robert_Malthus
17
http://www.oberlin.edu/recycle/facts.html
18
http://www.epa.gov/osw/nonhaz/municipal/pubs/msw2009-fs.pdf
19
http://www.nerc.org/documents/highlights_recycling_economic_information_study_update_2009.pdf
20
http://web.archive.org/web/20070927175746/http://www.bir.org/aboutrecycling/index.asp
21
http://www.rippleglasskc.com/why-recycle.php
22
http://rcbc.bc.ca/files/u7/policy_090622_zwlocgovreport.pdf
23
http://www.zerowaste.co.nz/assets/Reports/ResourcefulCommunities-lowres.pdf
24
http://www.yesmagazine.org/blogs/richard-conlin/waste-not-seattles-road-to-zero-trash
25
http://stats.paperrecycles.org/index.php?graph=corrcont&x=37&y=9
26
http://www.mnn.com/money/green-workplace/stories/paper-recovery-and-recycling-sees-impressive-growth-in-the-us
27
http://bit.ly/gu0FNA
28
http://www.epa.gov/osw/conserve/materials/ecycling/
29
http://bit.ly/dE6GKi
30
Telephone interview with Shelly Codner of the IWE, December 29, 2010
31
http://www.usbcsd.org/project_detail.php?id=18
32
http://www.bridgingthegap.org/egap.php?id=278
33
http://www.epa.gov/epawaste/partnerships/wastewise/success.htm
34
http://www.epa.gov/epawaste/partnerships/wastewise/events/hall-fame.htm
35
http://voices.washingtonpost.com/local-breaking-news/dc/dc-gets-recycling-bins-courtes.html
36
http://www.rrttc.com/index.php?option=com_content&task=view&id=7&Itemid=10&parentid=0&mainid=81
NADO O Research Foundation
21
37
http://www.epa.gov/epawaste/conserve/tools/cpg/index.htm
38
http://law.justia.com/codes/missouri/2005/t04/0340000031.html
39
http://www.gogreencommunities.org/Default.aspx?id=1
40
http://www.dnr.mo.gov/env/swmp/docs/wcs2008.pdf
41
http://www.uvm.edu/~gbc/cdw/supportdocs/?Page=linksninfo.html
42
http://www.scgreenbuildingdirectory.org
43
http://www.calrecycle.ca.gov/RMDZ/
44
http://www.recyclemoreminnesota.org/rmm/about.html
45
http://www.epa.gov/osw/conserve/tools/localgov/benefits/
About the NADO Research Foundation Founded in 1988, the NADO Research Foundation is the nonprofit research affiliate of the National Association of Development Organizations (NADO). The NADO Research Foundation identifies, studies and promotes regional solutions, partnerships and strategies to strengthen the economic competitiveness and quality of place across America’s regions. The Research Foundation shares best practices and offers professional development training, analyzes the impact of federal policies and programs on regional development organizations, and examines the latest developments and trends in small metropolitan and rural America. Most importantly, the Research Foundation is helping bridge the communications gap among practitioners, researchers and policy makers. The NADO Research Foundation’s current portfolio of educational programs and research projects covers issues such as community and economic development, rural transportation planning, homeland security and emergency preparedness, post-disaster economic recovery, brownfields redevelopment, environmental stewardship and small business development finance. Visit www.nado.org to learn more about NADO and the NADO Research Foundation.
Recycling in the United States Re