Hedging with Chinese Metal Futures
Donald Lien and Li Yang* (Draft: February 2006)
JEL Classification: C13, C32, G13 Keywords: Time-varying Variance and Correlation, Dynamic Hedging, and Chinese Metal Futures Markets
Abstract This paper evaluates different hedging strategies for aluminum and copper futures contracts traded at the Shanghai Futures Exchange. In addition to usual candidates such as the traditional regression hedge ratio and the hedging strategy constructed from the conventional dynamic conditional correlation (DCC) model, two advanced DCC models are proposed to account for the impacts of the basis between spot and futures prices on market volatility and comovements. Empirical results suggest that the basis has asymmetric effects on the market behaviors. Moreover, the optimal hedging strategy constructed from the asymmetric BEC-DCC model produces the best in-sample and out-of-sample hedging performance during the period when these futures markets are sufficiently mature.
2
Hedging with Chinese Metal Futures
I. Introduction Copper and aluminum forward/futures contracts began trading in China in 1991. With the gradual transition from central planning to a market-oriented economy, Chinese futures markets have experienced tremendous development over the last 15 years. In the early stage, Chinese regulators struggled with duplicative exchanges and products, price volatility, large speculative interest, and market manipulations. Implementation of many regulatory reforms on the futures markets reduced the number of exchanges to just three and also led the markets to become more efficient, transparent, and integrated into international futures markets in the recent years. Currently, copper and aluminum futures contracts can only be traded at Shanghai Futures Exchange (SHFE), one of three remaining exchanges in China, and their prices display a certain degree of integration with the prices of copper and aluminum futures traded in London Metal Exchange (LME) (see, for example, Zhang, 2003) and therefore can be used to predict spot price movements1. Using daily price data of 1994 September and December copper futures contracts, Tung (1997) showed that variability of basis (i.e., difference between spot and futures prices) is smaller than variability of spot prices, suggesting that copper futures market can provide a hedging tool to domestic users. Although China’s State Council has given approval for eight Chinese nonferrous metal producers to engage in hedging in overseas futures markets (Platt’s Metals Week, Vol. 75, Iss. 33; Pg. 6), the number is limited as the government only grants
1
The LME is the major international spot and futures markets for the non-ferrous metals including copper and aluminum. Approximately 95% of the total world trade in copper futures occurs through the LME (Watkins and McAleer, 2003). The settlement prices determined on the LME are used internationally as reference prices for the valuation of activities relating to non-ferrous metals.
3
approval to companies with large output capacities and good performance. Therefore, a more careful study of optimal hedging strategy and hedging effectiveness is needed for the majority of domestic producers and consumers. Academic studies of Chinese copper and aluminum futures markets are limited, and in particular we can identify no studies of hedging strategies and hedging effectiveness for these markets. This paper presents the first attempt to fill in the gap. Several hedging strategies including naïve strategy, constant strategy, and different dynamic strategies are investigated for Chinese copper and aluminum futures. In addition to usual candidates such as the traditional regression hedge ratio and the hedging strategy constructed from the conventional dynamic conditional correlation (DCC) model, two advanced DCC models are proposed to account for the impacts of the basis on market volatility and co-movements. Empirical results suggest that the basis has asymmetric effects on the market behaviors. Moreover, the optimal hedging strategy constructed from the asymmetric BEC-DCC model produces the best in-sample and out-ofsample hedging performance during the period when these futures markets are sufficiently mature. The remainder of the paper is organized as follows. The immediately following section discusses the development of copper and aluminum futures trading in China. Thereafter, optimal hedging strategy and several model specifications are presented, including the OLS regression model, the DCC model, and the symmetric and asymmetric BEC-DCC models. We then turn to data descriptions and provide preliminary data analysis. The following section presents the estimated results for each model and discusses their implications. From which we construct dynamic hedged portfolios and evaluate hedging performance accordingly. The conclusion is given in the final section.
4
II. Development of Copper and Aluminum Futures Trading in China Copper and aluminum forward/futures contracts have been traded in China since 1991. A forward contract of copper was first introduced in Jin Peng Copper Exchange (JPCE) after the exchange was established in China in May 15, 1991. Copper was the only metal product traded on the exchange. The trading took place on every Friday morning, the only official trading day. The exchange did not take responsibility when buyers and sellers failed to deliver. With the establishment of Shenzhen Nonferrous Metal Exchange (SNME), the copper as well as aluminum forward contracts were then introduced to trade in the SNME on January 18, 1992. The trading hours of the exchange are from 9:00 am to 11:00 am Monday through Friday. Unlike the JPCE, the SZME takes the default risk of either side of a transaction. In addition, the initial margin is lower than that required in the JPCE. The benefits of trading in the SNME resulted in very low trading volume of copper contracts in the JPCE and eventually closure of the JPCE in 1993. On March 31, 1993, a standardized copper contract made its debut in Shanghai Metal Exchange (SHME) founded on May 28, 1992. A few months later, a standardized aluminum contract was listed in the SHME. The term and specifications of these contracts are stipulated by the Exchange in spot market trading. However, nonstandard forward contracts can be offset and transferred on the Exchange as well until the SHME informed member corporations on March 26, 1994 to cease forward trading of copper and aluminum, with the final date in September and April of 1994, respectively. Besides copper and aluminum futures contracts, Lead, Zinc, Tin and Nickel futures contracts were also traded in the SHME Monday through Friday. As for the
5
transactions that result in physical delivery, the Exchange is responsible for organizing the delivery. Due to lack of experience and regulatory slackness, several other exchanges opened up and traded their own copper and aluminum futures contracts within a short period of time. Nonetheless, the SHME still accounted for a large share of the total trading volume. Copper futures trading peaked at 1994-95. Aluminum trading gained its momentum after June 1997 when the exchanges reduce commission fees and margin requirements. On January 1, 1999, a new government regulation prescribed that both copper and aluminum futures contracts could only be traded at the Shanghai Futures Exchange (SHFE, renamed from SHME). Despite that excessive speculation prevailed in all the Chinese futures markets, both copper and aluminum futures markets are believed to be functioning effectively. Arbitrage activities from producers and industrial consumers keep futures prices in a good track with spot prices2, which results in a small basis and excellent hedging opportunity. In 1995 and 1996, the metal futures prices at the SHFE were adopted as the basis for state-allotted metals pricing, indicating that these prices can be used as a gauge of the domestic physical market movements. Over the years, Chinese copper and aluminum futures markets become more efficient, well controlled, and are capable to offer users facilities to hedge their risks.
III. Price Uncertainty, Optimal Hedging Strategy, and Model Specification The prices of copper and aluminum have historically fluctuated significantly over time in response to a variety of supply and demand factors. Supply of copper and aluminum is made up from two sources. The majority comes from primary production, i.e., new copper and aluminum
2
By the end of 1996, 162 firms dealing with non-ferrous metals applied to be registered as arbitragers at the SFE (Ye, 2003).
6
that are mined from the ground. Secondary supply comes from recycling scraps, which accounts for less than 20% and 30% of total refined copper and aluminum supply, respectively. Many factors can affect copper and aluminium production and therefore their prices such as labour unrest, industrial regulation and policies, and weather condition. New production also takes years into place as the scale of mining is large, it takes enormous financing, requires endless environmental permissions and needs extensive infrastructure as well. All these factors make it hard for the markets to balance demand and supply, therefore, copper and aluminium prices can fluctuate dramatically at any given time. These price fluctuations generate risk for firms who use refined copper and aluminium as primary inputs into their production process. The fluctuations also create volatility in cash flows for refiners who produce refined copper and aluminium. In order to protect themselves from these fluctuations, producers and consumers of copper and aluminium have the option of hedging by contracting in futures markets. The simplest way to hedge risk is that for one unit of a spot position, one unit of the opposite position in the futures market is taken. Thus, a hedge ratio is always equal to 1. This is what we call the naïve hedging strategy. If spot and futures prices move in the same direction and by the same amount, this hedging is perfect because the value of hedged portfolio (consisting of spot and futures positions) remains the same. Recognizing that spot and futures prices do not always move together, Johnson (1960) and Stein (1961) adopt a portfolio approach to determine the optimal hedging strategy via expected-utility maximization.
A simplification of their
framework leads to a minimum-variance (risk) hedging strategy, which has been utilized extensively (see, for examples, Ederington (1979), Kroner and Sultan (1993), and Brooks, Henry, and Persand (2002), among many others).
7
For simplicity, let’s consider a one-period framework. At time t, it is assumed that a copper (aluminum) refiner has a unit of copper (aluminum) in the production. Let χ t denote the amount of copper (aluminum) futures contracts he sells at t. Conventionally, χ t is called the hedge ratio. The return from his hedged portfolio is: R p ,t +1 = Rs ,t +1 − χ t R f ,t +1 , where Rs and R f are spot and futures returns, respectively. If he chooses an optimal futures position to minimize the conditional variance of his returns from the hedged portfolio, i.e., min{Var ( R p ,t +1 | I t )} ≡ min{Var ( Rs ,t +1 | I t ) + χ t2Var ( R f ,t +1 |I t ) − 2 χ t Cov ( Rs ,t +1 , R f ,t +1 | I t )} , where I t is the information
available at time t, then his optimal hedging strategy is obtained as
χ t* = ρ t +1 hs ,t +1 / h f ,t +1 ,
(1)
where hs ,t +1 = Var ( R s ,t +1 I t ) is the conditional variance of Rs ,t +1 , h f ,t +1 = Var ( R f ,t +1 I t ) is the conditional variance of R f ,t +1 , and ρ t +1 is the conditional correlation between Rs ,t +1 and R f ,t +1 . The portfolio variance corresponding to the optimal hedge ratio is Var ( R *p ,t +1 | I t ) = (1 − ρ t2+1 )hs ,t +1 .
(2)
If no futures position is undertaken, the hedger will incur spot return risk of hs ,t +1 . The optimal hedging strategy, therefore, reduces the hedger’s risk by ρ t2+1 hs ,t +1 or a percentage of ρ t2+1 in reduction of the spot return risk. To implement the optimal hedging strategy and derive the resulting portfolio variance, the optimal hedge ratio given in equation (1) must be estimated empirically. The estimation relies on assumption of data generating processes for spot and futures returns. Each model assumption leads to different parameter estimates and therefore different optimal hedging strategies. The simplest conventional model assumes stationary variances for spot and futures
8
returns and a stationary correlation coefficient. Consequently, the optimal hedge ratio can be obtained by estimating the following regression model:
Rs ,t = α + βR f ,t + u t .
(3)
The ordinary least squares (OLS) estimator for β corresponds to the estimator for the optimal hedge ratio, χ t*+1 , which is constant over time. Empirical studies, however, frequently found metal spot and futures prices to be cointegrated and obeying a long-run equilibrium relationship (Watkins and McAleer, 2004). Consequently, the market will react to the deviation from the long-run equilibrium relationship. Martinot, Lesourd and Morard (2000) showed that the difference between nonferrous metal spot prices and prices of their corresponding futures traded at the London Metal Exchange (LME), i.e., the basis help predict spot prices in the future time, which is consistent with the finding in Fama and French (1993).
To accommodate the possibility of a long-run equilibrium
relationship, spot and futures returns are specified as follows: p
q
i =1
j =1
p
q
i =1
j =1
Rs ,t = α s 0 + ∑ α si Rs ,t −i + ∑ β sj R f ,t − j + γ s Bt −1 + ε s ,t , R f ,t = α f 0 + ∑ α fi Rs ,t −i + ∑ β fj R f ,t − j + γ f Bt −1 + ε f ,t ,
(4) (5)
where Bt −1 = ln( p s ,t −1 ) − ln( p f ,t −1 ) is the lagged basis. p s ,t and p f ,t are the spot and futures prices at time t, respectively. There is also ample evidence to demonstrate that both variance and covariance are timevarying.
Hall (1991) and Figuerola-Ferretti and Gilbert (2000) applied generalized
autoregressive conditional heteroskedasticity (GARCH) model to the LME copper and aluminum futures prices, respectively. Bracker and Smith (1999) found GARCH model provides a good description of the prices of copper futures contracts traded at the New York Commodity
9
Exchange (COMEX). Further empirical supports are available in Watkins and McAleer (2002, 2004). To allow for time varying correlation between spot and futures returns, in this study we adopt dynamic conditional correlation (DCC) model of Engle (2002).
Specifically, let
Rt = ( Rst , R ft )′ and let ε t = (ε s ,t , ε f ,t ) ' . The conditional variance-covariance matrix of the return (and the residual) series is denoted as follows: ⎡ hs , t Var ( Rt I t −1 ) =Var (ε t | I t −1 ) ≡ H t = ⎢ ⎣hsf ,t
hsf ,t ⎤ . h f ,t ⎥⎦
(6)
The DCC model specifies
hs ,t = ω s + θ s ε s2,t −1 + +δ s hs ,t −1 ,
(7)
h f ,t = ω f + θ f ε 2f ,t −1 + δ f h f ,t −1 ,
(8)
ρ t = (1 − κ 1 − κ 2 ) ρ + κ 1 ρ t −1 + κ 2ψ t −1 ,
(9)
where ρ t = hsf ,t / hs ,t h f ,t . Because the conditional variances and covariance are time varying, the optimal hedge ratio, determined by equation (1), will change over time as well. Unlike the OLS estimation, this model specification, consisting of cointeraged mean equations (4) and (5) and time-varying variance and correlation equations (7)-(9), accommodate the time series properties of the data, particularly the long run relationships between spot and futures returns and time-varying variance and correlation of spot and futures returns. Therefore, we call this model specification a bivariate error correction model with a DCC error structure (BEC-DCC model). Pirrong and Ng (1997) examined energy futures prices and suggested that the size of basis has impacts on price volatility. Specifically, when the size of basis is large, spot and futures prices are more divergent from each other, indicating a lack or ineffectiveness of arbitrage activities. As a consequence, both markets become more volatile. Incorporating these
10
effects of basis into the DCC specification, we have following equations for the conditional variances and the conditional correlation: hs ,t = ω s + θ sε s2,t −1 + +δ s hs ,t −1 + ξ s Bt2−1 ,
(10)
h f ,t = ω f + θ f ε 2f ,t −1 + δ f h f ,t −1 + ξ f Bt2−1 ,
(11)
ρt = (1 − κ 1 − κ 2 ) ρ + κ 1 ρt −1 + κ 2ψ t −1 + μBt2−1 ,
(12)
where m
∑η
ψ t −1 =
h =1
m
η f ,t − h
s ,t − h
m
(13)
(∑η s ,t − h )(∑ (η f ,t −h ) 2
h =1
2
h =1
for m ≥ 2 , η s ,t = ε s ,t / hs ,t and η f ,t = ε f ,t / h f ,t are standardized residuals.
This model
prescribes that positive and negative bases have the same effects on the return behavior and is therefore called the symmetric BEC-DCC model. Sim and Zurbreugg (2000) replaced Bt2−1 with Bt −1 in equations (10)-(12) to examine the hedging effectiveness of KOSPI 200 futures contract. Zhong, Darrat and Otero (2004) employed a similar method (replacing the GARCH formulation with EGARCH and Bt2−1 with Bt −1 ) to investigate the hedging effectiveness of Mexico IPC index futures contract. We now consider the possible asymmetric effects of basis. First, we incorporate the asymmetric effects into the mean equations: p
q
i =1
j =1
p
q
i =1
j =1
Rs ,t = α s 0 + ∑ α si Rs ,t −i + ∑ β sj R f ,t − j + γ sp Bt+−1 + γ sn Bt−−1 + ε s ,t , R f ,t = α f 0 + ∑ α fi Rs ,t −i + ∑ β fj R f ,t − j + γ fp Bt+−1 + γ fn Bt−−1 + ε f ,t .
(14)
(15)
11
Herein the lagged basis is decomposed into positive and negative terms: Bt −1 = Bt+−1 + Bt−−1 such that Bt+−1 = max(Bt −1 ,0) and Bt−−1 = min( Bt −1 ,0) . Thus, adjustment speeds to restore the long-run equilibrium relationship when the futures market is in contango differ than these when the futures market is in backwardation. Note that equations (4)-(5) are obtained as a special case of (14) and (15) when γ sp = γ sn and γ fp = γ fn . Equations (14)-(15) construct a special case of threshold cointegration model; see Enders and Siklos (2001). Ewing, Hammoudeh, and Thompson (2005) found this specification provides better fits to energy spot and futures prices than the conventional cointegration model. Applying similar considerations to conditional variances and correlation produce the following equations: hs ,t = ω s + θ s ε s2,t −1 + δ s hs ,t −1 + ξ s Bt+−1 + ϕ s Bt−−1 ,
(16)
h f ,t = ω f + θ f ε 2f ,t −1 + δ f h f ,t −1 + ξ f Bt+−1 + ϕ f Bt−−1 ,
(17)
ρt = (1 − κ 1 − κ 2 ) ρ + κ 1 ρt −1 + κ 2ψ t −1 + μBt+−1 + νBt−−1 .
(18)
The above equations allow the basis to have the asymmetric effects on conditional variances and conditional correlation. Kogan, Livdan and Yaron (2003) provided a theoretical justification and documented empirical support in energy futures markets. Lien and Yang (2006) applied the same model to currency futures markets and found improvement in hedging effectiveness over the symmetric BEC-DCC model. Note that because the symmetric BEC-DCC model adopts squared basis whereas the asymmetric effect model incorporates positive and negative basis, the latter does not nest the former. We name this model specification an asymmetric BEC-DCC model.
12
With these model specifications including the OLS, BEC-DCC, symmetric BEC-DCC, and asymmetric BEC-DCC, we then estimate the optimal hedge ratios in Chinese copper and aluminum futures markets. Each model specification leads to different parameter estimates and therefore different optimal hedging strategies. To evaluate the performance of different hedging strategies, we compute the percentage reduction in the variation of the portfolio returns from these strategies. We then investigate the potential usefulness of the optimal hedging strategies derived from different model specifications.
IV. Preliminary Data Analysis
Daily closing prices of copper and aluminum futures contracts traded in the SHFE are used in this study. The sample covers from 1/1/1996 through 31/12/2004. To accommodate the development process of futures market in China, we divide the sample into two sub-periods: early development period from 1/1/96 to 31/12/1998 and post development period from 1/1/1999 to 31/12/2004. Due to continuous regulatory reforms in China, the choice of the sub-periods is somewhat ad hoc. Chan, Fung and Leung (2004) considered several futures markets and divided the sample period, 1996-2001, at the end of year of 1998. Zhang (2003) argued that SHFE/LME price ratio fluctuates greatly from 1993 to 1998 indicating the SHFE is not mature before 1999. We choose 1/1/99 to separate our sample period, as it is the date that the SHFE became the only exchange allowed to trade copper and aluminum futures contracts in China. SHFE started trading copper and aluminum futures contracts in 1993. Both contracts have the same specifications, which are presented in Table 1. There is one contract matured in every month, starting in January throughout December. Last trading days and delivery periods
13
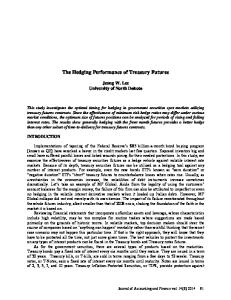
occur in the middle of each month. Price limit and margin requirements are imposed on both markets. As any futures contract is associated with expiration, to construct a continuous series of futures prices, the conventional approach relies upon the prices of the nearest to maturity contracts. The rationale is that the nearest to maturity contract tends to be the most liquid contract and therefore is the best instrument to summarize futures market information except perhaps that during the maturity month. An examination of the SHFE copper and aluminum futures markets reveals a different story. Peck (2004) found that the nearest to maturity futures contract is hardly the most liquid contract in China. It was reported that the most liquid contacts are 4 or 5 months to the maturity for copper and 3 or 4 months to the maturity for aluminum. We examine this issue using average trading volume for contracts with one month to maturity up to seven months to maturity over three different periods. The results are presented in Figures 1 and 2. Consistent with the previous findings, the contract with one month to maturity is not the most actively traded contract. For aluminum, trading volume is very small before January 1999. Nonetheless, in each period the largest average trading volume appear in the 6 months to maturity contracts. The trading volume for copper futures contracts is generally larger than that for aluminum futures. In each period, the four months to maturity contracts have the largest trading volume. Overall, we use daily closing prices of futures contracts with the 3 months to maturity for aluminum and 4 months to maturity for copper with rolling over to the next 3 or 4 months to maturity contracts at the beginning of each month to construct the series of futures prices. Finally, following a commonly adopted practice in the literature (Watkins and McAleer, 2004), we use the daily closing prices of the front month contract as a proxy for the spot prices.
14
After constructing the spot and futures prices series, we are able to calculate the returns from each series and the difference (basis) between the two series. Returns are calculated as changes in the natural logarithms of spot and futures prices. To avoid the problem with contract rollover, we delete the returns calculated using prices from different contracts. Table 2 presents summary statistics for the spot and futures returns and the basis. During the whole sample period, the spot market is less volatile than the futures market for both aluminum and copper. On the other hand, the spot return has a larger kurtosis than the futures return. That is, extreme observations are more likely to appear in the spot market. The standard deviation of the basis is larger than that of spot or futures returns, and hence the one-toone hedge strategy does not help reduce the risk. The spot and futures returns tend to be negatively skewed whereas the basis is always positively skewed. Note that the summary statistics for the spot and futures returns are closer to each other in the second sub-period. Thus, the spot and futures markets are more integrated after January 1999. Unit root test results indicate that both spot and futures prices are non-stationary whereas both returns are stationary. Cointegration test statistics conclude that the spot and futures markets are cointegrated for the complete sample period. On the other hand, except the second sub-period in aluminum, no cointegration relationship was found.
In these cases, not
surprisingly, the unit root statistics suggest that the basis is non-stationary. Table 2 also shows that, when a cointegration relationship exists, the cointegrating vector is close to [1 -1]. Moreover, the basis is found to be stationary. Thus, the basis appears to be a good and meaningful summary for the cointegration relationship. GARCH effects in spot and futures markets are supported by the Q2(20) statistics in each period whereas Q(20) statistics suggest that serial correlation prevails in both markets.
15
V. Estimation Results
To save space, we only provide the parameter estimates for the symmetric BEC-DCC and asymmetric BEC-DCC models. Table 3 presents the estimation results for the mean equations of the asymmetric BEC-DCC model, i.e., incorporating both positive and negative bases as explanatory variables. First, note that, in the first sub-period, spot and futures returns for both aluminum and copper follow a random walk. Price histories have no effects. Moreover, the aluminum spot return behaves like a random walk for the whole sample period as well. In the second sub-period, both spot and futures returns respond positively to the spot return in the previous day and negatively to the futures return in the previous day. The responses are stronger in the futures market than in the spot market. For the whole sample period, the futures returns react positively to the spot returns from the previous two days and negatively to the futures returns from the previous two days. The spot return does not respond to the basis in each period. In the complete sample period and the second sub-period, when the basis is negative (i.e., the spot price is less than the futures price), the futures return will decrease accordingly to restore the long run equilibrium relationship. On the other hand, a positive basis has no effect on the futures return. Turing to the copper market, the futures return responds negatively to the spot return of two days ago in the second sub-period. On the other hand, in the whole sample period and the second sub-period, the spot return of two days ago affects the current spot return negatively and the futures return of two days ago affects the current spot return positively. When the basis is positive, the spot return increases whereas the futures market does not respond at all. There is no convergence adjustment to the long run equilibrium relationship. When the basis is negative,
16
both spot and futures returns will decrease. However, the futures return decreases more than the spot return, which helps restore the long run equilibrium. Table 4 presents the estimation results of the mean equations for the symmetric BECDCC model. When spot and futures prices are not cointegrated, a vector autoregression model is adopted instead.
For the complete sample, both copper spot and futures returns respond
positively to the basis. Because the response coefficient for the futures is larger than that for the spot, the markets move toward the long run equilibrium relationship. For the other two cases, the test statistics indicate the prevalence of cointegration relationships but the estimated coefficients are not significant at the conventional levels. This surprising result may arise from the fact that the basis is not the actual cointegration relationship identified by the test. Otherwise, the results in Table 4 are similar to those in Table 3 except that both spot and futures returns are now sensitive to the returns of two days ago. Estimation results for equations (16)-(18) are summarized in Table 5. For the complete sample period and the second sub-period, the ARCH effects ( θ s and θ f ) are close to 0.1 and the GARCH effects ( δ s and δ f ) are close to 0.9. These estimates are similar to the findings in other more mature markets (Watkins and McAleer, 2002). The first sub-period presents the largest ARCH effects and the smallest GARCH effects. That is, in the early period, volatilities in both copper and aluminum markets are less persistent and tend to be driven by shocks. Volatility in aluminum markets is not affected by the basis whereas volatility in copper markets is affected by the negative basis except in the first sub-period. Specifically, a negative basis reduces market volatility (and more so in the futures than in the spot). In this case, the spot price is less than the futures price indicating a carryover charge. The more the carryover charge is, the more arbitrage opportunities prevail. As a consequence, both markets become less
17
volatile whereas spot and futures returns become more correlated (as validated by negative ν s and ν f for copper in Table 5). Similar observations on the correlation relationship are obtained for aluminum. We also found the correlation between copper spot and futures returns decreases as the positive basis increases. A positive basis signals market shortage and therefore reduces the comovement between spot and futures prices. Finally, note that the unconditional correlation ( ρ ) and the correlation persistence coefficient ( κ 1 ) are smallest in the first sub-period.
The
difference is most obvious in aluminum. Once again, these results suggest the markets are not mature in the period of 1996-1998. Table 6 presents estimation results for equations (10)-(12) in the symmetric BEC-DCC model. Similar observations on the correlation, ARCH and GARCH effects are observed. However, there are reversed responses to the basis. In aluminum, except in the first sub-period, as the absolute value of the basis increases, both spot and futures markets become more volatile. This result also appears in copper for the complete sample period. A large positive basis signals severe shortage problems loosening the relationship between spot and futures markets. Consequently, both markets become more volatile and the correlation becomes smaller. As stated previously, a negative basis would present the reversed outcomes. The estimation result depends upon whether positive or negative basis is the dominant factor. In copper, consistent with the dominance of positive basis, both markets become more volatile and the correlation decreases as the absolute basis increases. In aluminum, although the two markets become more volatile, the correlation increases as well. The unexpected result is treated as a statistical anomaly.
18
VI. Hedging Performance Comparisons
Based upon the above estimation results, we construct the dynamic hedge strategies and calculate the variances of the hedged portfolio. The results are provided in Table 7. For comparison purposes, we also include the strategy generated from the conventional DCC model, i.e., ignore the effect of basis, the OLS hedge strategy, and the naïve (one-to-one) hedge strategy. For copper, the asymmetric BEC-DCC model has the greatest hedging effectiveness (i.e., smallest portfolio variance) in the complete sample period and each sub-period. The symmetric BEC-DCC model ranks second. The naïve hedge strategy has the worst performance. For aluminum, the OLS strategy has the best whereas the asymmetric BEC-DCC model has the worst performance for the complete sample period. However, the undesirable result is driven by the data series from the first sub-period when the markets are not mature.
In fact, the
asymmetric BEC-DCC model leads to the greatest hedging effectiveness in the second subperiod. To evaluate the out-of-sample hedging effectiveness, we adopt the following procedure. First, we split the sample into two periods. Period 1 covers from the first day of the sample to the day where there are 250 days left. Period 2 covers those last 250 days in the sample. Specifically, in the whole sample, Period 1 covers from 1/1/96 to 12/31/2003 and Period 2 covers from 1/1/2004 to 12/31/2004. In the first sub-sample, Period 1 covers from 1/1/96 to 12/31/97 and Period 2 covers from 1/1/98 to 12/31/98. In the second sub-sample, Period 1 covers from 1/1/99 to 12/31/2003 and Period 2 covers from 1/1/2004 to 12/31/2004. We then use observations in period 1 to estimate the parameters in each model. Once we obtain the estimated parameters, we use them to predict the variance and correlation in the first day of period 2. Based on equations (1) and (2), we calculate the optimal hedge ratio in the last
19
day of period 1 and the portfolio returns in the first day of period 2. Next, we apply the rolling window method by dropping the first observation from period 1 and adding the first observation from period 2. We re-estimate the coefficients and calculate the optimal hedge ratio and the portfolio return at day 2 in period 2. The above procedure is repeated until the end of period 2. In aluminum, the asymmetric BEC-DCC model presents the best out-of-sample hedging performance for the complete sample period and the second sub-period. In the first sub-period, it is slightly dominated by the OLS strategy. For copper, the asymmetric BEC-DCC model has the worst performance in the complete sample period. However, it has the best performance in the second sub-period. From the in-sample and out-of-sample results, we conclude that the asymmetric BECDCC model provides the best hedging strategy if we ignore the period when the markets are not mature. The OLS hedge strategy ranks second in aluminum but performs much worse in copper. The symmetric BEC-DCC model performs slightly worse than the asymmetric effect model in both markets. The conventional DCC model and the naïve hedge strategy are both strictly dominated.
VII. Conclusions
This paper evaluates different hedging strategies for aluminum and copper futures contracts traded at the Shanghai Futures Exchange. To provide the most useful information to market participants, several statistical models are considered to generate the optimal hedging strategies, including the traditional regression hedge ratio, the conventional dynamic conditional correlation (DCC) model, and two more sophisticated models incorporating effects of the basis on market volatility and co-movements.
20
Empirical results suggest that the basis has asymmetric effects on the market behaviors. Specifically, the market behaves differently when the basis is positive as compared to when the basis is negative. This finding provides important implications for futures hedging. If we remove the sample period when the markets are not mature (i.e., 1996-1998), the optimal hedge strategy based upon the asymmetric BEC-DCC model produces the best hedging performance for both in-sample and out-of-sample comparisons among several competing models.
21
References
Alidade, A., Jia, H., and Tamvakis, M. (2004): Regime switching and forecasting performance of metal futures prices. Working paper, City University of London, UK. Bracker, K. and Smith, K. L. (1999): Detecting and modeling changing volatility in the copper futures market. Journal of Futures Markets, 19, 79-100. Chan, K. C., Fung, H.-G., and Leung, W. K. (2004): Intraday volatility behavior in Chinese Futures Markets. Journal of International Financial Markets, Institutions, and Money, 14, 491505. Enders, W. and Siklos, P. L. 2001. Cointegration and Threshold Adjustment. Journal of Business and Economic Statistics 19, 166-176. Ewing, B. T., Hammoudeh, S. M. and Thompson, M. A. (2005). Examining Asymmetry in Energy Futures and Spot Prices using M-TAR Model. Working Paper, Department of Economics, Drexel University, USA. Figuerola-Ferretti, I. and Gilbert, C. L. (2000): Has futures trading affect the volatility of aluminum transaction prices? University of London, UK. Fung, H. G., Leung, W. K., and Xu, X. E. (2003): Information flows between the U.S. and China commodity futures trading. Review of Quantitative Finance and Accounting, 21, 267-285. Gilbert, C. L. (1989): Futures trading, storage, and price stabilization. Review of Futures Markets, 8, 152-176. Hall, S. G. (1991): An application of the stochastic GARCH-in-mean model to risk premia in the London Metal Exchanges. Manchester School, 59, 57-71. Kocagil, A. E. (1997): Does futures speculation stabilize spot prices? Evidence from metals markets. Applied Financial Economics, 7, 115-125. Kogan, L. Livdan, D. and Yaron, A. 2003. Futures prices in a production economy with investment constraints. Working Paper, MIT Lien, D. and Yang, L. 2006. Spot-futures spread, time-varying correlation and hedging with currency futures. Journal of Futures Markets, forthcoming. Martinot, N., Lesourd, J. B., and Morard, B. (2000): On the information content of futures prices: application to LME nonferrous metal futures. Working paper, University of Geneva, Switzerland. Peck, A. (2004): The Development of Futures Markets in China: Evidence of Some Unique Trading Characteristics. Working Paper. Stanford University.
22
Shyy, G. and Butcher, B. (1994): Price equilibrium and transmission in a controlled economy: a case study of the metal exchange in China. Journal of Futures Markets, 14, 877-890. Sim, A. and Zurbreugg, R. 2000. The KOSPI 200 and Dynamic Hedging Effectiveness during the Asian Financial Crisis. Working paper series 2000-05, School of Banking & Finance, University of New South Wales, Australia. Tung, W. (1997): Formation of Chinese Commodity Futures Prices: Theory and Empirical Analysis. China Finance and Economics Publication Company. (in Chinese) Watkins, C. and McAleer, M. (2002): Modelling time-varying volatility in non-ferrous metal markets. in A. Rizzoli and A. Jakeman (eds.), Proceedings of the International Environmental Modelling and Software Society Conference, Lugano, Switzerland, 2, 550-555. Watkins, C. and McAleer, M. (2003): Pricing of non-ferrous metals futures on the London Metal Exchange. CIRJE Discussion Paper, University of Western Australia. Watkins, C. and McAleer, M. (2004): Econometric modeling of non-ferrous metal prices. Journal of Economic Surveys, 18, 651-701. Ye, Q. (2003): Essays on futures markets: comparative studies between Chinese and U.S. futures markets. Hubei People’s Publisher. (in Chinese). Zhang, G. P. (2003): Correlation analysis between Shanghai copper futures and international copper futures markets. Working paper, Shanghai Futures Exchange. (Written in Chinese) Zhong, M., Darrat, A. F. and Otero, R. 2004. Price discovery and volatility spillovers in index futures markets: some evidence from Mexico. Journal of Banking and Finance, 28, 3037-3054.
23
Table 1 Contract Specifications for SFE Aluminum and Copper Futures Underlying Product
Aluminum / Copper
Trading Unit
5 tons / lot
Quotation Unit
Yuan (RMB) / ton
Tick Size
10 Yuan / ton
Daily Price Limit
3% above or below the previous day’s settlement price
Contract Months
Jan., Feb., Mar., Apr., May, Jun., Jul., Aug., Sep., Oct., Nov., Dec.
Trading Hours
9:00 – 11:30 AM 1:30 – 3:00 PM
Last Trading Day
15th of the spot month (postponed in case of legal holidays)
Delivery Period
16th –20th of the spot month (postponed in case of legal holidays)
Delivery Sites
SHFE approved warehouse
Delivery Grades
Standard goods or LME registered brand
Transaction Margin
5% of the contract value
Transaction Fee
Less than 0.2% of the trading value (including risk reverse payment)
Delivery Method
Physical delivery
Symbol AL / CU Source: Shanghai Futures Exchange as of Feb. 20, 2005.
24
Table 2 Summary Statistics of Spot Returns, Futures Returns, and Basis Std.Dev Skewness Kurtosis Max Min Z u (tα ) Z c (tα ) Q(20) Q2(20) Aluminum Rs -0.0001 0.0068 -0.0808 5.6473 0.0503 -0.0310 -15.00 -5.10a 57.14 455.4 48.78 993.2 Rf -0.0002 0.0078 -0.1920 3.7958 0.0357 -0.0341 -15.41 Basis -0.0022 0.0145 0.8152 2.7194 0.0712 -0.0552 -4.47
Period Variable Mean
P1
P2
P3
P1
P2
P3
Rs Rf
0.5143 0.0303 1.1766
5.3512 0.0503 -0.0305 -6.65 2.1022 0.0357 -0.0337 -6.84 2.4266 0.0712 -0.0552 -2.85
-2.46
21.05 34.75
42.95 182.2
0.0000 0.0062 -0.4746 -0.0001 0.0071 -0.3050 Basis -0.0009 0.0123 0.8654
4.4656 0.0277 -0.0310 -13.64 4.3882 0.0286 -0.0341 -14.17 2.1604 0.0578 -0.0265 -3.95 Copper 1.9291 0.0305 -0.0370 -18.17 1.2039 0.0299 -0.0373 -18.78 5.9648 0.12468 -0.0520 -3.84
-4.27b
46.97 40.92
657.6 730.5
-4.02c
36.14 28.04
588.3 678.1
Rs Rf
2.4703 0.0238 -0.0311 -10.11 1.3457 0.0299 -0.0307 -10.41 0.0700 0.0495 -0.0520 -3.58
-3.52
21.81 19.33
153.8 164.2
Rs Rf
1.6559 0.0305 -0.0370 -15.01 1.0926 0.0293 -0.0373 -15.60 5.3475 0.1247 -0.0349 -2.28
-2.82
32.67 35.79
457.8 551.1
-0.0006 0.0086 -0.0005 0.0097 Basis -0.0069 0.0195
Rs Rf
Rs Rf
-0.0004 0.0096 -0.4968 -0.0004 0.0107 -0.4046 Basis -0.0092 0.0271 2.1527 -0.0008 0.0086 -0.6042 -0.0003 0.0100 -0.2618 Basis -0.0150 0.0207 0.3359 -0.0001 0.0102 -0.4781 -0.0005 0.0110 -0.4524 Basis -0.0062 0.0294 2.3284
Note that the critical values of unit root and cointegration tests at 5% significance level are -3.4318 and 3.8493, respectively. P1 covers from 01/01/96 to 31/12/04, P2 covers from 01/01/96 to 31/12/98, and P3 covers from 01/01/99 to 31/12/04. a
The cointegrating vector is [1 –0.966]. The cointegrating vector is [1 –0.971]. c The cointegrating vector is [1 –0.983] b
25
Table 3 Coefficient Estimates of Mean Equations in Asymmetric BEC-DCC Model
Rst
α s0
α s1
01/96-12/04
0.0034
0.0428
(0.142)
(0.896)
-0.0917
-0.0762
(-1.260)
α s2
β s1
β s2
γ s _ pb
γ s _ nb
0.0724
0.0026
-0.0428
-0.0102
0.0148
(1.526)
(0.062)
(-1.029)
(-0.538)
(0.722)
0.1180
0.0023
-0.0301
(-0.938)
(1.624)
(0.059)
(-0.716)
0.0249
0.1977
-0.1347
-0.0132
0.0371
(1.008)
(3.087)
(-2.420)
(-0.593)
(1.411)
Aluminum
01/96-12/98 01/99-12/04
Copper 01/96-12/04 01/96-12/98 01/99-12/04
R ft
0.0101
-0.0644
-0.1405
0.0511
0.1230
0.0223
0.0272
(0.288)
(-0.967)
(-2.112)
(0.861)
(2.076)
(1.997)
(1.628)
-0.0908
-0.0922
-0.0845
0.0726
0.0960
-0.0179
0.0108
(-1.564)
(-0.930)
(-0.854)
(0.895)
(1.185)
(-0.441)
(0.477)
0.0781
-0.0630
-0.1852
0.0426
0.1473
0.0203
0.0423
(1.642)
(-0.679)
(-2.001)
(0.495)
(1.717)
(1.661)
(1.674)
αf0
α f1
αf2
β f1
βf2
γ f _ pb
γ f _ nb
Aluminum 01/96-12/04 01/96-12/98 01/99-12/04
0.0195
0.2047
0.1345
-0.1503
-0.1133
-0.0094
0.0473
(0.722)
(3.769)
(2.495)
(-3.140)
(-2.392)
(-0.436)
(2.033)
0.0260
0.1324
0.0207
-0.0080
0.0536
(0.318)
(1.453)
(0.254)
(-0.181)
(1.137)
0.0249
0.2953
-0.2759
-0.0075
0.0570
(0.876)
(4.012)
(-4.313)
(-0.292)
(1.885)
Copper 01/96-12/04 01/96-12/98 01/99-12/04
0.0202
0.0368
-0.1043
-0.0418
0.0850
0.0141
0.0385
(0.511)
(0.493)
(-1.398)
(-0.628)
(1.278)
(1.128)
(2.054)
-0.0462
-0.0192
-0.0217
-0.0045
0.0298
-0.0181
0.0283
(-0.649)
(-0.157)
(-0.178)
(-0.045)
(0.299)
(-0.362)
(1.015)
0.0670
0.0604
-0.1715
-0.0648
0.1360
0.0131
0.0485
(1.309)
(0.605)
(-1.721)
(-0.699)
(1.472)
(0.997)
(1.781)
26
Table 4 Coefficient Estimates of Mean Equations in Symmetric BEC-DCC Model
Rst
α s0
α s1
α s2
β s1
β s2
γ s _ pb
Aluminum 01/96-12/04 01/96-12/98 01/99 – 12/04
-0.0100
0.0431
0.0722
0.0020
-0.0431
0.0016
(-0.612)
(0.903)
(1.523)
(0.047)
(-1.035)
(0.138)
-0.0522
-0.0833
0.0036
0.1227
0.0329
(-1.194)
(-1.014)
(0.044)
(1.683)
(0.456)
-0.0004
0.2011
0.1455
-0.1456
-0.1281
0.0035
(-0.025)
(3.092)
(2.264)
(-2.564)
(-2.283)
(0.253)
Copper 01/96-12/04 01/96-12/98 01/99 – 12/04
R ft
0.0041
-0.0642
-0.1404
0.0508
0.1229
0.0140
(0.192)
(-0.963)
(-2.111)
(0.856)
(2.074)
(3.181)
-0.1162
-0.0931
-0.0839
0.0733
0.0960
(-3.428)
(-0.942)
(-0.851)
(0.911)
(1.193)
0.0324
-0.0176
-0.1475
0.0031
0.1157
(1.262)
(-0.191)
(-1.605)
(0.036)
(1.355)
αf0
α f1
αf2
β f1
βf2
γ f _ pb
Aluminum 01/96-12/04 01/96-12/98 01/99 – 12/04
-0.0109
0.2055
0.1341
-0.1517
-0.1139
0.0174
(-0.584)
(3.782)
(2.487)
(-3.168)
(-2.403)
(1.333)
-0.0348
0.1675
0.1288
-0.0196
-0.0833
(-0.709)
(1.820)
(1.390)
(-0.240)
(-1.028)
-0.0066
0.3196
0.1623
-0.3049
-0.1677
0.0141
(-0.342)
(4.269)
(2.194)
(-4.666)
(-2.597)
(0.885)
Copper 01/96-12/04 01/96-12/98 01/99 – 12/04
-0.0094
0.0383
-0.1039
-0.0439
0.0842
0.0228
(-0.389)
(0.513)
(-1.392)
(-0.659)
(1.265)
(2.687)
-0.1032
-0.0142
-0.0157
-0.0103
0.0238
(-2.479)
(-0.117)
(-0.129)
(-0.105)
(0.241)
0.0074
0.1017
-0.1396
-0.1012
0.1092
(0.268)
(1.030)
(-1.413)
(-1.102)
(1.190)
27
Table 5 Coefficient Estimates of Variances and Correlation in Asymmetric BEC-DCC Model
hst
ωs
θs
δs
ξs
ϕs
01/96 – 12/04
0.0012 (0.805) 0.0968 (1.452) 0.006 (2.352)
0.0803 (3.219) 0.1371 (3.294) 0.0994 (4.451)
0.9118 (29.484) 0.7218 (10.146) 0.8754 (34.936)
0.0031 (1.210) 0.0057 (0.179) 0.004 (1.403)
-0.0044 (-1.098) -0.0052 (-0.239) -0.0028 (-1.229)
0.0321 (3.403) 0.0725 (0.905) 0.0289 (2.658)
h ft
ϕf
0.0628 (6.264) 0.0774 (2.113) 0.0552 (4.747)
0.9064 (55.344) 0.8267 (6.492) 0.9198 (52.701)
0.0038 (1.314) 0.0032 (0.215) 0.0035 (1.129)
0.0037 (2.115) 0.0039 (0.423) 0.0061 (2.099)
01/96 – 12/04
0.0024 (1.137) 0.0718 (2.076) 0.0088 (1.987)
0.0776 (4.539) 0.1566 (3.366) 0.0846 (4.686)
0.9143 (44.745) 0.7147 (7.639) 0.8913 (40.305)
0.0036 (1.237) 0.0453 (0.737) 0.0026 (0.781)
-0.0033 (-0.992) -0.0196 (-0.829) -0.0018 (-0.737)
0.0371 (3.267) 0.0934 (1.256) 0.0376 (2.598)
0.0586 (6.478) 0.0621 (3.770) 0.0543 (5.049)
0.9140 (58.776) 0.8619 (12.991) 0.9183 (50.713)
0.0031 (1.053) 0.0160 (0.708) 0.0029 (0.922)
0.0052 (2.596) 0.0088 (0.846) 0.0084 (2.205)
κ1
κ2
μ
ν
ρ
-0.0002 (-0.278) -0.0017 (-0.145) -0.0125 (-1.589)
-0.0022 (-3.104) -0.0064 (-1.185) -0.0048 (-1.826)
0.862
-0.0002 (-2.572) -0.0001 (-0.274) -0.0002 (-2.153)
-0.0001 (-6.233) -0.0001 (-1.371) -0.0001 (-5.732)
0.943
Aluminum 01/96 – 12/98 01/99 – 12/04
Copper 01/96 – 12/04 01/96 – 12/98 01/99 – 12/04
θf
δf
ξf
ϕf
Aluminum 01/96 – 12/98 01/99 – 12/04
Copper 01/96 – 12/04 01/96 – 12/98 01/99 – 12/04
ρt
Aluminum 01/96 – 12/04 01/96 – 12/98 01/99 – 12/04
0.9402 (42.233) 0.5392 (3.928) 0.682 (4.722)
0.0208 (2.450) 0.0699 (2.058) 0.0247 (1.352)
0.9971 (20.166) 0.9927 (10.789) 0.9959 (6.273)
0.0007 (1.768) 0.0014 (0.588) 0.0006 (0.870)
0.784 0.905
Copper 01/96 – 12/04 01/96 – 12/98 01/99 – 12/04
28
0.922 0.955
Table 6 Coefficient Estimates of Variances and Correlation in Symmetric BEC-DCC Model
hst
ωs
01/96 – 12/04
0.0022 (1.323) 0.1020 (1.694) 0.0046 (2.167)
θs
δs
ξs
0.9157 (30.274) 0.7096 (9.242) 0.882 (41.608)
0.0017 (1.879) 0.0018 (0.297) 0.0017 (2.192)
0.9067 (55.396) 0.8325 (7.361) 0.9249 (47.831)
0.0041 (2.845) 0.0028 (0.440) 0.0016 (1.284)
0.9171 (48.247) 0.7358 (7.935) 0.9015 (44.936)
0.0015 (2.021) 0.0035 (0.580) 0.0015 (1.942)
0.914 (60.133) 0.8694 (14.293) 0.9219 (44.577)
0.0053 (3.028) 0.0080 (0.875) 0.0023 (1.422)
0.0002 (2.470) 0.0006 (0.435) 0.0000 (0.175)
0.862
-0.0001 (-8.617) -0.0002 (-1.401) -0.0016 (-2.622)
0.943
Aluminum 01/96 – 12/98 01/99 – 12/04
0.0711 (3.035) 0.1467 (3.018) 0.0982 (4.756)
Copper 01/96 – 12/04 01/96 – 12/98 01/99 – 12/04
0.0325 (3.536) 0.0672 (1.018) 0.0171 (2.340)
h ft
ϕf
01/96 – 12/04
0.0033 (1.527) 0.0781 (1.980) 0.0058 (1.761)
0.0626 (6.270) 0.0753 (2.246) 0.0526 (4.179)
θf
δf
ξf
Aluminum 01/96 – 12/98 01/99 – 12/04
0.0699 (4.527) 0.1558 (2.935) 0.0802 (4.622)
Copper 01/96 – 12/04 01/96 – 12/98 01/99 – 12/04
ρt
0.0371 (3.396) 0.0864 (1.276) 0.0219 (2.266)
κ1
0.0583 (6.598) 0.0606 (3.756) 0.0533 (4.319)
κ2
μ
ρ
Aluminum 01/96 – 12/04 01/96 – 12/98 01/99 – 12/04
0.9511 (52.272) 0.5991 (1.739) 0.9716 (75.163)
0.0164 (2.535) 0.0517 (1.042) 0.006 (1.831)
0.784 0.905
Copper 01/96 – 12/04 01/96 – 12/98 01/99 – 12/04
0.9967 (20.760) 0.9875 (95.091) 0.8394 (12.850)
0.0011 (4.116) 0.0021 (1.021) 0.0140 (2.098)
29
0.922 0.955
Table 7 Hedged Portfolio Variance: In-Sample and Out-of-Sample Results Aluminum
Copper In-sample
Models Asymmetric BEC-DCC Symmetric BEC-DCC DCC OLS Naïve hedge Asymmetric BEC-DCC Symmetric BEC-DCC DCC OLS Naïve hedge
01/9612/04 0.1265 0.1258 0.1258 0.1210 0.1586 0.0918 0.0921 0.0930 0.1004 0.1315
01/96 – 12/98 0.3237 0.3238 0.3226 0.2927 0.3853
01/9912/04 0.0560 0.0694 0.0705 0.0685 0.0930
01/9612/04 0.0909 0.0910 0.0915 0.0950 0.1222
01/96 – 12/98 0.1086 0.1088 0.1091 0.1137 0.1838
01/9912/04 0.0794 0.0796 0.0799 0.0779 0.0909
0.2394 0.2395 0.2421 0.2382 0.2499
Out-of-sample 0.0947 0.2748 0.0950 0.2746 0.0951 0.2721 0.0949 0.2677 0.1315 0.2952
0.0707 0.0708 0.0712 0.0702 0.1016
0.2560 0.2562 0.2771 0.2628 0.2952
30
Figure 1. Average trading volume of aluminum futures contracts associated with the month to maturity over three different periods, P1: 01/01/96 – 31/12/04, P2: 01/01/96 – 31/12/98, and P3: 01/01/99 - 31/12/04.
p1
4000
p2
p3
3000 2000 1000 0 0
1
2
3
4
5
6
7
8
Month to Maturity
Figure 2. Average trading volume of copper futures contracts associated with the month to maturity over three different periods, P1: 01/01/96 – 31/12/04, P2: 01/01/96 – 31/12/98, and P3: 01/01/99 - 31/12/04.
p1
20000
p2
p3
15000 10000 5000 0 0
1
2
3
4 Month to Maturity
31
5
6
7
8