HP A EA P EDNED RI C E I ESS
B Track-It Hennepin Indicators 2012: Baseline Indicators and Data Roadmap
9
10
P LA N - I T H E N N E P I N
Track-It Hennepin 2012: Baseline Indicators and Data Roadmap Anne Gadwa Nicodemus, Metris Arts Consulting
BACKGROUND
Track-It Hennepin is a proposed system of indicators to support Plan-It Hennepin. The Hennepin Cultural District Alliance, in partnership with City departments, Metro Transit, Downtown Improvement District, and cultural organizations, will annually compile and share key indicators related to Plan-It Hennepin’s long-term outcomes. Track-It Hennepin helps advance multiple objectives: 1. Track progress: Allow stakeholders to monitor progress towards reaching long-term outcomes 2. Promotion and accountability: Make more visible what’s already in existence, share direct accomplishments, and motivate a broad range of stakeholders to advance the Plan-It Hennepin vision 3. Diagnostics: Monitor changes that aren’t necessarily impacts of Plan-It Hennepin, but inform strategy and allow organizers to be responsive in meeting changing needs The proposed indicators monitor 12 outcomes that align under five areas: 1. Attract people and improve experience and perceptions 2. Foster an activity-rich and inclusive cultural environment 3. Strengthen arts and cultural organizations and support artists 4. Generate positive economic momentum 5. Monitor for unintended consequences and equitable revitalization
The first two outcomes areas closely overlap with Plan-It Hennepin’s five stated long-term outcomes, from a vibrant, activity-rich and seamless downtown “campus” to distinctive public art. The third outcome area focuses on whether Hennepin Cultural District activities strengthen arts and cultural organizations and support artists, which in turn would help them advance Plan-It Hennepin’s broader objectives. The fourth outcome area looks for signs of economic revitalization, specifically for the creative sector and more broadly. Finally, the last outcome area includes “red-flags” for unintended negative consequences, such the displacement of arts organizations, people of color, or lowincome residents. By pro-actively looking for these signs, it’s more likely that equitable revitalization can be fostered. This report presents baseline data (available to date) that will be used for future comparisons, explains the methods employed to develop the indicator system, and provides a data source and collection “roadmap” for moving forward.
B: TR AC K- I T H E N N E P I N
11
COMMENTS
BASELINE DATA YEAR
HENNEPIN CULTURAL DISTRICT OR VICINITY
MINNEAPOLIS
INDEX
INDICATOR
Track-It Hennepin 2012: Baseline Indicators to date
Attract people and improve experience and perceptions 1 MORE PEOPLE LIVE NEAR / IN HENNEPIN CULTURAL DISTRICT Population1 Housing Units2
2
Increase over time
382,578
21,943
2010
178,287
16,858
2010
Increase over time
NA
NA
MORE PEOPLE VISIT HENNEPIN CULTURAL DISTRIC Attendance at cultural events3
73%
2012
% of respondents whose visits included multiple destinations at least 50% of the time4
40%
2012
NA
NA
Promisingly high numbers of respondents indicated frequent visits and multi-destination trips, however there is still much room for improvement. Baseline to be gathered in 2013. Cultural Data Project only launched in summer 2012
THE PHYSICAL EXPERIENCE FEELS MORE VIBRANT, BEAUTIFUL / INSPIRING, WALKABLE, AND SAFER % of respondents rating Hennepin Cultural District as vibrant4
43%
2012
% of respondents rating Hennepin Cultural District as beautiful and inspiring4
20%
2012
% of respondents rating Hennepin Cultural District as walkable4
64%
2012
% of respondents rating Hennepin Cultural District as safe4
32%
2012
31
2012
89
2011
149
2011
see maps
2011
Increase over time
Permits for sidewalk cafés6
4
Baseline to be gathered in 2013. Cultural Data Project only launched in summer 2012
% of respondents that visit 6 or more times/year4
Bus boardings/de-boardings, LRT boardings5
3
About 6% of Minneapolis’ population lives in the Hennepin Cultural District vicinity. It hosts 9% of the city’s housing units.
While 64% of respondents rated the Hennepin Cultural District as walkable, only 20% view it as beautiful and inspiring. All these indicators leave plenty of room for improvement.
CRIME IS REDUCED Robberies/year7 Theft from motor vehicles/year
7
Crime in Hot Spots7
Decrease over time
1,604 4,284
The Minneapolis police department recommends robberies and theft from motor vehicles as excellent "proxy" crimes. Maps of persistent crime “hot spots” can inform physical and programmatic interventions
COMMENTS
BASELINE DATA YEAR
HENNEPIN CULTURAL DISTRICT OR VICINITY
INDEX
INDICATOR
MINNEAPOLIS
P LA N - I T H E N N E P I N
12
Foster an activity-rich and inclusive cultural environment 5 HENNEPIN CULTURAL DISTRICT PROVIDES ABUNDANT CULTURAL OFFERINGS Permits for festivals/parades8
Compare to baseline
Numbers and kinds of cultural events3
6
10
2011
NA
NA
Baseline to be gathered in 2013. Cultural Data Project only launched in summer 2012
NA
NA
Baseline to be gathered in 2013 via organizational survey
NA
NA
Baseline to be gathered in 2013. Cultural Data Project only launched in summer 2012
NA
NA
Baseline to be gathered in 2013 via organizational survey
NA
NA
Baseline to be gathered in 2013. Cultural Data Project only launched in summer 2012
New, paid opportunities: public art commissions, coordinating pop-up programs and/or tours.10
NA
NA
Baseline to be gathered in 2013 via internal tracking by cultural district organizers
Support for artist housing and creative/cultural enterprises.10
NA
NA
16,400
1,880
2010
980
76
2010
19,808
6,976
2011
$433.0M
$172.1M
2011
$61.3M
$8.4M
2010
Nearly 14% of Minneapolis' local option sales tax revenues came from the Hennepin Cultural District
11,400
420
2010
The Hennepin Cultural District hosts nearly 4% of Minneapolis' business establishments
HENNEPIN CULTURAL DISTRICT PROVIDES INCLUSIVE CULTURAL OFFERINGS % of organizations that feel that they are serving the needs of different demographic groups (people of color, low income people, children/families, etc.)9
Increase over time
Strengthen arts and cultural enterprises and support artists 7 HENNEPIN CULTURAL DISTRICT ACTIVITIES BOLSTER ARTS AND CULTURAL ENTERPRISES AND ARTISTS % of organizations with increases in attendance3
Increase over time
% of organizations that link district activity with boosts to their visibility, patronage, collaborations/ partnerships, and increased capacity9 Financial performance metrics for arts and cultural nonprofits9
Compare to baseline
Generate positive economic momentum 8 BOLSTER CREATIVE ORGANIZATIONS, BUSINESSES, AND WORKFORCE
Number of creative industry jobs11
Increase over time
Number of creative industry business establishments11 Number of creative occupation jobs12 Annual revenues in select creative industries
12
9
The Hennepin Cultural District and its vicinity already host many of the city's creative industry jobs, business establishments, and creative occupation jobs. Due to methodological differences, CPED Research and WESTAF Creative Vitality Index data are not directly comparable.
BOLSTER OTHER NEIGHBORHOOD BUSINESSES AND ORGANIZATIONS Local Option Sales Tax11 Number of business establishments11
Increase over time
10
13
COMMENTS
BASELINE DATA YEAR
HENNEPIN CULTURAL DISTRICT OR VICINITY
MINNEAPOLIS
INDEX
INDICATOR
B: TR AC K- I T H E N N E P I N
PROPERTY VALUES AND TAX BASE RISE Real estate estimated market value (commercial/ industrial)11
$581.9M
Increase over time
2011
Monitor for unintended consequences and equitable revitalization 11 BENEFITS TO CULTURAL ORGANIZATIONS OUTWEIGH ANY COSTS
12
% of organizations that link Hennepin Cultural District activities to a climate in which some organizations are at risk of dislocation due to rising rent/ space costs9
NA
NA
% of organizations that feel that the benefits of Hennepin Cultural District to cultural organizations activities outweigh any costs to them9
NA
NA
382,578
21,943
2010
3%
1%
2010
8%
8%
2010
Black
25%
12%
2010
White
86%
95%
2010
Some other race
8%
2%
2010
Two or more races
6%
4%
2010
Hispanic/Latino (of any race)
10%
4%
2010
% of households with less than $10,000 income
NA
NA
% of households with less than $10,000-$29,000 income13
NA
NA
Baseline to be gathered in 2013 via organizational survey
LITTLE EVIDENCE OF GENTRIFICATION-LED DISPLACEMENT OF PEOPLE OF COLOR AND LOW-INCOME RESIDENTS Population1
Compare to baseline and Mpls mix over time
By race/ethnicity1 American Indian Asian
13
Baseline to be gathered in 2013. Data for this geography unavailable at publication date. (American Community Survey, 2007-2011 5-year estimates will be released 12/5/12 )
NOTES
SOURCES 1. Census, American Community Survey 5-year estimates 2. Census, American Community Survey 5-year estimates, New permitted projects (City of Minneapolis) 3. Cultural Data Project 4. Downtown perception survey (Downtown Improvement District), Minneapolis Residents’ Survey (City of Minneapolis City Coordinator’s Office) 5. Metro Transit 6. City of Minneapolis Business Licensing
At the 2010 baseline, the population in the Hennepin Cultural District vicinity is less ethnically and racially diverse than the city overall.
7. Minneapolis Police Department 8. City of Minneapolis Public Works 9. Organizational Survey (Hennepin Cultural District Alliance) 10. Administrative data (Hennepin Cultural District Alliance) 11. Commercial corridor analyses (City of Minneapolis CPED Research) 12. Cultural Vitality Index (WESTAF) 13. American Community Survey 5-year estimates
Socio-economic population/housing data reflects Hennepin Cultural District “vicinity” boundaries (Census zip code tabulation areas for 55401, 55402, and 55403). Survey respondents are downtown workers targeted through the Minneapolis Downtown Improvement District’s annual survey. Crime, sidewalk cafe and parade permit, and CPED Research corridor analysis data reflect the Hennepin Cultural District geographic boundary. WESTAF Creative Vitality Index creative industry/job data reflect estimates for the 55401, 55402, and 55403 zip codes; WESTAF Creative Vitality Index estimates for Minneapolis also correspond to aggregated zip codes, and do not match the city’s political boundary. For more details on sources and geographies, see accompanying discussion and boundary map.
14
P LA N - I T H E N N E P I N
CRIME HOT SPOTS, HENNEPIN CULTURAL DISTRICT (2011)
AGGRAVATED ASSAULTS (NON-DOMESTIC) In 2011, the black grid had 54 assaults occur in that area, where as the red grid had 24 assualuts occur and the orange grids had 5 to 12 assaults occur in those areas.
ROBERY In 2011, the black grids had 14 to 35 robberies occur in that area, where as the red grids had 8 to 13 robberies occur.
LARCENY In 2011, the black grid had 481 larcenies occur in that area, where as the red grid had 102 to 246 larcenies occur in those areas.
THEFT FROM MOTOR VEHICLE In 2011, the black grid had 26 to 41 theft from motor vehicle incidents occur in that area, where as the red grid had 14 to 25 theft from motor vehicle incidents occur in those areas.
AUTO THEFT In 2011, the black grid had 12 auto theft incidents occur in that area, where as the red grid had 6 to 8 auto theft incidents occur in those areas.
Source: Minneapolis Police Department, Crime Analysis Unit
B: TR AC K- I T H E N N E P I N
NOTES ON METHODS
To develop Track-It Hennepin, Anne Gadwa Nicodemus, principal of Metris Arts Consulting examined other indicator efforts, led interactive sessions with stakeholders, consulted with area technical experts, and analyzed evolving drafts of the Plan-It Hennepin report. Literature review. Nicodemus explored 14 other indicator efforts (both general and those specific to arts and culture) and cultural industry reports. Though community indicators date back to 1910 (Phillips 2003, 2), and a few integrate measures of arts and cultural vitality (Greater Portland Pulse 2011; The Chicago Community Trust and Chicago Metropolitan Agency for Planning 2012; Metropolitan Philadelphia Indicators Project 2006), most efforts have a regional, not sub-city, focus. However, through its National Neighborhood Indicators Partnership and Arts and Cultural Indicators Project, the Urban Institute has supported pioneering efforts to develop community indicators for the neighborhood level and arts and cultural indicators for the city and metro levels (Guernsey and Pettit 2007; Jackson and Herranz 2002; Jackson, Kabwasa-Green, and Herranz 2006; Kingsley 1999). Efforts to track community changes related to creative placemaking efforts at small geographic scales is an emergent (ArtPlace 2012; National Endowment for the Arts 2012), and hotly debated (Markusen 2012; Moss 2012; Gadwa Nicodemus 2012; ArtPlace 2012) field. Track-It Hennepin differs in a few critical ways from the concurrent vibrancy and livability indicator systems in development by ArtPlace and the National Endowment for the Arts, respectively; Track-It Hennepin makes extensive use of rich local data sources, reflects Plan-It Hennepin’s specific geographic scope and goals, and includes more metrics related to arts and culture. Created in tandem with the Plan-It Hennepin process, stakeholders informed both the outcomes included in the planning document and the indicator system’s development. In spring
2012, Nicodemus led three interactive sessions: a work session with steering committee members and invited technical experts, a focus group with vicinity residents, and a focus group with diverse commercial interests (businesses, arts and cultural nonprofits, and educational institutions). Nicodemus also investigated existing local data collection efforts and explored possible data collection partnerships through conversations with representatives from the City of Minneapolis (CPED Research; Director of Arts, Culture, and the Creative Economy; Public Works; and Police Department Crime Analysis Unit), the University of Minnesota’s Center for Urban and Regional Affairs (CURA), the Wilder Foundation, the Downtown Improvement District, Meet Minneapolis, NorthMarq, Metro Transit, and Pedestrian Studies. The Track-It indicators take advantage of collaborative data arrangements with many of these local entities. Track-It Hennepin’s data analysis outcome areas and indicators were developed through an iterative process. Nicodemus analyzed numerous iterations of the planning document draft and drew from them to develop logic models. She submitted proposed indicators to project manager Tom Borrup and the Plan-It Hennepin leadership partners, and made revisions based on their feedback as well as that received from CPED research staff members. In addition to the recommended Track-It indicators, we explored, and ultimately did not adopt, an additional 12 indicators and 10 data sources. Our indicator selections reflect the following evaluative criteria: • Relevance to Plan-It Hennepin outcomes, strategies and geographic scale • Data availability: existing secondary sources (public domain vs. proprietary), original data collection, and/or cooperation of partner organizations/agencies • Frequency of data releases and lag-time • Technical skills or equipment required to obtain, interpret, and/or communicate the indicator
15
P LA N - I T H E N N E P I N
16
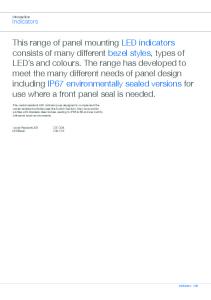
TRACK-IT HENNEPIN: RECOMMENDED ANALYSIS BOUNDARIES
Track-It Hennepin: Recommended Analysis Boundaries
55401
55402
55403
0
0.375
0.75
1.5 Miles
CPED Combined Commercial Corridors Intersecting Zip Codes Intersecting Census Zip Code Tabulation Areas
Created by Metris Arts Consulting: 8/23/12 Data Sources: ESRI, Minneapolis CPED, and MetroGIS (US Census Bureau, MN Dept. of Revenue)
• Cost • Accuracy/reliability of data sources and estimates For data analyses, our geographic boundaries are the Hennepin Cultural District (boundaries selected to coincide with two combined commercial corridor areas used by CPED research), and its “vicinity” measured by the 55401, 55402, and 55403 zip codes and Census Zip Code Tabulation Areas (see map). These selections reflect considerations of the availability and reliability of data at different geographic scales, boundary consistency, and relevance to Plan-It Hennepin’s vision. Over time, the Hennepin Cultural District Alliance may determine that some of the recommended indicators are actually unsuitable or impractical, and/or preferable alternatives may present themselves. In particular, the national indicator systems under development from ArtPlace and the National Endowment for the Arts should be closely monitored to see if they present an efficient, cost effective solution to meet or complement Track-It Hennepin’s objectives. Though a longitudinal analysis with consistent sources present benefits, stakeholders should not view Track-It indicators as set in stone, but as a work in progress that may be improved upon. DATA SOURCE AND COLLECTION ROADMAP
Akin to Plan-It Hennepin itself, the specific details of how Track-It Hennepin will be implemented moving forward are not yet fully fleshed out. As outlined below, Track-It Hennepin relies on many local entities as data collection partners. Within the Hennepin Cultural Alliance, a point-person (staff member, consultant, or even graduate-level research intern) must be identified to take ownership of the initiative each year. Although some of the data collection requires training, many of the tasks merely require attention to detail and dogged persistence (such as reminding partners to supply
B: TR AC K- I T H E N N E P I N
the data that they’ve committed to supply). The highest-level “craft” skill is the synthesis and analysis of the numbers into clear and meaningful narratives. The Wilder Foundation’s Central Corridor Tracker may provide a useful template from which to draw inspiration for Track-It Hennepin’s graphic design and organizational structure (Central Corridor Funders Collaborative 2011). The detailed notes on data sources and collection, below, aim to empower the Hennepin Cultural Alliance to advance Track-It Hennepin under a variety of resource and staffing scenarios. DECENNIAL CENSUS AND AMERICAN COMMUNITY SURVEY (U.S. CENSUS BUREAU)
The following baseline indicators stem from the 2010 Census: population, housing units, and population by race/ethnicity. Census Zip Code Tabulation Areas for 55401, 55402, and 55403 are used as an analysis boundary for the Hennepin Cultural District vicinity. American Community Survey (ACS) 5-year estimate will provide baseline data for the percentage of lowincome households and data for population, housing units, and population by race/ethnicity. ACS data for Zip Code Tabulation Areas will be newly available in December 2012 via the 20072011 ACS 5-year estimates (U.S. Census Bureau 2012a). ACS data does present some accuracy and interpretation challenges. ACS estimates are generated through an annual statistical sample, as opposed to collecting data from every resident once every ten years (as with the Census). The ACS publishes margins of error with a 90% confidence interval, a measure of the range in which the true value would fall if the entire population had supplied data. For example, an ACS estimate that 70% of the population in a given area is white with a margin of error +/-10 percentage points means that one can be 90% confident that the true measure is between 80% and 90%. By combining 60 months of data, ACS estimates are available for areas
with populations under 20,000 people. These multi-year ACS estimates are best viewed as an average of 60 months. Though available, smaller geographies are associated with wider margins of error ranges, because fewer people are sampled. Aggregating small geographies (such as the 55401, 55402, and 55403 Zip Code Tabulation Areas) does reduce the margin of error. (To calculate the margin of error for a combined area, square each individual margin of error, add all the values and take the square root of the sum.) Particularly with wide margins of error, in many instances when point estimates appear to differ, the differences are not actually statistically significant. Comparing data points generated from subsequent 5-year estimates is further complicated by the fact that the sample years will overlap. For instance, the 2007-2011 ACS 5-year estimates and the following year’s data release (2008-2012) will contain four years in common. Sample overlap and margins of error limit our ability to draw year-to-year changes from ACS data. However, the ACS data will still reveal important long-term trends. b Recommendations: This report uses Census data to populate baseline statistics because Zip Code Tabulation Area ACS data was not yet available. The Hennepin Cultural District Alliance should, however, swap these baseline values with 2007-2011 ACS 5-year estimates when it becomes available. This would avoid the potentially confusing scenario of presenting 2010 data as a baseline and a year-two value for 2007-2011, in which three of the five years actually pre-date the baseline year. Overtime, Track-It Hennepin would present the 2007-2011 ACS 5-year estimates as a baseline, 2010 Census data and/or 2008-2012 ACS 5-year estimates (for data not available through the census, such as income levels) for year two, etc. In addition, whenever ACS data is used, margins of error should always be presented, for instance in a technical appendix. b ACS 5-year estimates are available through census.gov (U.S. Census Bureau 2012b). It is not yet clear whether or not data for
17
18
P LA N - I T H E N N E P I N
Zip Code Tabulation Area will be available through the Census’ intuitive, point-andclick American Fact Finder system (U.S. Census Bureau 2012) or whether downloading the summary file will be required. If the later, the Hennepin Cultural District may need to retain a consultant or an experienced research intern (for instance an urban planning graduate student) to procure the data. NEW PERMITTED PROJECTS (CITY OF MINNEAPOLIS)
As a more accurate alternative to ACS housing unit estimates, the Track-It Hennepin staff/consultant should consider generating year-to-year changes from a 2010 Census baseline using the City of Minneapolis’ data on new permitted projects. Although this fails to capture demolitions, it should be more accurate than ACS estimates. To generate estimates, view “new permitted projects” mapped in every quarter in the Minneapolis Trends report. Through a visual scan, identify projects occurring in the Hennepin Cultural District “vicinity” boundary (55401, 55402, and 55403 Zip Code Tabulation Area). Add successive quarterly tallies to the housing unit estimate derived from the Census 2010. b Contact: Marie Cecilia Bolognesi (CPED Research),
[email protected], 612-673-2495 b URL : www.ci.minneapolis.mn.us/cped/ resources/reports/cped_trends_reports _home CULTURAL DATA PROJECT
Launched in Minnesota in June 2012, the Cultural Data Project (CDP) will supply the following indicators: attendance at cultural events, numbers and kinds of cultural events, percentage of organizations with increases in attendance, and financial performances metrics
for arts and cultural nonprofits. The webbased CDP form captures detailed financial information, populated from board-approved audits or year-end financial statements. It also includes non-financial information, including the number and types of events and attendance. Funder requirements will increasingly require that applicant organizations complete the CDP profiles. As a data source, the CDP presents advantages and limitations. Using a standardized system already advanced by area arts and cultural funders vs. an independent questionnaire will reduce organizations’ survey fatigue and administrative burdens. However, how well the CDP captures Hennepin Cultural District data, depends entirely on the degree to which district arts and cultural organizations participate. Year-to-year increases in attendance and events, for instance, may not reflect increased rates, but rather that more organizations are completing profiles. Past research efforts have found that small organizations, many of whom do not seek grant funding, are underrepresented (Markusen et al. 2011). Despite providing training resources, organizations in other communities have also been put off by the CDP, which they find too long and too skewed towards financial data. Participating organizations do, however, gain access to a suite of integrated management tools. The CDP’s benefits as a practical, rich, and detailed data source for the Hennepin Cultural District outweigh its costs. b Recommendations: Hennepin Cultural Alliance organizers should promote the CDP among district arts and cultural nonprofits, encouraging them to complete profiles for 2012 in 2013, and annually moving forward. When presenting CDP data on attendance and numbers/kinds of events, the number of organizations participating in the CDP (“N”) should be indicated, to aid in interpreting year-to-year variation. The specific metrics for the financial performance indicator(s) should be determined in consultation with knowledgeable practitioners, such as the Nonprofits Assistance Fund or Nonprofit
B: TR AC K- I T H E N N E P I N
Finance Fund. For research purposes, CDP data is released in an Excel spreadsheet. The Hennepin District Alliance Track-It point person can filter down to organizations in the district through street address/zip code verifications. b Contacts: For CDP promotion: Sarah Yusavitz,
[email protected]. For research assistance: Christoper Caltagirone,
[email protected], 215-559-8319 or
[email protected] b URL : www.mnculturaldata.org; www.culturaldata.org/research DOWNTOWN PERCEPTION SURVEY (DOWNTOWN IMPROVEMENT DISTRICT)
The Downtown Improvement District (DID) has agreed to collaborate with Track-It Hennepin by incorporating a few tailored questions into its annual Downtown Perception Survey. This survey populates the following indicators, as measured as a percentage of respondents: those that visit six or more times/ year, those whose visits includes multiple destinations at least 50% of the time, and those that rate the Hennepin Cultural District as vibrant, beautiful and inspiring, walkable, and safe. The DID targets the survey to downtown employees and safe-zone participants, with over 5,800 responses for 2012. Despite these high response rates, the DID survey is a sample of convenience, rather than a scientific sample, so is subject to more bias. However, changes in perceptions of Hennepin Avenue overtime from survey respondents should still yield valuable information. b Recommendations: The Hennepin District Alliance staff person/consultant should contact the DID annually in the summer to coordinate collaboration on its fall survey. The following questions were used for baseline data. Modifications should be made with care, to ensure consistency across years:
1. Please rate your physical experience in the Hennepin Cultural District (see map). The Hennepin Cultural District feels.... vibrant beautiful and inspiring walkable safe *six point rating scale (strongly agree, agree, neutral, disagree, strongly disagree, N/A) 2. Over the past year, what brought you to the Hennepin Cultural District? (Please select all that apply.) employment dining shopping theater museums festivals/parades movies spectator sports libraries parks worship education live in the district other (please specify) 3. In the last year, about how many times did you visit the Hennepin Cultural District? 1-5 6-15 16-25 26-50 51+ Never 4. About how many of your trips included visits to multiple destinations? (For example dinner and a show.) None 25% 50% 75% 100% N/A b Contact: Kristi Colford, KColford@ MinneapolisDID.com, 612-296-6811
19
20
P LA N - I T H E N N E P I N
MINNEAPOLIS RESIDENTS’ SURVEY (CITY OF MINNEAPOLIS CITY COORDINATOR’S OFFICE)
b Recommendation: Continue to seek this data with the goal of including 2012 baseline data in the 2013 Track-It report.
The Minneapolis Residents’ Survey offers a promising additional data source to complement the DID’s Downtown Perception Survey. In contrast to the DID’s survey, the residents’ survey employs statistical sampling techniques and is administered in multiple languages, which ensures that it is a reliable estimate of the population of city residents. Conducted every two to three years, the survey already asks city residents questions related to downtown. Given content overlap and the City’s support for Plan-It Hennepin, it may be possible to tailor a few questions for Track-It Hennepin’s needs. Gülgün Kayim (Director of Arts, Culture, and the Creative Economy for the City of Minneapolis) has offered to sponsor the proposal and seek its approval.
b Contact: Brian Funk,
[email protected], 612-349-7571
b Recommendations: Query Kayim in early 2013 as to when the next survey is planned. Use the residents’ survey to populate the same indicators as the DID survey, but with a sample that represents all Minneapolis residents. The questions designed for the DID survey may also be used for this purpose. b Contact: Gülgün Kayim,
[email protected], 612-673-2488 b URL : minneapolismn.gov/coordinator/rm/ results-oriented-minneapolis_citizensurvey METRO TRANSIT
Metro Transit captures data on bus boardings/ de-boardings, and light rail boardings, and has expressed a willingness to share these statistics for transit stops within the Hennepin Cultural District boundary. Unfortunately, however, Metro Transit was unable to supply 2011 baseline data in time for this publication.
PEDESTRIAN COUNTS (PEDESTRIAN STUDIES)
Out of budgetary considerations, commissioned pedestrian count studies do not comprise one of Track-It Hennepin’s annual indicators. However, on a periodic basis, pedestrian count studies may inform strategy and enhance the suite of Track-It indicators. b Contact: Peter Bruce (Pedestrian Studies),
[email protected], 612-275-5541 b URL : www.pedestrianstudies.com CRIME STATISTICS (MINNEAPOLIS POLICE DEPARTMENT)
The Minneapolis Police Department (MPD) has agreed to provide the following crime-related indicators for Track-It Hennepin: robberies/ year, thefts from motor vehicles/year, and crime in hotspots. Baseline data has been provided for 2011 and will be updated annually moving forward for the Hennepin Cultural District boundary. The MPD recommends robberies and thefts from motor vehicles as particularly appropriate “proxy” crime stats, since changes in crime rates are less likely to be driven by changes in enforcement strategy (unlike livability crimes). Annual crime hot spot maps allow Hennepin Cultural District Alliance to prioritize geographic nodes plagued with crime for design and programmatic interventions. The MPD has also expressed strong interest in providing a walking tour with Hennepin Cultural District stakeholders to discuss crime prevention strategies.
B: TR AC K- I T H E N N E P I N
b Contact: Sgt. Jeff Egge (Supervisor of Crime Analysis Unit),
[email protected], 612-673-2470 PERMITS FOR SIDEWALK CAFÉS (CITY OF MINNEAPOLIS BUSINESS LICENSING)
Minneapolis’ business licensing department provides Track-It Hennepin’s indicator for sidewalk café permits. The permits renew annually in April. The Hennepin District Alliance Track-It point person will receive data for Ward 7 in a spreadsheet and must filter down to organizations in the district through street address verifications. b Contact: Linda Roberts:
[email protected], 612.673.3908, 612.685.8546 PERMITS FOR FESTIVALS/PARADES (CITY OF MINNEAPOLIS PUBLIC WORKS)
Minneapolis’ public works department provides the festival/parade permit indicator. Data is available annually. Baseline data omits events that races and parades that only cross the district. This convention should be carried forward for consistency. b Contact: Dee Ann McQuery:
[email protected], 612-673-2221, 612-673-2886; Alternate resource person: Phil Schliesman:
[email protected], 612-685-8538 COMMERCIAL CORRIDOR ANALYSES (CPED RESEARCH)
Track-It Hennepin relies on CPED Research’s commercial corridor analyses to derive the following indicators: real estate estimated market value (commercial/industrial), local option
sales tax, and number of businesses establishments. Track-It Hennepin aggregates this data from the reports that CPED generates for two commercial corridors: Hennepin Avenue (Downtown), and Lyndale Avenue (Loring Park), which together comprise the Hennepin Cultural District boundary. The data releases do involve lag time. For its baseline, Track-It Hennepin uses the most recent available data (2011 for estimated market value, 2010 for all others). Data will be updated annually, with 2011 data expected within the coming months. The commercial corridor analyses synthesize three data sources: local option sales tax data provided under a data sharing agreement with MN Department of Revenue, and parcel‐level property value data from the City Assessor, and jobs and establishments micro‐data provided under a data sharing agreement with MN DEED. MN DEED’s source data, the Quarterly Census of Employment and Wages (QCEW), does omit self-employed persons, government workers, and railroad workers, and incorporate some data suppression, but Track-It Hennepin is still quite fortunate to have free access to this fine-grained and overall reliable data. CPED Research has also agreed to tally “creative” industry jobs and business establishments within the Hennepin Cultural District Boundary. Track-It Hennepin will use 2010, the most recent available, as its baseline year. CPED Research has adopted the New England Foundation for the Arts’ definition of creative industries (DeNatale, Wassall, and New England Foundation for the Arts 2007, 45–47). A detailed list of included NAICS categories is available upon request. Comparative data for the city overall will be presented for both the standard commercial corridor and custom creative industry analyses. b Contacts: Marie Cecilia Bolognesi,
[email protected], 612-673-2495; Jeff Schneider,
[email protected], 612-673-5124 (CPED Research)
21
22
P LA N - I T H E N N E P I N
CULTURAL VITALITY INDEX (WESTAF)
Track-It Hennepin uses components of the WESTAF’s cultural vitality index (CVI) to obtain data for two indicators: the number of creative occupation jobs, and annual revenues in select creative industries. Because the City of Minneapolis City Coordinator’s office has recently begun using WESTAF’s Creative Vitality Index (CVI) data to better understand the characteristics of its cultural and creative economy; Track-It Hennepin is able to gain free access to this data source. For both indicators, Hennepin Cultural District “vicinity” estimates are made for the 55401, 55402, and 55403 zip codes. It is important to note that City-level data is also generated through an aggregation of zip codes and therefore varies from Minneapolis’ political boundary. The baseline data year is 2011, the most recent available. WESTAF and its underlying Economic Modeling Specialists Intl. (EMSI) data offer a unique data product. As a private company, the data suppression/confidentiality laws to which government agencies must adhere do not bind EMSI. EMSI develops its labor market data by integrating over 90 different primary data sources (Economic Modeling Specialists Int. 2012). For instance, by combining the QCEW with tax return data, EMSI rectifies the QCEW’s omission of sole proprietors. However, EMSI is also continually refining its methodology and integrating new data sources. Although EMSI retroactively applies data releases, WESTAF does not modify previously published CVI data. This may ultimately mean that CVI data is inappropriate for longitudinal analyses. Despite these issues, the CVI data provides indicators, not supplied through alternate sources, to measure progress towards reaching creative sector positive economic momentum. For instance, EMSI is the only source identified that provides detailed occupational data estimates at small geographies. Unlike the creative industry jobs indicator generated
through CPED’s QCEW data, occupational data speaks to what workers do, not just the sector in which they work. An accountant working for the Walker Art Center would be included in CPED’s QCEW data, whereas a freelance graphic designer (or one working for a trucking company) would be picked up by EMSI. Though derived from county-level industry data and regional staffing patterns, EMSI qualifies zip codes estimates as accurate for areas of populated concentration, such as Minneapolis (Gabe Rench, EMSI, personal communication September 12, 2012). To comprise its “creative” occupations, the CVI measures 36 occupational categories that have been defined by the Employment and Training Administration’s “O*NET” occupational network database as measuring very high in creative thinking, originality, and fine-arts knowledge. A detailed list of occupational categories is available at cvi. westaf.org/content/creative-occupations. CVI data also yields aggregate revenue data for 10 “creative” industry categories, which WESTAF felt best reflected creative goods and services. This data integrates revenues for both for profit and nonprofit businesses in the following industry categories: Camera and Photographic Supplies Stores Musical Instrument and Supplies Stores Book Stores and News Dealers Prerecorded Tape, Compact Disc, and Record Stores Art Dealers Theater Companies and Dinner Theaters Dance Companies Musical Groups and Artists Other Performing Arts Companies Independent Artists, Writers, and Performers b Recommendation: Continue to gather CVI/ ESMI data for Track-It Hennepin on a trial basis. Look closely for any large data swings from year to year, and investigate with WESTAF, if encountered. Data access must be facilitated through the City of Minneapolis (as WESTAF’s primary client). Minneapolis level statistics are available through the CVI
B: TR AC K- I T H E N N E P I N
website. WESTAF staff will directly supply industry sales and occupational data for the 55401, 55402, and 55403 zip codes. b Contacts: Gülgün Kayim (Director of Arts, Culture, and the Creative Economy for the City of Minneapolis),
[email protected], 612-673-2488; Bryce Merrill (WESTAF)
[email protected], 303-629-1166 b URL : cvi.westaf.org SELF-COLLECTED ORGANIZATIONAL SURVEY (HENNEPIN CULTURAL DISTRICT ALLIANCE)
Track-It Hennepin also incorporates some original data collection by the Hennepin Cultural District Alliance from district arts and cultural organizations. A survey to organizations will supply the following indicators (as measured by percentage of organizations): organizations that 1) feel that they are serving the needs of different demographic groups (people of color, low income people, children/families, etc.); 2) link district activity with boosts to their visibility, patronage, collaborations/partnerships, and increased capacity; 3) link Hennepin Cultural District activities to a climate in which some organizations are at risk of dislocation due to rising rent/space costs, and 4) feel that the benefits of Hennepin Cultural District to cultural organizations activities outweigh any costs to them. b Recommendations: To minimize administrative burdens and survey fatigue, the Hennepin Cultural Alliance may opt to survey organizations every other year instead of annually. Interviews may be considered in addition to the survey, to obtain more detailed information. See below for suggested survey language: 1. Please rate your agreement with the follow statement. Through its public events or programs, my organization adequately serves the
interests of the following demographic groups: • People of color [consider listing specific racial/ethnic groups] • Low-income people • Children/families • Teens/young adults • Elderly people • Disabled individuals • Lesbian, gay, bisexual, and transgender populations *six point rating scale (strongly agree, agree, neutral, disagree, strongly disagree, N/A) 2. Please rate the following ways in which the Hennepin Cultural District may have benefited your organization. Hennepin Cultural District activities have helped… • boost my organization’s visibility/exposure • increase my organization’s patronage • foster collaborations/partnerships for my organization • expand my organization’s capacity through new relationships *six point rating scale (strongly agree, agree, neutral, disagree, strongly disagree, N/A) 3. Please rate the following ways in which the Hennepin Cultural District may have adversely affected your organization. Hennepin Cultural District activities have… • contributed to increases in my organization’s rent • placed new administrative or programmatic burdens on my organization without adequate support *six point rating scale (strongly agree, agree, neutral, disagree, strongly disagree, N/A) 4. Please rate your sense of the overall benefits/ costs of Hennepin Cultural District activity on ALL affected organizations a. Hennepin Cultural District activities have contributed to a climate in which some organizations are at risk of dislocation due to rising rent/space costs b. Overall, the benefits of Hennepin Cultural District activities to cultural organizations outweigh any costs to them
23
24
P LA N - I T H E N N E P I N
*six point rating scale (strongly agree, agree, neutral, disagree, strongly disagree, N/A) 5. Please feel free to add any additional comments about your satisfaction with Hennepin Cultural District activities thus far, including opportunities for improvement. SELF-COLLECTED ADMINISTRATIVE DATA (HENNEPIN CULTURAL DISTRICT ALLIANCE)
Two Track-It Hennepin indicators are best obtained through administrative reporting by the organizers of district activities. These individuals should note new, paid opportunities for artists and arts organizations, i.e. public art commissions, and/or coordinating pop-up programs or tours. In addition the organizers of district activities should also track new, direct support for artist housing and creative/cultural enterprises. These types of accomplishments can be made more visible by integrating documentation into Track-It Hennepin.
REFERENCES ArtPlace. 2012. “Understanding Creative Placemaking.” ArtPlace. http://www.artplaceamerica.org/articles/ understanding-creative-placemaking/. ———. 2012. “Vibrancy Indicators.” ArtPlace. Accessed November 25. http://www.artplaceamerica.org/vibrancy-indicators/. Central Corridor Funders Collaborative. 2011. “Tracking Outcomes In The Corridor.” Central Corridor Funders Collaborative: Investing Beyond the Rail. http://www.funderscollaborative.org/tracker. DeNatale, Douglas, Gregory Wassall, and New England Foundation for the Arts. 2007. The Creative Economy: A New Definition. Boston, MA: New England Foundation for the Arts. http://www.nefa.org/sites/default/ files/ResearchCreativeEconReport2007.pdf. Economic Modeling Specialists Int. 2012. “More Than 90 Federal, State, and Private Sources.” Emsi. Accessed November 26. http://www.economicmodeling.com/data/emsi-data-sources/. Gadwa Nicodemus, Anne. 2012. “Creative Placemaking 2.0.” GIAreader. Greater Portland Pulse. 2011. “Greater Portland Pulse.” Greater Portland Pulse. http://portlandpulse.org/. Guernsey, Elizabeth, and Kathryn Pettit. 2007. “NNIP Data Inventory 2007: A Picture of Local Data Collection Across the Country”. National Neighborhood Indicators Partnership: Urban Institute. http://www. urban.org/url.cfm?ID=412350. Jackson, Maria Rosario, and Joaquin Herranz. 2002. “Culture Counts In Communities: A Framework for Measurement”. The Urban Institute. http://www.urban.org/url.cfm?ID=310834. Jackson, Maria Rosario, Florence Kabwasa-Green, and Joaquin Herranz. 2006. “Cultural Vitality in Communities: Interpretation and Indicators”. Urban Institute. http://www.urban.org/url.cfm?ID=311392. Kingsley, G. Thomas. 1999. Building and Operating Neighborhood Indicator Systems: A Guide Book. National Neighborhood Indicators Partnership: Urban Institute. http://www.urban.org/url.cfm?ID=409297. Markusen, Ann. 2012. “Fuzzy Concepts, Proxy Data: Why Indicators Won’t Track Creative Placemaking Success”. Blog. Createquity. http://createquity.com/2012/11/fuzzy-concepts-proxy-data-why-indicators-wonttrack-creative-placemaking-success.html. Markusen, Ann, Anne Gadwa, Elisa Barbour, and William Beyers. 2011. California’s Arts and Cultural Ecology: Technical Appendix. James Irvine Foundation. http://irvine.org/images/stories/pdf/news/CA_Arts_ Ecology_TApp_2011Sept20.pdf. Metropolitan Philadelphia Indicators Project. 2006. “Where We Stand: Community Indicators for Metropolitan Philadelphia”. Metropolitan Philadelphia Indicators Project. http://mpip.temple.edu/ mpip/2006ReportPDF/2006_MPIP_Annual.pdf. Moss, Ian David. 2012. “Creative Placemaking Has an Outcomes Problem”. Blog. Createquity. http://createquity.com/2012/05/creative-placemaking-has-an-outcomes-problem.html. National Endowment for the Arts. 2012. “Webinar: Our Town Community Indicators Study.” National Endowment for the Arts: Research. http:// www.nea.gov/research/OTIndicators/index.html. Phillips, Rhonda. 2003. Community Indicators. Planning Advisory Service. Chicago, IL: American Planning Association. www.planning.org/pas/ reports/subscribers/pdf/PAS517.pdf. The Chicago Community Trust, and Chicago Metropolitan Agency for Planning. 2012. “MetroPulse: The Regional Indicators Project for Metropolitan Chicago.” Accessed January 12. http://www.metropulsechicago.org/#. U.S. Census Bureau. 2012a. “American Community Survey: Geography--2011 Highlights.” U.S. Census Bureau. http://www.census. gov/acs/www/data_documentation/geography/. ———. 2012b. “American Community Survey: Data & Documentation-Summary File.” U.S. Census Bureau. http://www.census.gov/acs/www/ data_documentation/summary_file/. ———. 2012. “American FactFinder.” U.S. Census Bureau. Accessed November 26. http://factfinder2.census.gov/faces/nav/jsf/pages/ searchresults.xhtml?refresh=t.