Foreign Firms and Productivity in Developing Countries∗
Andreas Waldkirch† March 2014
Abstract This paper assesses the performance of domestically and foreign-owned firms in a large sample of developing and transition countries. The detailed data allow a characterization of productivity and foreign firm presence across 118 countries, thus moving significantly beyond single country studies. A robust result is that foreign firms are more productive than domestic private firms, regardless of specification and accounting for unobservable heterogeneity across several dimensions. Accounting for observable firm level determinants of productivity, such as skilled labor, reduces the size of, but does not eliminate the statistically significant productivity advantage. However, it proves crucial to eliminate outlying observations through a careful econometric procedure since this removes a positive correlation between foreign firm presence in a sector and productivity. There are even some indications of a negative correlation. Keywords: Foreign Ownership, Productivity, Spillovers. JEL Classification: F21, F23, O12.
∗
Thanks to Hadrien Vasdeboncoeur, Mariel Lambrukos and Erik Solli for excellent research assistance. Department of Economics, Colby College, 5244 Mayflower Hill Drive, Waterville, ME 04901, USA. E-mail:
[email protected]. Thanks to very useful comments on an earlier version from participants and the discussant at the Robert E. Lipsey Memorial Sessions of the Western Economic Association Meetings 2013. †
1
Introduction
In recent years, many countries, particularly in the developing world, have sought to attract foreign investment, especially in the form of foreign direct investment (FDI). The touted benefits of increased foreign participation in the economy include the capital brought in, employment opportunities and spillovers, technological and otherwise, which contribute to enhanced economic growth (Blomström and Sjöholm, 1999; Borensztein, De Gregorio and Lee, 1998; De Mello, 1999, Cipollina et al., 2012). It also appears that foreign owned firms have weathered the recent global financial crisis better than local firms (Alfaro and Chen, 2012). For the lowest income developing countries, the manufacturing sector in particular is considered a driving force for modernization and job creation. On the other hand, sceptics point to potential negative competition effects and that spillovers may not materialize when absorptive capacity is low. Indeed, some studies such as Oteng-Abayie and Frimpong (2006) find that FDI may have a negative impact on GDP growth. One strand of the literature exploring whether foreign investment results in beneficial effects focuses on macroeconomic factors and conducts cross-country analyses using aggregate data. Another strand focuses on productivity (and sometimes wage) impacts at the microeconomic, industry or firm level. While the former is of interest since it is correlated with aggregate welfare, the latter is of interest since under fairly general conditions, increases in micro productivity feed into aggregate productivity (Syverson, 2011). There are many studies of the productivity and wage differences between domestically and foreign-owned firms and spillover effects in various countries. There are some countries with rich firm-level data that have been explored extensively, e.g. Mexico (Blomström, 1986; Blomström and Wolff, 1994, Jordaan, 2005 and 2008), Venezuela (Aitken and Harrison, 1999), Colombia (Kugler, 2006), Morocco (Haddad and Harrison, 1993), Lithuania (Javorcik, 2004), Ghana (Görg and Strobl, 2005; Waldkirch and Ofosu, 2010), Indonesia (Arnold and Javorcik, 2009), or China (Liu, 2008; Xu and Sheng, 2012). Virtually all of these studies, however, focus on one country only, raising questions as to how applicable experiences in that country are to others. They also cover very different time periods, going as far back as 1970 (in the case of the earliest Mexican study), the 1980s (Venezuela) and the 1990s (Ghana). Moreover, some are based on Census information, whereas other data come from surveys, with no 1
coordination in survey design. All these factors makes it very difficult to assess what may be common across a large swath of countries and to base policy recommendations for any other country on these results. In contrast, the World Bank has since 2002 conducted the Enterprise Surveys which follow the same research design and use the same questionnaire for many countries, thus making the data far more comparable across countries. They also cover roughly the same time period, mostly the latter half of the 2000s. The data have been exploited by a number of researchers for various questions, but to the best of our knowledge, they have hardly been utilized to comprehensively look at productivity of domestic versus foreign-owned enterprises and the impact of foreign presence in an industry across such a large swath of countries in comparable fashion. This paper represents a thorough attempt at shedding light on the question whether results obtained in specific contexts, largely that foreign firms are far more productive than domestically owned firms but that evidence of positive spillovers are difficult to find, are systematically true across a wide array of developing countries. What is remarkable about the Enterprise Surveys is the large number of countries that have been surveyed. There are potentially 137 countries in the data, although some countries are dropped from the formal analysis. For example, non-developing countries that have been surveyed such as Germany or Ireland are omitted. A few countries are omitted because they do not have comparable data due to the use of a different survey design, such as Bangladesh and an early survey of China. We also exclude surveys that focus specifically on services sectors (such as retail and IT) or survey only micro enterprises. Still, that leaves 119 countries with nearly 40,000 observations. Saliola and Seker (2011) use the Enterprise Survey data and compute total factor productivity for manufacturing firms in 81 countries from surveys conducted between 2005 and 2009. They compute aggregate and average productivity and rank countries according to these, pointing out sometimes large differences in rankings depending on which measure of productivity they look at. They also compare productivity across sectors and within regions. They do not consider domestically versus foreign-owned firms and conduct no regression analysis. The paper closest to this one is Farole and Winkler (2012). They use the Enterprise
2
Survey data in order to look at intra-industry spillovers from foreign to domestic firms. Their focus is on “mediating factors”, essentially factors that help determine whether spillovers occur or not. These may be characteristics of the foreign firms, of the domestic firms, of the sector a firm is operating in, or country characteristics. They find that foreign firm spillover potential, domestic firm absorptive capacity and the host country’s institutional framework all affect the extent and direction of spillovers. In addition, this impact depends on the level of the domestic firm’s productivity and whether foreign firms are partially or wholly foreign owned. They do not use the most recent survey data and also use at most one survey per country, leaving them with far fewer observations and less country coverage than this paper. They also do not address the important issue of outliers. An important contribution of this paper is to show how outliers in the data can (and in this case do) lead to spurious correlations. Specifically, following Verardi and Wagner (2012), we use an econometric procedure to identify outliers in the x-, the y- and both dimensions simultaneously. After removing them from the sample, any positive correlation between productivity and foreign presence at the firm level vanishes. Similarly, Verardi and Wagner (2012) find that estimated export premia for German firms become statistically insignificant. In our estimation, some significant correlations, with one exception negative, remain for some productivity measures and for subsets of the data, for example Latin American countries. One of the downsides of the Enterprise Data is its largely cross-sectional nature. There are some firms in some countries that have been surveyed more than once, but the resulting panel is small and non-representative. Thus, we are unable to address issues of self-selection or unobserved heterogeneity at the establishment level via the use of establishment fixed effects. This means that we are documenting observed correlations and make no claim of causation. We are able, however, to account for unobserved heterogeneity in many other dimensions, the year, the industry and regions within countries. The paper proceeds as follows. The next section contains a brief review of productivity studies conducted for single countries. This is followed by a detailed description of the Enterprise data. Theoretical considerations precede and inform the empirical implementation. A thorough discussion of the empirical results follows. The final section concludes.
3
2
A Brief Review of the Literature
A detailed discussion of the very large empirical literature on foreign firm presence and foreign direct investment’s impact on productivity is well beyond the scope of this paper. Surveys of the literature find that the evidence for spillovers or more generally positive effects of foreign ownership on productivity of domestic and/or foreign firms is mixed. This is largely because most studies that use micro, firm-level data focus on one country and results are difficult to compare and it is hard to argue that they apply in different contexts. Cross-country studies, in contrast, suffer from a lack of micro data and therefore provide aggregate or at best industry-level analysis. The availability of the detailed micro data from the Enterprise Surveys allows the present paper to remedy these shortcomings in important respects. Lipsey (2004) contends that while the evidence is strong that foreign firms are more productive and pay higher wages, their effect on domestic firms is much less clear. In their extensive survey of the literature, Görg and Greenaway (2004) find that the evidence on productivity and spillovers is mixed and depends largely on the study methodology and data used. Wooster and Diebel’s (2010) meta analysis of developing country studies finds that those using firm-level data are particularly prone to finding insignificant or even negative spillover effects from the presence of foreign-owned firms. In addition, Görg and Strobl’s (2001) meta-analysis finds evidence of publication bias, which suggests that the evidence is even more mixed than a review of published studies indicates. An example of a recent cross-country industry study is Fillat and Woerz (2011) who investigate the relationship between FDI and productivity growth for a sample of both developed and developing countries. Their industry data come from a variety of sources, such as the OECD’s International Direct Investment database and UNIDO’s Industrial Statistics database for eight industries, 28-35 countries for the 1987-2000 time period, which results in a highly unbalanced panel. They find some positive relationships between FDI and productivity for some industries when certain preconditions are met, such as high investment and export orientation. The remainder of this subsection discusses firm-level, single country studies, highlighting some of the differences in their findings and their shortcomings, beyond being focused on 4
one country only. In their seminal contribution, Aitken and Harrison (1999) find only a small effect of foreign ownership on domestic firm productivity, and only for the smallest firms. They also compute the aggregate effect of foreign presence in Venezuela and find it to be a tiny fraction of usual annual GDP growth. In many contexts it is found that Africa and in particular sub-Saharan African countries differ from the experiences elsewhere (e.g. Asiedu (2002) with respect to FDI determinants). For Morocco, Haddad and Harrison (1993) find smaller productivity dispersion in industries where foreign firms are concentrated, but do not find evidence that foreign firms accelerated productivity growth in domestic firms. For Ghana, Waldkirch and Ofosu (2010) find a positive impact of foreign presence on productivity, although that does not appear to translate to wages. Görg and Strobl (2005) use an interesting feature of the Ghanaian data to examine the effect that previous experience of the manager working for a foreign firm has had on productivity. They find a positive effect, but only if the work experience had been in the same sector. For Mexico, Blomström (1986) and Blomström and Wolff (1994) present the earliest evidence of a positive correlation between foreign ownership and productivity, using the 1970 and 1975 Industrial Censuses. More recently, Jordaan (2005 and 2008) uses the 1993 Industrial Census to find that foreign ownership has a positive effect on labor productivity, especially in high absorptive capacity industries in which foreign ownership is concentrated. For Indonesia, Blalock and Gertler (2009) find that the entry of foreign firms raises productivity of domestic firms with a larger technology gap, but less for firms that have little room to catch up. Arnold and Javorcik (2009) find that newly acquired and privatized firms with foreign owners exhibit greater productivity growth than a control group of domestic firms even several years after takeover. They point to substantial restructuring at the firm level following acquisition which raises investment, employment, and wages. While most of the literature discussed so far is concerned with intra-industry productivity effects and spillovers, recent contributions by Javorcik (2004, for Lithuania) and Kugler (2006, for Colombia) examine the possibility of inter-industry spillovers. This is in part a response to the relative lack of finding intra-industry spillovers, but also in recognition of the substantial forward and backward linkages that MNEs often develop in the countries
5
that they are engaged in. Both Javorcik and Kugler confirm the lack of productivity effects within the same industry, but find evidence of considerable spillovers to local suppliers (backward linkages). There is a fairly large segment of this literature devoted to China. Recently, Liu (2008) looks at both productivity levels and productivity growth as a result of foreign presence in a sector and finds a negative (short-run) effect from the former, presumably due to investments necessary to benefit from the foreign technology, and a positive (long-run) effect for the latter, presumably as the new technology becomes integrated in the production process. Xu and Sheng (2012) examine spillover effects of FDI on domestic Chinese firms 2000-2003, taking into account several econometric challenges such as endogeneity of input choice and simultaneity bias and find that domestic firms differ significantly in the extent to which they benefit from FDI. In contrast to Jarvorcik and Kugler, they find evidence that the spillovers arise from forward linkages as firms buy higher quality intermediate inputs or equipment from upstream foreign firms. While the use of the Enterprise Survey data to examine the linkage between foreign ownership, foreign sector presence and productivity is rare, the data have been used extensively to examine other questions. For example, Eifert, Gelb and Ramachandran (2008) use the early years of the surveys to analyze the relatively poorer performance of sub-Saharan African firms and blame it mostly on the high cost of indirect inputs. Diarra and Marchand (2011) show that when corruption is an important constraint on a firm’s business, the firm’s willingness to comply with regulations falls and their probability to bribe officials increases. Clarke, Li and Xu (2013) examine the determinants of job growth in developing countries. They focus on firm characteristics such as size and age, various aspects of the business environment as well as agglomeration. The latter matters more than the former, although they find significant heterogeneity across firms. Farole and Winkler (2014) examine the determinants of export status across countries, taking into account firm level characteristics as well as agglomeration indicators. Firm determinants are key in non-core whereas the agglomeration indicators matter more in core regions.
6
3
The Enterprise Survey Data
The World Bank has conducted surveys of individual establishments annually since 2002 and adds new data every year. Some of the surveys are focused on specific questions, such as the effects of the recent financial crisis or focus on micro enterprises only. Most, however, are designed to have representative samples or add sampling weights so the researcher is able to make inferences about the population. The questionnaires for many of these surveys have been standardized at least since 2005 which make the data comparable across countries. The main purpose of the surveys from the beginning was to gain a better understanding of the operations of firms in developing countries, especially the very poorest ones, and the obstacles that they are facing. For many countries, this had simply been unknown. Many of the questions thus ask about problems encountered in the operation of the business. These include limited or interrupted access to electricity, water and telecommunications. They also ask about the (un-)availability of credit and relationships with government agencies and officials, such as whether a bribe must be paid to obtain certain licenses and how long it takes to export goods. The questionnaires also ask about establishment characteristics that are useful to investigate other questions that have not been analyzed thoroughly for developing country firms, especially in a cross-country rather than a single country context. For the purpose of the present paper, the focus is on firm variables that allow computing measures of productivity. It is also known whether an establishment is domestically or foreign owned, which allows for comparisons between domestic and foreign-owned firms’ performance and the interaction of the two.1 Many of the surveys were conducted in developing countries that have not historically been looked at and especially where detailed firm-level data have hitherto been unavailable. As mentioned earlier, any developed country that happened to be surveyed is omitted, as well as some countries with non-comparable data, micro enterprise surveys and surveys focusing specifically on services sectors such as retail and IT. We are left with 118 countries (listed in Appendix Table A1) and at most 37,542 observations in the broadest sample. 1
See the Enterprise Surveys web site at enterprisesurveys.org for more information. The data are available for free download to registered researchers.
7
Table 1: Basic Data Description (37,542 Observations)
11
Broad Sample 118 2,600
0.33
18.98
79.5
-1.82 26.85
2,016 1,266 3.70 78.49
46.83 210.46
1 1 1 1 0
13 12 30 104 0
617 224 64,000 21,955 100
Number of Countries Observations per Country min./max Size weighted Foreign Ownership Share Min/Median/Max Mean per capita Income ($) Median per capita Income ($) FDI/GDP Share Min/Median/Max Trade Openness Min/Median/Max Firm Age Min/Median/Max Foreign Firm Age Min/Median/Max Size (Employees) Min/Median/Max Foreign Size Min/Median/Max Share of Sales Exported Min/Median/Max
The country coverage across different continents is quite impressive. There are 17 Latin American countries, 13 Caribbean ones, 5 from the Middle East, 12 from Asia, 42 from Africa, 4 Pacific Islands and 25 from transition countries, largely Eastern Europe and the former Soviet Union. Table 1 presents some basic description of the data. Due to large differences in country size, the number of observations per country varies a lot, from a low of 11 for Vanuatu to a high of 2,600 in Nigeria.2 Most countries have a considerable amount of foreign firms operating in their economies. The weighted foreign ownership share in an economy ranges from 0.33 percent in Yemen to 79.5 in Cambodia. The median of 19 is reasonable and the standard deviation of 16 shows that there is significant variation in the sector share of foreign ownership within and across countries. There are no high income countries in the sample and, as mentioned, the World Bank made a particular effort to survey the very lowest income countries, many in Africa, and countries for which there had been no prior firm level data. Consequently, the mean and median per capita incomes are very low in this sample. The FDI/GDP ratio also shows a lot of variation, but is notably different from the weighted foreign ownership share from the 2
Omitting the smallest countries with few firms included will not change the results. Note that significantly more firms were surveyed in these countries but omitting services firms and missing answers reduce the sample size.
8
survey. In part this is because FDI as it is calculated in national income accounts is not necessarily a good representation of the actual degree of foreign firm activity in a country. Trade openness is quite high, as is common for small countries, which many are. While descriptive statistics for the variables included in the regression are described below for the firms in the sample, Table 1 contains a few firm characteristics that are informative of the types of firms we see in developing and transition countries. Many are rather young, as the median age is 13 for the overall sample and 12 for the foreign firms. As a result, productivity is expected to be on the lower end, as age has been shown to be positively correlated with productivity, as less productive firms are more likely to exit (Bernard and Jensen, 2007). Similarly, size and productivity are generally positively correlated. The median firm only has 30 employees, although that is clearly driven by domestically owned firms as foreign ones have a median of 104 employees.3 We now turn to a brief discussion of why and how foreign firm presence could affect productivity before discussing the empirical strategy.
4
Foreign Ownership and Productivity: Theory
The presence of foreign firms in a market affects productivity for several reasons. Since foreign owners are inherently disadvantaged relative to domestically owned firms with superior knowledge of local markets and practices, they must possess firm-specific advantages in the form of proprietary assets, technology or management and marketing practices (what Markusen (2002) terms ‘knowledge capital’). These imply higher productivity of foreignowned firms themselves. Moreover, there may be benefits to local firms stemming from productivity spillovers. Productivity spillovers generally take place when the entry or presence of multinational firms leads to efficiency or productivity benefits for local firms that are not fully internalized by the foreign firm (Blomström and Kokko, 1998). For example, host country workers that they hire and train may leave and join or set up local firms. Marketing practices may be observed and imitated. Multinationals have an interest in containing spillovers since these tend to reduce their advantage and thus their profits, but are 3
Size is proxied by employment here. Output could also be used and is available, but employment numbers make the point that many of these firms are small more clearly.
9
not entirely able to do so. The entry of multinational firms into a market may also affect productivity by disturbing the existing market equilibrium. Entry may erode the market power of existing indigenous firms, reducing measured productivity, which reflects market power as well as technical efficiency (Bernard et al., 2003). On the other hand, MNEs have an incentive to raise the quality of their local input suppliers, which also benefits local firms that buy from them, thus raising their productivity (Crespo and Fontoura, 2007). Thus, the effect of foreign firm presence on domestic firms’ productivity is ambiguous. The overall impact is determined by the combination of foreign superiority, spillovers and competition effects in output and input markets. A number of characteristics of foreign and domestic firms as well as their sectors and the countries they operate in help determine the possible scope of foreign productivity advantages and spillovers. Labor-intensive, low-technology industries such as textiles and apparel or food processing may receive investment in order to exploit labor cost advantages, but rely on well-known technologies and require little skill, limiting the scope of spillovers. This can be controlled for with industry specific fixed effects as they are likely to be similar across countries. Regions in which foreign firm activity is more concentrated could be affected differently than those with relatively fewer multinationals. Few multinationals limit the potential for spillovers, but also reduce the potential negative competition effect. While one could thus include the total number (or the total output) of foreign firms in a region, it is likely that there are many other unobserved characteristics of a region, such as location relative to transportation centers, terrain, weather patterns and more. The regressions below thus include region (within a country) fixed effects in order to account for the fixed region specific characteristics. Note that these are a sub-category of countries and thus subsume country specific effects, such as institutional quality, the rule of law or the degree of democratization. We now turn to discussing the basic empirical specification based on the previous discussion. An extended specification includes a plethora of other firm level determinants of productivity in order to ascertain whether foreign ownership may proxy for other characteristics that differ between foreign and domestic firms and are productivity enhancing. These
10
will be discussed in detail in the Results section before they are included in the analysis.
5
Empirical Specification
Fundamentally, productivity is taken to be influenced by the foreign ownership presence in the firm as well as the share of foreign ownership at the sector level and idiosyncrasies related to time, location, and industry, as discussed above: Prod it = β 0 + β 1 F P _firmit + β 2 F P _sector jt + λt + θl + +µj + εit
(1)
where F P _firmit is the foreign ownership share of firm i as given in the surveys. In accordance with generally used ways to define foreign direct investment in national income accounts, a firm with a foreign ownership share of greater than 10 percent is considered foreign.4 FP_sector is defined as foreign ownership shares averaged over all firms in a sector in a given country, weighted by each firm’s size {F P _firmijt · sizeijt } F P _sector jt =
i
sizeijt
(2)
i
Here, size is measured by employment. A positive coefficient β 1 would indicate a positive effect from foreign ownership at the firm level and β 2 > 0 would indicate the existence of a positive effect from the presence of foreign firms in the same sector. In order to disentangle the influence of this presence on foreign versus domestic firms, we also run many of the regressions on a sample of domestically owned firms only. Since the surveys were conducted in different years, all regressions include a time fixed effect λt . The countries in this sample are very diverse and while one could control for country characteristics, these are not the focus of the analysis. Thus, a location fixed effect, θl , accounts for unobserved heterogeneity in this dimension. Many countries are large and samples are usually stratified by regions within countries. Thus, this location fixed effect is at the region-within-country level, in accordance with the sample stratification. This 4
Results are also robust to using a 20 or 50 percent threshold as well as to defining an ownership dummy =1 for any establishment with foreign ownership. The latter means that firms with, say, 60 percent foreign ownership are treated the same as those with, say, 90 percent.
11
constitutes the very basic specification. It is, however, also easily conceivable that certain industries suffer from shocks that are common across some or many countries, which is then accounted for by a sector fixed effect, µj . Accounting for time, location, and industry fixed factors separately is common in the literature and preserves a sufficient amount of degrees of freedom, although it should be noted that, for example, there are over 600 locations defined in the sample. It is conceivable that there is unobserved heterogeneity along two dimensions instead. For example, there may be an idiosyncratic shock that affects only an industry in a particular location, which affects all firms in that industry. In order to account for this, a location-sector fixed effect, ηlj , must be included. One check of the robustness of the results below considers several fixed effects along more than one dimension. Doing this is constrained by the quick increase in the number of fixed effects to be considered. In the just discussed case, over 30 sectors and over 600 locations result in nearly 2000 fixed effects. This increases the likelihood of (near) singular matrices in the computation of the standard errors and thus them being invalid. It is also worth noting that while samples are stratified by region and industry in a country, this does not mean that they are simultaneously stratified along those dimensions, only separately. While this naturally lowers the number of fixed effects to be considered in the first place, it also means that identification of an effect of foreign ownership separately from the fixed effect becomes exceedingly difficult. The outcome variable of interest is productivity. Unfortunately, the nature of the surveys and the information available put a significant constraint on how to compute the dependent variable. The use of sophisticated methods to conduct total factor productivity (TFP), e.g. Olley and Pakes (1996), Levinsohn and Petrin (2003) or Ackerberg et al. (2006) requires time series information, which is available in a very limited fashion, as discussed above, and thus renders using these methods infeasible. Thus, simpler definitions must be used. Most results are shown using a simple measure of labor productivity, output per worker (in logs). Since there is information on inputs other than labor, such as intermediate inputs, a measure of value added per worker can also be constructed. Finally, we use a simpler way of calculating TFP as well, discussed in more detail below. Note that there are more missing values for the various input measures than for output or employment, so the sample size
12
becomes smaller with the use of alternative productivity measures. Foreign owned firms on average differ from domestically owned firms in a number of dimensions. The Enterprise Surveys collect data on some of these and thus they can be controlled for in order to ensure that any correlation between foreign ownership of a firm and productivity is not spurious. Moreover, this allows some inference on the channels of superior productivity of foreign firms. Spurious results due to omitted variables are less of a concern with respect to the correlation found between productivity and foreign presence at the sector level. The reason is that there would have to be a correlation between those firm characteristics and the share of foreign firms in a sector. For example, even if foreign firms are more likely to be exporters, that does not necessarily imply a larger (or smaller) share of foreign firms in a particular industry. The data allow us to control for a number of the characteristics often associated with foreign ownership. These are the share of skilled workers, a firm’s export status, whether it imports intermediate inputs, whether it is part of a multiplant firm and its age. In addition, we include a control for capacity utilization. Firms in developing countries are more likely than those in developed countries to underutilize their capacity. This could be due to insufficient demand, power outages or the unavailability of parts, among others, as noted by respondents in the surveys themselves.5 While we deal with the issue of outliers further below, even the broadest sample drops some observations from the original data. An important issue for survey data is potential measurement error. The survey data contain two variables from the person giving a particular survey. They indicate how truthful they think the answers given are and whether the numbers are reliable. Note that the two are not the same. For example, a firm representative may give a number that truly represents the most honest estimate of the amount of sales during the previous year, but did not consult any books to come up with that number. In that case, the answer may be considered truthful, but unreliable. All observations flagged as either ‘not truthful’ or as ‘arbitrary and unreliable numbers’ are dropped. The Appendix provides a detailed description of how the dataset used in the empirical analysis was constructed from the raw data provided by the World Bank. Table 2 provides summary statistics for the variables used in the regressions, separately 5 Recall that the main intent in conducting these surveys was to learn more about the specific constraints firms in developing countries face in their everyday operations.
13
Table 2: Summary Statistics Variable All Firms (37,542 observations) Log Labor Productivity Value Added per Worker TFP Foreign Ownership Firm Foreign Ownership Sector Foreign Ownership Sector, by Region Skilled Worker Share Exporter Imported Inputs Multiplant Firm Capacity mostly utilized Age
Mean
Median Std. Dev.
Min
Max
9.747 9.185 5.689 0.102 0.179 0.162 0.236 0.336 0.561 0.135 0.891 17.917
9.797 9.200 5.627 0 0.125 0.073 0.200 0 1 0 1 13
1.525 1.484 1.161 0.282 0.185 0.213 0.188 0.472 0.496 0.342 0.312 17.731
-5.855 0.526 -7.764 0 0 0 0 0 0 0 0 -1
27.302 27.302 23.137 1 1 1 1 1 1 1 1 617
Domestic Firms Only (32,609 observations) Log Labor Productivity 9.659 Value Added per Worker 9.101 TFP 5.624 Foreign Ownership Sector 0.158 Foreign Ownership Sector, by Region 0.130 Skilled Worker Share 0.235 Exporter 0.288 Imported Inputs 0.524 Multiplant Firm 0.110 Capacity mostly utilized 0.889 Age 17.778
9.716 9.125 5.568 0.099 0.042 0.200 0 1 0 1 13
1.487 1.447 1.137 0.166 0.182 0.187 0.453 0.499 0.313 0.314 17.332
-5.855 0.526 -7.764 0 0 0 0 0 0 0 1
27.302 27.302 23.137 0.995 0.998 1 1 1 1 1 617
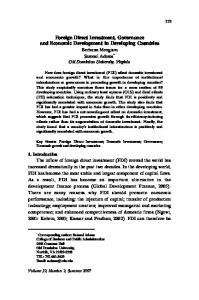
for all firms and private domestic firms only.6 It is notable that while foreign owned firms are more productive than private domestic firms, the difference in the raw data is small. Likewise, the foreign ownership share at the sector level is somewhat higher in the industries that foreign firms operate in, but not dramatically so. Before turning to a discussion of the results, it is instructive to characterize the productivity data visually. Figure 1 below consists of a world map that shows the different productivity quartiles in the data. All colored/shaded countries are included in the sam6 All variables measured in local currency were converted to U.S. dollars and then deflated with a U.S. GDP deflator.
14
ple. Shown is median labor productivity (in levels) in different quartiles. The top quartile consists of China and several Latin American countries, but also includes three countries in Africa (one of them is South Africa) and three in Eastern Europe. None of the Latin American countries, but many in Africa and some in Asia are in the bottom quartile. Overall, the distribution of labor productivity across countries is largely in accordance with intuition and significantly correlated with per capita GDP.7 Figure 1: Median Labor Productivity (in levels), Quartiles
6
Foreign Ownership and Productivity
6.1
Basic Results
This section presents the basic correlations between foreign ownership of the firm, foreign presence in a sector and labor productivity. An important issue for survey data is the representativeness of the sample. In most countries, the sample strata are regions and sectors. The World Bank made every effort to collect information from firms that, as a whole, are a representative sample of the population of the country in question. However, in several countries there were problems contacting a sufficient number of firms in some regions and some sectors. Hence, weights are provided so that all data can be adjusted to 7
In the sample of 118 countries, the correlation is 0.657 with a p-value of 0.
15
give results that are representative of the population. The main results presented below are adjusted using these weights.8 Since the foreign presence is measured at the sector level (within a country), standard errors are adjusted for clustering at the country-industry level.9 Unobserved heterogeneity and local characteristics are likely to matter in such a large cross-country sample, as discussed above. Hence, the basic results all include local fixed effects, which are defined using the regions identified by the surveys within a country.10 Finally, since surveys were carried out in various years, all regressions also include year fixed effects.11 We start by regressing productivity only on the foreign ownership share of an establishment, in addition to the fixed effects. As expected, foreign owned firms are more productive, which is indicated by the positive and highly statistically significant coefficient on that variable in column (1) of Table 3. When we include the foreign presence at the sector level next, it is shown to be positively correlated with productivity and statistically significant at the one percent level, suggesting the potential for spillovers from foreign firms in the same sector. However, when only a sample of domestically owned firms is used in column (3), the statistical significance of the foreign ownership variable disappears, though it remains positive. This suggests that other foreign rather than domestic firms benefit from the presence of foreign-owned firms in the same sector. The regressions thus far have not included sector fixed effects. It is possible that there are common shocks affecting a particular sector across countries that are correlated with productivity. Thus, columns (4)-(6) additionally include industry fixed effects. The caveat of including these is that not all sectors are defined uniformly across countries. For example, smaller countries sometimes only distinguish manufacturing and services whereas larger countries include 2-digit SIC codes. All unique sectors get their own fixed effects. The main result remains: foreign presence at the sector level is still positively correlated 8
There are three different types of weights provided, strict, median and weak weights. The main results shown use the strict weights. The sensitivity of results to using one of the other two weights (which are highly correlated at 0.993) as well as no weights are addressed in Appendix Table A2. 9 In the broad sample, there are 1018 such clusters. Appendix Table A2 shows some results without clustering-adjusted standard errors. 10 In the broadest sample, there are 669 such localities. The number of regions varies across countries with larger countries naturally having more regions than smaller ones. 11 Year fixed effects are of minor importance. However, the omission of location fixed effects affects the results, as also shown in Table A2.
16
Table 3: Full Sample Basic Results Dependent Variable (1) Foreign Ownership Firm Foreign Ownership Sector
Labor Productivity (3) (4)
(2)
(5)
(6)
0.789*** 0.688*** 0.733*** 0.674*** (0.214) (0.192) (0.184) (0.182) 0.954*** 0.580 0.822** 0.464* (0.363) (0.374) (0.409) (0.240)
Observations 37,542 37,542 Adjusted R-squared 0.474 0.477 Year Fixed Effects Yes Yes Location Fixed Effects Yes Yes Industry Fixed Effects No No F(.) 37.55 12.83 Prob.>F 0 0 Robust standard errors in parentheses *** pF 0 Robust standard errors in parentheses *** p