FMEA Risk Analysis: Failure Modes and Effects Analysis Andrew M Robertson Robertson GeoConsultants Inc.
Alternative title:
RISK ASSESSMENT & MANAGEMENT FOR TAILINGS DAMS THE BALANCE BETWEEN EXPERIENCE, JUDGEMENT AND SCIENCE
Andrew M Robertson Robertson GeoConsultants Inc.
CYCLONE SANDY – AN ERROR IN JUDGEMENT OR SCIENCE?
OR AN ERROR IN RISK MANAGEMENT?
OR A RISK – REWARD VALUE DECISSION?
DO WE HAVE THE SCIENCE?
WITH ENOUGH DATA - YES WITH INSUFFICIENT DATA – NO WAS THERE ADEQUATE RISK MANAGEMENT?
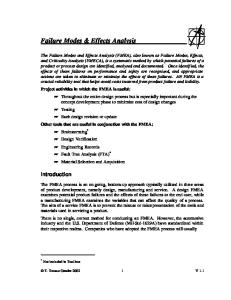
Accurate predictions of event were made two days prior to event. Press release of October 27th, 2 days before landfall: Damage forecasts from a CoreLogic Press Release: CoreLogic® Analysis Shows More Than a Quarter of a Million Homes at Risk of Property Damage in Coastal Mid-Atlantic Region from Projected Hurricane Sandy Storm Surge
CONSEQUENCES OF SANDY • Accurate predictions were made two days ahead of landfall indicating areas affected and risk • Despite accuracy of predictions the death toll was at least 113 • Damage exceeds $50 Billion
LESSONS FROM SANDY While no single feature of Sandy, as a storm, was unique, there occurred a combination of circumstances that was particularly destructive: • Warm water in the area of origin and track to provide large but not unusual energy • High pressure meteorology that controlled the track and speed resulting in opportunity for energy to build storm surge • Surge combined with high tide conditions resulted in extraordinary water elevations This combination of events (Failure Mode) had not been recognized by the ‘community’ for the risk level it posed.
What is risk? • Risk for a particular failure event - is the product of the probability of that failure event occurring and the consequences of the event. Risk = Probability x Consequences • The probability of Sandy was low - it has occurred only once in 300 years of recorded history. • The probability was extreme (deaths and destruction) • The product of the low and extreme results in a conclusion that the risk was very high – a result that is now demonstrated. The Collective Risk is a sum of all the failure modes and their associated risk.
RISK MANAGEMENT An effective Risk Management Program must include the following elements: • Identification of all failure modes and the factors that contribute to the likelihood of occurrence of that failure mode. • An realistic assessment of the probability and consequences – yielding a risk rating. • A program that mitigates the risks to reduce either probability (likelihood) or consequences to tolerable levels. • An Action Plan and Management that implements the Action Plan.
LESSONS FROM SANDY Communities affected by Sandy: • Had access to the science to predict the failure mode and consequences. • Lacked an adequate Risk Management Program. • Possible reasons: o Risk was not adequately assessed (there were assessments and warnings) o Mitigation measures were not identified (mitigation measures do exist) o There was not a program for mitigation implementation (development restrictions and protection works were inadequate)
THE ROLE OF FMEA’S IN RISK MANAGEMENT STAGE 1 – PERFORM A FMEA • Identify all significant failure modes • For each: assess likelihood and consequences • Determine Risk - see the following matrix • Identify tolerable risk levels and failure modes with excessive risk – prioritize need for mitigation • Identify mitigation measures that will reduce risks to tolerable limits STAGE 2 – PERFORM RISK MITIGATION • Develop an Action Plan, including schedule • Implement Action Plan – Mitigate STAGE 3 – PERFORM PERIODIC FMEA REASSESSMENTS • Determine if Risks remain tolerable, and implement additional mitigation as required
HOW TO PERFORM A FMEA The methodology for the performance of FMEA’s is provided at the following URL: http://technology.infomine.com/enviromine/Iss ues/cls_FMEA.html In the remainder of this lecture we will discuss various aspects of FMEA completion and Risk Management.
FMEA RISK MATRIX
TOLERABLE RISK LEVELS While minimization of risk remains a universal goal – there is a threshold of tolerability to excessive risk Tolerable risk levels are different for different entities. The risk that the mining entrepreneur may consider acceptable may be much higher than that acceptable to the community resident that lives in the anticipated flood path when the upstream tailings dam fails. Experience in conducting numerous FMEA’s on hundreds of tailings dams in working groups with a wide variety of stakeholders by a large number of risk assessors has lead to the following typical risk assessment criteria.
RISK MANAGEMENT MITIGATION PRIORITIES • Deep red – Extreme Risk: CEO responsibility • Orange and orange/red – High Risk: Director responsibility • Yellow – Moderate Risk: Senior Manager responsibility • Green – Tolerable with Divisional Manager responsibility • Blue – Well within tolerable limits, risk reduction continues as operating good practice.
LIKELYHOOD OF OCCURENCE
Likelihood Class
Likelihood of Occurrence for Safety Consequences (During period of interest)
Likelihood of occurrence for Environmental and Public Concern Consequences (During period of Interest)
Not Likely (NL)
1:2
Moderate (M) High (H) Expected (E)
CONSEQUENCS ASSESSED Different failure modes have very different consequences. Some may have high cost consequences to the company, but are of little interest to the Public. Others may be of great concern to the Public but little cost consequences (readily mitigated) to the company. Combining or summing all the consequence effects in a single matrix has ben found to be confusing the different stakeholders involved in a FMEA To fully assess consequences. To reduce such confusion, the key consequences are typically assessed separately.
TYPICAL CONSEQUENCE CATEGORIES The following consequence categories are typically assessed, but others can be added or selected to suit specific project needs. • • • • •
Environmental or Land use impacts Regulatory impacts (New Brazil legislation an example) Public concern impacts (Social license depends on this) Health and safety Mining costs
The consequence severity characteristics are illustrated for only the Environmental Impacts in the following slide.
CONSEQUENCE CLASSES
Consequence Severity
Environmental Impact
Extreme (E)
Catastrophic irreversible and large impact on vegetation and habitat
High (H)
Significant irreversible impact on vegetation and habitat, or large and reversible
Moderate (M)
Significant reversible impact on vegetation and habitat
Low (L)
Minor impact on vegetation on vegetation and habitat
Negligible (N)
Little or no measureable impact.
FMEA RISK MATRIX
THE FMEA WORKSHEET
ARD CONTROL
MITIGATION/ COMMENTS
LEVEL OF CONFIDENCE
HEALTH & SAFETY
A1
OPEN PIT
A11
TAILINGS STORAGE FACILITY
A12.1
MINE ROCK PILE
A12.2 A13
pit walls generate acidity
increased acidity at treatment plant PC
E
L
N
L
N
H
inadequate blending of non-acid and acid forming tailings inadequate cover material stockpiling inadequate segregation of reactive material
increased acidity at treatment plant O,PC E increased infiltration & acidity & delayed infiltration reduction PC H contaminated discharge in unexpected areas O,PC L
L
M
M
N
H
L
M
M
N
H
M
H
H
L
M
LIKELIHOOD N = NOT LIKELY L = LOW M = MODERATE H = HIGH E = EXPECTED
CONSEQUENCES N = NEGLIGIBLE L = LOW M = MODERATE H = HIGH E = EXTREME
NOTES: PROJECT STAGE: PC = POST CLOSURE O = OPERATIONS
PUBLIC CONCERN & IMAGE
REGULATORY IMPACTS & CONCERNS
BIOLOGICAL IMPACTS & LAND USE
LIKELIHOOD
PROJECT STAGE
EFFECTS
FAILURE MODE
CONSEQUENCES
ID
MINE AREA/ COMPONENT
FAILURE MODES AND EFFECTS ANALYSIS (FMEA) WORKSHEET.
LEVEL OF CONFIDENCE H = HIGH M = MODERATE L = LOW
provide increased treatment provide increased treatment/sludge storage, evaluate potential to improve blending provide increased treatment/water storage provide independent QA/QC, provide additional capture or treatment
ELEMENTS OF THE WORHSHEET The Worksheet provided for the following to be recorded: 1. Element of structure (embankment, spillway etc.) 2. Failure mode ID – unique for each failure mode and effect 3. Failure Mode (how will failure occur) 4. Effect (what is the effect of failure) 5. Project Period of Interest (Construction, Operation and Post Closure) 6. Likelihood (as previously described) 7. Consequences (as previously described) 8. Level of Confidence (how reliable is the assessment) 9. Mitigation measures to reduce the assessed risk
RISK MANAGEMENT USING THE FMEA SPREAD SHEET • The FMEA spreadsheet is an extremely useful tool to both describe the risk associated with a tailings impoundment, as well as plan risk reduction where this is needed. • It forms a basis for discussion and explanation with all stakeholders. • The risk ratings derived during the FMEA, together with the mitigation measures identified are used develop the Action Plan for Risk Reduction, which is used in turn for managing the the nature and progress of the mitigation work.
HOW UNCERTAINTY ADDS TO RISK • Tailings dam design and operation involves a wide variety of the natural sciences, notably geology, hydrogeology, geotechnics, hydrology and geochemistry which are by nature variable. Investigations cannot resolve all uncertainties and our risk is dependent substantially on this uncertainty. • The activities of man add to these uncertainties, and while soils, hydrogeology, geotechnical testing, and construction QA/QC is done we are often faced with misplaced reports, as-built drawings and reports not prepared and sometimes with questionable qualities of investigation, design and construction. • These uncertainties must all be taken into consideration when performing the FMEA. • Increased uncertainty results in increased Risk
HOW COMPLEXITY AND INAPPROPRIATE DATA ADD TO RISK For FMEA’s on mechanical parts and processes, a mathematical basis for calculating likelihood of failure is often used, based on trigger events, fault trees and combining the probability of individual events. Probability data to support this approach exists where there is a high reliability of material properties and behavior. Such methods have been found to be difficult and unreliable for (geotechnically) highly variable structures such as tailings dams. They give rise to an excessively complex analysis structures which are not supported by the low reliability of the property and behavioral distributions used to determine likelihood functions.
PERFORMANCE OF FMEA’S - PART SCIENCE, PART EXPERIENCE, PART JUDGMENT Assessing the likelihood of a piping failure by adopting the statistics of all past piping failures in dams, regardless of the specific conditions that influence piping for the dam under consideration, is not appropriate. The site specific conditions must be taken into account; though the analyst may be influenced by his/her perception of the relative likelihood for such a failure compared with all data relative to piping failures of which they are aware. The larger the experience of the analysts with regard to precedent and published literature the more reliable will be an estimate of likelihood. Good and informed judgment is an essential ingredient to obtaining best estimates of both likelihood and consequences. However the wise judges will make liberal use of any science that can add to the knowledge base they consult.
TIME BRINGS ON ADDITIONAL RISK “Time waits for no man”. Our geological process are a very graphic reminder of this. From common day erosion and geochemical weathering, to the more controversial issue of Global Warming we need to remain conscious that there are time dependent changes that we have to take into consideration when designing tailings dams that will be in the landscape, in perpetuity. ‘In perpetuity’ is a long-long time. Lets reflect on how this may influence our application of the FMEA.
THE LARGER THE DAM THE BIGGER THE RISK As tailings dam designers we are continuously being challenged to build larger dams to accommodate increased mineral processing volumes, in areas where we are being more constrained by available land as we compete for land with communities. To this is added a requirement to build with smaller footprints, using less water, and increasingly to ‘not leave dams in the landscape when you leave’. What is our future? For this next part of the lecture, I take the liberty of repeating a key note address I made last year at the Tailings and Mine Waste 2011 conference.
How Large are our mine becoming? Daily Milling Capacity, Tons/day (Log Scale)
100’s in 1900 1000’s by 1930’s 10,000’s by 1960’s 100,000’s by 2000’s
10000.0 1000.0 100.0 10.0 1.0
Anticipate : 1M’s by 2030’s 10M’s by 2060’s
0.1 1900
1950
2000
Year
2050
Waste Increase on Mines Milling: The largest metal mines are at The largest oilsands mines are at
0.25 M t/d 0.65 Mt /d
Total waste: The largest mines
>1.0 M t/d
For 4 cycles the largest mines have increased tailings and mine waste by 10 fold each 1/3 century The average mine size growth is likely similar
Waste Facility Size Increase Each 1/3 century: Volume of waste increases by ~10 fold Area of waste deposits increase by ~ 5 fold Heights of dams/dumps increase by ~ 2 fold Max. Dam heights in1900 Max. Dam heights in 1930’s Max. Dam heights in 1960’s Max. Dam heights in 2000’s Max. Dam heights in 2030’s Max. Dam heights in 2060’ s
~ 30 m ~ 60 m ~ 120 m ~ 240 m ~ 480 m? ~1000 m?
Risk of Waste Facilities Risk = Likelihood x Consequences For dams:
Likelihood Consequences
~ ‘somewhat’ proportional to height ~ ‘somewhat’ proportional to volume
Increase in ‘potential risk’ ’ per 1/3 century is ~ 2 X 10 = 20 fold
Risk Increase with Time Risk Increase with Time
1200
1000
1000
100
800
10 Risk
Height (m)
Dam Height Increase with Time
600 400
0.1 0.01
200 0 1900
1
0.001 1950
2000
Year
2050
0.0001 1900
1950
2000
2050
2100
Year
Our dams and dumps are amongst the highest risk structures on earth
Dragons in the Landscape We are no longer dam building –
we are terraforming. To address waste volume requirements we have to build:
Bigger : higher stresses, higher strains, higher consequences Faster: higher pore pressures, static liquefaction, rushed construction, less observation time To Last longer:
Closure is for the mine - not the waste facility Perpetuity is a long-long time
In the words of a well known Canadian tailings dam designer Ed McRoberts:
‘Don’t tickle the dragon’
Dragons in the Landscape
‘Don’t tickle the dragon’
Rearing Dragons The challenges of design & construction: Bigger, Faster, Last Longer • Murphy’s watching he’s on the other team • Black swans will land
Sleeping Dragons • Perpetuity is a long, long time • Murphy’s ‘A’ Team – the perpetual forces: Erosion, Weathering, Sedimentation & Precipitation, Global Warming
• Murphy’s ‘B’ Team – Extreme events: Floods, Earth quakes, Financial crisis, Political instability
TO GO BEYOND PRECIDENT WE MUST DANCE WITH DRAGONS
To Dance with Dragons We need: Technology – for design construction and long-term stability Fiscal capability – To construct and operate and not leave a debt burden on our grandchildren Governance – over succeeding generations and changes in expectations
Trainable Dragons Our star performers: • Centerline sand dams • Hydraulic Sand stacking – with slimes containment • Filtered tailings – dry stacking • Rockfill dams - with upstream facing • Rockfill dams – centerline construction
CenterLine Dams: Cerro Verde
Pro’s: Deformation tolerance, permeability, permeability preservation, liquefaction resistance, cost, minimization of additional disturbance. Con’s: Location limited, erosion vulnerability, sensitive to floods, reliance on drains, geochemical sensitivity
Drained Stacking of Sandysilt Tailings Germano Buttress Dam Pro’s: Deformation tolerance, permeability, preservation of permeability, cost, minimization of additional disturbance, progressive reclamation Con’s: Erosion vulnerability, reliance on drains, liquefaction susceptibility, geochemical sensitivity, slimes?
Filtered Tailings Greens Creek - Alaska
Pro’s: Location flexibility; deformation tolerance; avoidance of pore pressures, floods, liquefaction; minimization of additional disturbance; progressive reclamation Con’s: Operating conditions, costs, erosion vulnerability, geochemical sensitivity
Rockfill Dams – With Upstream Facing Antamina
Pro’s: Permeability, permeability preservation, liquefaction resistance, stability, erosion resistance, flood control Con’s: Location limited, sensitive to deformations, geochemical sensitivity, additional disturbance, cost
Rockfill Dams – Centerline Cerro Corona Pro’s: Permeability, permeability preservation, liquefaction resistance, stability, erosion resistance Con’s: Location limited, sensitive to deformations, geochemical sensitivity, additional disturbance, cost
Our Difficult Dragons Paste Tailings: Operational challenges, cost, liquefaction/stability, water management Slimes Management: Containment, operational challenges, fluidity, reclamation
Black Swans Black Swans are not predictable beyond that – they will arrive. Perhaps a few Grey Swans are shadows on the horizon: • High tailings dams may cease to meet the test of long-term risk acceptability – Fearful Dragon • Slurry Tailings in liquefaction susceptible deposits- ditto • Sustainability of contaminated water collection and treatment? The Sulfate Dragon • Geosynthetics in construction where durability is required? – Dragons of Vulnerability • Closure Plans may morph to post Closure Sustainable Use Plans – Feeding the Immortal Dragons
May All Your Dragons Be Friendly