Extended Gravity Panel Data Model of Poland’s Foreign Trade Tomasz Brodzicki* University of Gdańsk
Abstract The goal of this article is to investigate the determinants of the pattern of bilateral trade flows of Poland with its major trade partners with the use of trade gravity model approach. The analysis is carried out for 181 trade partners of Poland in the period 1999-2006. In the basic version of the trade gravity model we take into account only the standard factors as suggested by the literature of the subject. In its extended version we control for several additional factors including: quality of institutions, impact of regional and bilateral trade agreements or exchange rate volatility In order to obtain unbiased results we utilize the Prais-Winsten regression with Panel Corrected Standard Errors (PCSE). In most of the cases the coefficients for the traditional gravity determinants are economically sensible and their impact on the dependant variable is statistically significant. The impact of market size, distance or quality of institutions are in line with our expectations. The role of migrants as proxied by the size of Polish diaspora is rather large. Increase in the size of Polish diaspora of 1 per cent increases bilateral trade by approx. 0.2 per cent. Foreign exchange rate volatility has an adversely negative impact on the trade flows. The unrealized potential of a membership in the eurozone could be judged relatively high. The results concerning trade agreements are however rather unanticipated.
Keywords: trade gravity model, Poland, data panel estimation, PCES method JEL codes: C23, F10, F14, F15
This is a preliminary version of the paper. Please do not distribute!!!
Acknowledgment I would like to thank Dorota Ciołek for useful comments on an earlier version of the paper
* Correspondence: dr Tomasz Brodzicki, Economics of European Integration Department, Faculty of Economics, University of Gdańsk, Ul. Armii Krajowej 119/121, 81-824 Sopot, Poland. e-mail:
[email protected]
1
Extended Gravity Panel Data Model of Poland’s Foreign Trade Abstract The goal of this article is to investigate the determinants of the pattern of bilateral trade flows of Poland with its major trade partners with the use of trade gravity model approach. The analysis is carried out for 181 trade partners of Poland in the period 1999-2006. In the basic version of the trade gravity model we take into account only the standard factors as suggested by the literature of the subject. In its extended version we control for several additional factors including: quality of institutions, impact of regional and bilateral trade agreements or exchange rate volatility In order to obtain unbiased results we utilize the Prais-Winsten regression with Panel Corrected Standard Errors (PCSE). In most of the cases the coefficients for the traditional gravity determinants are economically sensible and their impact on the dependant variable is statistically significant. The impact of market size, distance or quality of institutions are in line with our expectations. The role of migrants as proxied by the size of Polish diaspora is rather large. Increase in the size of Polish diaspora of 1 per cent increases bilateral trade by approx. 0.2 per cent. Foreign exchange rate volatility has an adversely negative impact on the trade flows. The unrealized potential of a membership in the eurozone could be judged relatively high. The results concerning trade agreements are however rather unanticipated. Keywords: trade gravity model, Poland, data panel estimation, PCES method JEL codes: C23, F10, F14, F15
1
Introduction
The trade gravity framework is for sure one of the most successful models in empirical economics sofar (Frankel, Rose 2002). In the basic form of the gravity equation, trade between a pair of countries is modeled as an increasing function of their sizes and a decreasing function of the distance between the two countries. This simple framework explains most of variation in observed volumes of trade flows. For these reason the gravity model has become one of the standard empirical tools for analyzing trade patterns. The gravity model has been also utilized both as a tool for ex-post assessment as well as for identifying (forecasting) potential trade effects of regional trade agreements1. It was also utilized
1
For instance Aitken (1973) for the EEC, Papozoglou et al. (2006) for accession of CEEs into EU.
2
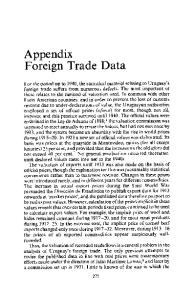
extensively in a vibrant and still ongoing debate on the so-called Rose – the potential trade effects associated with formation of currency union2. Traditionally the gravity equation was estimated in cross-section using OLS. The conventional crosssection approach without the inclusion of country specific effects was misspecified and led to an important bias in the results (Matyas 1997). Egger and Pfaffermayr (2003) recommended the use of a three-way model with effects for importer, exporter and time or explicit introduction of country pair effects (to account for country pair heterogeneity). Apart from the specification of the model also more sophisticated estimation techniques have been utilized. The trade gravity approach has been utilized several times to analyze the trade pattern of Poland with its trading partners. For instance, in a recent study Cieślik (2007) utilized the gravity approach to identify the trade-effects of free trade agreements within the period 1992-20043. The estimated model apart from standard variables contained factor such as geographical proximity, language, common history and FTA dummies. Cieślik found the impact of bilateral and regional trade agreements to be positive and statistically significant. The analysis was performed on a pooled panel of data with time effects and estimated with heteroscedasticity-adjusted OLS method. The impact of various agreements on trade differ. Cieślik found the regional agreements to be more trade-creating than bilateral agreements. At the same time the trade effects associated with EU and EFTA were found to be far greater that the effect of CEFTA. Furthermore, the positive impact on trade seems to appear only several years after establishment of liberalized trade arrangement. Identifying the determinants of trade pattern of Poland it is worth to comment on the dynamics of Polish trade in recent years. In the analyzed time-period 1999-2005 the volume of Polish trade increased significantly from 75.7 to 202.9 billion USD (in constant 2000 USD). The volume of Polish imports more than doubled while Polish exports more than tripled (please refer to Figure 1). In 2006 Germany was the single largest trade partner of Poland accounting for 28,2 per cent of total trade (27, 3 per cent in exports, 29,0 per cent in imports). It was followed by Russia ( 7,2 per cent), Italy (6,4 per cent), France (5,8 per cent) and the Netherlands (4,9 per cent). Polish trade is heavily concentrated. In 2006 five biggest trade partners accounted for 52,4 per cent of total trade volume and ten biggest for 69,8 per cent of total trade volume. At the same time imports are more concentrated than exports though the difference isn’t significant. It is worth to note, that the concentration ratios both for exports and imports have fallen since 1999. Most of the trade is conducted with the partners in the European Union. Intra-EU trade accounted for 74,5 per cent of Polish trade in 2006 with the shares in exports and imports at the level of 77,3 and
2
Please refer for instance to Rose (2000, 2001), Glick, Rose (2002), Frankel, Rose (2002). Taking into account the time-period of the analysis some of the effects could be associated with the process of gradual transformation towards market-economy. Cieślik does not control for that. 3
3
72,0 per cent respectively (please refer to Figure 2). The share of intra-EU trade increased by 9,1 per cent in a result of the Eastern enlargement of the European Union on 1 May 2004. Among the biggest trade partners (total trade with Poland in 1999 exceeding 100 million USD) the highest relative expansion it total trade volume in the analyzed period occurred in the case of Turkey (as proxied by ration of total trade in 2006 to total trade in 1999, 770), Romania (542), Estonia (509), Bulgaria (458), Hungary (439), Belarus (427), Ukraine (421), Russia (419) and Slovak Republic (410). In absolute terms the increase in total trade volume was the highest in the case of Germany (+ 34,8 billion USD), Russia (+11,0 billion USD), France (+7,2 billion USD), Czech Republic (+6,7 billion USD), Italy (6,6 billion USD), the Netherlands (6,5 billion USD), UK (+5,3 billion USD), Hungary (+4,1 billion USD) and Belgium (4,0 billion USD). The rest of the paper is organized as follows. Section 2 briefly introduces theoretical background of the trade gravity approach. Section 3 presents empirical methodology and data. Section 4 presents and discusses results of estimation of the empirical model. Section 5 concludes.
2 Theoretical background The gravity equation as a tool of explaining bilateral trade patterns was originally proposed by Tinbergen back in 1962 (Tinbergen 1962). Despite of it unquestionable success in empirical studies, they were often criticized for insufficient theoretical foundations. This drawback has been more than eliminated in the last 20 years with the rise of new trade theory with its rich microfoundations4. It is worth to stress, as Carrere (2005) for instance points out, that the gravity equation can be formally derived within a imperfectly competitive set up with increasing returns to scale and firm-level product differentiation as well as within a perfect competition set-up with product differentiation at the national level. The gravity equation in the simplest form postulates that bilateral trade between two countries is directly proportional to economic size of the trading partners and inversely proportional to the distance between them (D) thus resembling the famous Newton’s gravity law. The economic size of the partners is usually given by real income (Y). In mathematical notation the simple gravity equation has the following structure:
[1]
Yiα Yjβ TTij = A Dijφ
,
4
The early theoretical foundations within the imperfect competition framework were provided among others by Helpman (1987) or Bergstrand (1989). Please refer to Feenstra (2004).
4
where, TTij - total trade flows between country i and country j, Yi , Y j - market size of countries i and j, for instance given by their real income, Dij - distance between counties i and j, A – some constant gravity parameter. Log-linearising yields the following equation: [2] ln TTij
= ln A + α ln Yi + β ln Y j − φ ln Dij
The basic gravity equation is frequently extended to incorporate other factors affecting (stimulating or hindering) bilateral trade flows. These could include for instance incomes per capita of trade partners. The gravity model implies than that the larger, the more prosperous and the closer to each other are two countries, the more they are likely to trade. The model could be further augmented to incorporate cultural and linguistic proximity, historical links and various barriers to trade. In the popular set-up two different components of barriers to trade are often included which have a spatial and non-spatial dimension. Apart from the impact of distance, the spatial exogenous barriers severely affecting transport cost are for instance given by common border (adjacency) or landlockedness. The removal of non-spatial barriers (trade liberalization) is commonly proxied by dummies for regional or bilateral trade agreements. It is also common to include institutional quality controls as the quality of institution can directly and indirectly affect trade relations. For instance de Groot et al. (2004) using the gravity approach studied the impact of quality of institutions on bilateral trade flows. They found that having a similar institutional framework promotes bilateral trade on average by 13 per cent while an increase in overall institutional quality of one standard deviation from the mean leads to an estimated increase of 30 – 44 per cent in bilateral trade.
3 Methodology and data We estimate a gravity model to identify the potential factors having an important impact on the trade pattern of Poland with its trade partners. The analysis is carried out at the aggregated level – we do not differentiate between exports and imports. The dependent variable is the total trade (TT) between Poland and trade partner i at time t. The model is estimated with data covering 181 trade partners of Poland over the period 1999–2005 with yearly observations (giving a potential total of 1267 observations)5. The countries included in the
5
Due to missing on real GDP data we had to exclude 25 trade partners from the analysis. The sample on trade has a total of 1442 observations (7 observation for 206 partners). Zero trade flows have been excluded for simplicity.
5
sample had a share of 99.6 per cent in the total trade volume of Poland in 2005, 99.5 and 99.8 per cent of Polish imports and exports respectively. Appendix A provides a full list of trade partners included in the sample. Due to missing data the panel is unbalanced with the total number of observations in the range from 976-1220 depending on specification. Trade data are from EUROSTAT’s COMEXT (Eurostat 2007) containing information on total bilateral trade in current euros between Poland and 206 trade partners (countries and territories). The data on gross domestic product, GDP per capita and population size are from the World Development Indicators 2007 CD-ROM (World Bank 2007). All the nominal data have been properly adjusted and are given in constant 2000 USD. Bilateral distances were compiled using the Google Earth software. The estimated trade gravity equation has the following log-linear form:
ln TTit = α 0 + β1 ln YPL,t + β2 ln Yit + β3 ln DPL ,i + β4 X it + [3]
+ β5 FTADit + β 6 cpi + β 7 yrt + eit
, where
α0
- constant term - common to all years and pairs of countries
YPL,t , Yit
- real GDP of Poland and of a trading partner i
DPL ,i
- geographical distance between trade partners
X it
- matrix of additional explanatory variables
FTADit
- matrix of time-variant dummy variables for regional and bilateral trade liberalization agreements between Poland and its trade partners
cpi
- country-pair dummy
yrt
- time-specific dummy
eit
- error term assumed to be log-normally distributed
The choice of the proper estimation technique among the available spectrum is of prime importance (Carrere 2005). We utilize the Prais-Winsten regression with Panel Corrected Standard Errors (PCSE) as suggested and utilized in a similar study by Papazogulou (2006) and Marques (2008). The PraisWinsten regression with Panel Corrected Standard Errors (PCSE), which assumes that the
6
disturbances are heteroskedastic (each country has its own variance) and contemporaneously correlated across countries (each pair of countries has their own covariance)6. The dependant variable in the model is a volume of bilateral trade between Poland and its trade partner i in the year t (tt).7 The fundamental explanatory variables of the standard gravity equation include the variables giving the size of the market of trade partners as proxied by real GDP (pllngdp for Poland and lngdp for partner country) and geographical distance. Distance is measured as a great circle distances in kilometers between Warsaw and capitals of individual trade partners. We take into account the relative prosperity of trade partners by introducing logs of real GDP per capita for Poland and the trading partner (lngdppc and pllngdppc). Market size can also be represented by log of population of two trade partners (lnpop and pllnpop respectively). All these variables enter the regression in natural logarithms. In accordance with the theory we expect distance to have statistically significant and negative impact on total trade while real GDPs, total population as well as higher per capita incomes to have a positive effect. We take into account adjacency of a trade partner with Poland by introducing a dummy variable border. We expect it to have a positive impact on bilateral trade flows. To take into account the potential impact of the quality of institutions we adopt two proxies aggregate indices of institutional development from the well-known study of Kaufmann, Kraays and Mastruzzi (Kaufmann et al. 2005). These are: rule of law (roflaw) and political stability (polstab). They are expected to have a positive impact on the volume of bilateral trade flows. Foreign exchange rate volatility (exvol) is defined as standard deviation of average monthly exchange rate from the mean in year t. Due to a large number of missing observations on average monthly exchange rates of Polish against foreign currencies in the NBP data set we made the following assumption – for European countries we assumed volatility of PLN-EUR exchange rate and for nonEuropean countries we adopted the volatility of PLN against US dollar. This off course could bias the obtained results. The size of Polish migrant community in trade partner countries could affect bilateral trade in several ways for instance by generating demand for home-made goods or by lowering total transaction costs. In order to check its potential impact on bilateral trade we construct a variable diasp which is the log of total migrant Polish community in a trade partner’s market. Due to data limitations we assume it to be time-invariant.
6
All equations were estimated using the statistics package, STATA Version 8. We utilize xtpcse command with panels-specific AR(1) and panel-level heteroskedastic errors. In the estimation we include all available nonmissing pairs. 7 Definitions, sources and basic statistics of variables utilized in the empirical model are provided in Appendix B.
7
Finally we include the potential impact of regional and bilateral trade liberalization agreements mentioned above. In order to do that we construct a set of dummy variables for liberalization of trade within the Central European Free Trade Agreement (cefta), with the MS of the European Union under provisions of the European Agreement from 1991 followed by the full accession in 2004 (eu), with members of the European Free Trade Area (efta) as well as bilateral free trade agreements with Croatia (entered into force in 2002), Estonia (1999), Israel (1998), Lithuania (1997), Latvia (1999) and Turkey (2000) – variable fta for bilateral agreements. In addition we construct a dummy for trade partners of Poland affected by common commercial policy of the EU (CET vis-à-vis third states) – variable ccp8. The model is supplemented with time effects dummy (yr) to capture common shocks and country pair dummy (cp) to capture country pair specific effects depending on specification.
4 Estimation results Table 1 at the back of the paper presents the results of estimation. As has been already said above year-controls are included in all specifications of the model while country-pair effects are included depending on the specification9. Their coefficients are however not reported in the table. The exclusion of country pair dummies has a significant impact on the obtained results – especially when we control for additional factors apart the standard determinants. The general fit of the model is high – explaining from 97 to 99 percent of the variation in the data depending on the specification. In most of the cases the coefficients for the traditional gravity determinants such as real GDP per capita of trade partners and distance are economically sensible and their impact on the dependant variable is statistically significant. Some of the results are however surprising10. Market size of the trade partner has a robustly positive impact on the volume of trade and the larger countries tend to trade more with Poland. The effect is however not robust to inclusion of rule of law as a proxy for quality of institutions when country pair effects are present (please refer to specification 4 and 13). In most specifications the size of the Polish economy has a significant and statistically significant impact on bilateral trade flows. The impact of the size of Polish economy is generally speaking much weaker than the impact of the market size of the trade partner. The positive impact of a common border (adjacency) seems to depend on the inclusion of country pair dummy. All in all it is rather weak. The size of Polish migrant community as proxied by diasp has a positive and significant impact on bilateral trade flows in line with out expectations. It is also robust to extensions of the specification 8
In line with the suggestion of Cieślik (2007). All specifications with „b” have no county pair effects. 10 Due to problems in the estimation we had to drop the specifications extended by log of GDP per capita as well as log of total populations. 9
8
with other controls. Increase in the size of Polish diaspora (population-wise) of 1 per cent increases bilateral trade by approx. 0.2 per cent. Quality of institutions of the trade partner as proxied by rule of law or political stability has a positive and statistically significant impact on bilateral trade. Foreign exchange rate volatility as proxied by exvol has an adversely negative impact on the trade flows. The result is robust to inclusion of further control variables. Depending on a specification the estimated coefficient on the variable varies from -1.3 to -5.3, indicating that trade between Poland and its trade partner falls by more than 1 percent for every 1 percent increase in the foreign exchange volatility (it is thus more than proportional). Taking into account that nearly 55 per cent of Polish foreign trade flows in 2006 took part with eurozone countries as well as the gradual expansion of the eurozone the costs of staying outside of the union (with the accession exvol for those countries it would drop to zero) in terms of the unutilized trade potential are high11. The result is a surprise as Frankel and Rose (2002) point out most studies on the effect of exchange rate volatility on trade find small or negligible effects. This could be however a result of using time-series approach. Membership in the currency union (eurozone) may promote trade by reducing the costs of international transactions and thus could induce beneficial income effects (currency-union induced trade effect). The results concerning the impact of regional and bilateral trade agreements need a longer comment. Firstly, in specifications 7 to 11b we extend the base specification with dummy variables for trade agreements described in the previous section. They enter the model separately. The impact of all variables of interest to us is statistically significant at least at 5 per cent level. The impact is positive for EU and EFTA – with a coefficient on EFTA exceeding 1. It is however negative for CEFTA, bilateral arrangements and a proxy for common commercial policy (the impact of common external tariff). Secondly, all trade related dummies enter the regression at the same time. The obtained results are sensitive to inclusion of both country-pair effects as well as the extension of the conditioning set of variables (13 and 13b). The impact of common external policy is negative and statistically significant all across. The impact of bilateral trade arrangements as proxied by fta is not statistically significant if we take into account the whole range of relations. The impact of EFTA is positive but not statistically significant in all specifications. The negative impact of CEFTA holds in all specification apart form one. Last but not least the impact of trade liberalization with EU has a negative impact if we control for other trade arrangements and include country pair effects. The result is not robust and could be caused by the inclusion of the proxy for common commercial policy.
5 Conclusions
11
According to officials of the Polish central bank, Poland is likely to adopt euro in 2012 at the earliest.
9
The goal of this article was to investigate the determinants of the pattern of aggregated bilateral trade flows of Poland with its major trade partners with the use of trade gravity model in a panel data framework. In order to obtain unbiased results we utilized the Prais-Winsten regression with Panel Corrected Standard Errors (PCSE). In most of the cases the coefficients for the traditional gravity determinants are economically sensible and their impact on the dependant variable is statistically significant. The impact of market size, distance or quality of institutions are in line with our expectations. The role of migrants as proxied by the size of Polish diaspora is rather large. Increase in the size of Polish diaspora of 1 per cent increases bilateral trade by approx. 0.2 per cent. Foreign exchange rate volatility has an adversely negative impact on the trade flows. The unrealized potential of a membership in the eurozone could be judged relatively high. Some of the results are however surprising. This applies particularly to the impact of trade arrangements. The results are rather different from the obtained before for instance by Cieślik (2007). This could be related to the choice of the estimation technique as well as the span of data in temporal dimension. Furthermore, the border effect for Poland is found to be rather weak. For future research several important problems should be taken into account. First of all elimination of zero trade observations could have led to sample selection bias in the estimations. Secondly, the time series dimension of the sample is relatively short. It should be elongated. Apart from taking care of the above, we envisage several direction for further research in the area. The analysis should discriminate between exports and imports. Furthermore, the analysis could be repeated on disaggregated sectoral level data. One should also check the robustness of the obtained results to the choice of method of estimation. Another possibility is to estimate the equations through the Hausman-Taylor estimator as recommended by Egger (2005) or Hausman-Taylor estimator with AR1 (Egger 2002).
10
Table 1 Gravity Model Results (1) lngdp pllngdp distance
(1b)
(2)
(2b)
(3)
(3b)
(4)
(4b)
(5)
(6)
(6b)
(7)
(7b)
0.869
1.005
0.869
1.006
0.869
0.822
0.302
0.954
0.947
0.846
1.012
0.873
1.008
(0.364)**
(0.029)***
(0.364)**
(0.031)***
(0.464)**
(0.038)***
(0.391)
(0.036)***
(0.052)***
(0.370)**
(0.031)***
(0.362)**
(0.037)**
0.639
0.167
0.639
0.135
0.350
0.230
1.047
0.167
0.186
0.292
0.106
0.347
0.129
(0.246)***
(0.040)***
(0.256)***
(0.043)***
(0.136)**
(0.046)**
(0.468)**
(0.037)***
(0.052)***
(0.381)
(0.045)***
(0.138)**
(0.042)***
-2.525
-1.371
-2.525
-1.282
-1.710
-1.152
-2.250
-1.216
-1.245
-1.156
-1.196
-1.407
-1.268
(0.551)***
(0.092)***
(0.551)***
(0.107)***
(0.642)**
(0.103)***
(0.564)***
(0.061)***
(0.075)***
(0.311)***
(0.103)***
(0.755)*
(0.102)***
border
0.699
0.806
-1.199
0.263
1.856
1.323
0.880
0.833
1.224
-0.236
1.034
(1.830)
(0.431)*
(1.105)
(0.341)
(1.997)
(0.214)***
(0.294)***
(0.828)
(0.367)***
(1.375)
(0.386)***
-5.034
-3.633
(1.092)***
(1.257)***
diasp
0.223
0.166
(0.125)*
(0.021)***
roflaw
0.378
0.147
(0.190)**
(0.075)** 0.232 (0.094)**
polstab exvol cefta
-0.628
-0.317
(0.053)***
(0.088)***
eu efta fta ccp n R2 Chi2
1220 0.993 741773***
1220 0.972 84502.7***
1220 0.993 741773***
1220 0.972 82000.4***
1220 0.993 204859.8
1220 0.975 150473***
1043 0.994 557483***
1043 0.982 167082***
976 0.980 116095***
1178 0.993 203762***
1178 0.970 80962***
1220 0.994 677456***
1220 0.971 84479***
yr* cp*
yes yes
yes no
yes yes
yes no
yes yes
yes no
yes yes
yes no
yes no
yes yes
yes no
yes yes
yes no
Note: All regressions carried out using Prais-Winsten Regression with Panel-specific AR(1) and Correlated Panels Corrected Standard Errors. Standard errors in parentheses. * significant at 10%; ** significant at 5%; *** significant at 1%. Estimated using STATA Version 8. Dependent variable - log of total trade between Poland and partner i (in constant USD from 2000). Total number of observations (n). t-Student statistics under coefficients.
11
Table 1 continued (8) lngdp pllngdp distance border
(8b)
(9)
(9b)
(10)
(10b)
(11)
(11b)
(12)
(12b)
(13b)
0.914
0.999
0.869
1.005
0.863
1.007
0.991
1.010
0.978
1.004
0.344
0.832
(0.361)**
(0.029)***
(0.364)**
(0.030)***
(0.362)**
(0.031)***
(0.355)***
(0.026)***
(0.359)***
(0.028)***
(0.0407)
(0.037)***
0.263
0.124
0.639
0.129
0.351
0.133
0.441
0.154
0.484
0.121
0.647
0.188
(0.232)
(0.041)***
(0.246)***
(0.043)***
(0.137)***
(0.043)***
(0.316)
(0.037)***
(0.346)
(0.037)***
(0.173)***
(0.045)***
-1.287
-1.233
-2.525
-1.261
-1.387
-1.278
-2.216
-1.287
-2.306
-1.194
-1.219
-0.976
(0.476)
(0.099)***
(0.551)***
(0.106)***
(0.751)*
(0.105)***
(0.356)***
(0.067)***
(0.511)***
(0.085)***
(0.383)***
(0.097)***
0.564
1.279
0.699
0.872
0.024
1.258
-0.213
1.263
-0.315
1.521
1.859
0.869
(1.013)
(0.287)***
(1.829)
(0.427)**
(1.373)
(0.336)***
(0.421)
(0.169)***
(1.260)
(0.179)***
(0.551)***
(0.196)***
diasp roflaw exvol cefta eu
(13)
0.333
0.142
(0.295)
(0.022)***
0.368
0.0224
(0.202)*
(0.077)
-1.295
-3.099
(1.073)
(1.231)**
-0.444
-0.003
-0.217
0.279
(0.089)***
(0.122)
(0.081)***
(0.076)*
0.536
0.416
-0.309
0.273
-0.027
0.456
(0.077)***
(0.137)***
(0.103)***
(0.171)
(0.088)
(0.180)**
efta
1.416
1.311
1.723
1.436
0.335
0.810
(0.672)**
(0.426)***
(0.786)**
(0.371)***
(0.903)
(0.363)**
fta
-0.314
-0.213
-0.151
-0.014
-0.0064
0.001
(0.088)***
(0.100)***
(0.103)
(0.121)
(0.113)
(0.118)
ccp
-0.582
-0.526
-0.596
-0.396
-0.311
-0.256
(0.062)***
(0.094)***
(0.0631)***
(0.091)***
(-0.071)***
(-0.082)***
n R2 Chi2
1220 0.994 260515***
1220 0.973 125176***
1220 0.993 741773***
1220 0.972 85734***
1220 0.993 102395***
1220 0.971 94583***
1220 0.995 876370
1220 0.971 94583***
1220 0.995 1.41e+06***
1220 180 373799***
1001 0.994 1.24e+06***
1002 0.983 497073***
yr* cp*
yes yes
yes no
yes yes
yes no
yes yes
yes no
yes yes
yes no
yes yes
yes no
yes yes
yes no
Note: All regressions carried out using Prais-Winsten Regression with Panel-specific AR(1) and Correlated Panels Corrected Standard Errors. Standard errors in parentheses. * significant at 10%; ** significant at 5%; *** significant at 1%. Estimated using STATA Version 8. Dependent variable - log of total trade between Poland and partner i (in constant USD from 2000). Total number of observations (n). t-Student statistics under coefficients.
12
Figures Figure 1 Dynamics of exports, imports and total trade volume of Poland 1999-2006 (million USD, constant 2000 prices) 225000 Imports
Exports
Total trade volume
200000
175000
150000
125000
100000
75000
50000
25000
0 1999
2000
2001
2002
2003
2004
2005
2006
Source: Own calculations based on COMEXT data base. Figure 2 The volume of trade with EU(million USD, constant 2000 prices) and share of the EU in total Polish trade volume 90000
100,0 Share in total imports Share in total exports
90,0
80000
Volume of imports
70000
Share in total imports/exports
70,0 60000 60,0 50000 50,0 40000 40,0
Volume of importx/exports with EU
volume of exports
80,0
30000 30,0 20000
20,0
10000
10,0
0,0
0 1999
2000
2001
2002
2003
2004
2005
2006
Source: Own calculations based on COMEXT data base.
13
Appendix A. The list of trade partners of Poland included in the econometric estimation of the trade gravity model ALBANIA ALGERIA ANGOLA ANTIGUA ARGENTINA ARMENIA ARUBA AUSTRALIA AUSTRIA AZERBAIJAN BAHAMAS BAHRAIN BANGLADESH BELARUS BELGIUM BELIZE BENIN BHUTAN BOLIVIA BOSNIA-HERZEGOVINA BOTSWANA BRAZIL BRUNEI BULGARIA BURKINA FASO BURUNDI CAMBODIA CAMEROON CANADA CAPE VERDE CENTRAL AFRICAN REP. CHAD CHILE CHINA COLOMBIA COMOROS CONGO Congo, DEM REP of COSTA RICA CROATIA CYPRUS CZECH DENMARK DJIBOUTI DOMINICA DOMINICAN ECUADOR EGYPT EL SALVADOR EQUATORIAL GUINEA ERITREA ESTONIA ETHIOPIA FIJI FINLAND FRANCE GABON GAMBIA GEORGIA GERMANY GHANA
GREECE GRENADA GUATEMALA GUINEA GUINEA-BISSAU GUYANA HAITI HONDURAS HONG KONG HUNGARY ICELAND INDIA INDONESIA IRAN IRAQ IRELAND ISRAEL ITALY IVORY COAST JAMAICA JAPAN JORDAN KAZAKHSTAN KENYA KIRIBATI KOREA, SOUTH KUWAIT KYRGYZ REPUBLIC LAOS LATVIA LEBANON LESOTHO LIBERIA LIBYA LITHUANIA LUXEMBOURG MACAO MACEDONIA MADAGASCAR MALAWI MALAYSIA MALDIVES MALI MALTA MARSHALL ISLANDS MAURITANIA MAURITIUS MEXICO MICRONESIA MOLDOVA MONGOLIA MOROCCO MOZAMBIQUE NAMIBIA NEPAL NETHERLANDS NEW ZEALAND NICARAGUA NIGER NIGERIA NORWAY
OMAN PAKISTAN PANAMA PAPUA NW GUINEA PARAGUAY PERU PHILIPPINES PORTUGAL PUERTO RICO ROMANIA RUSSIA RWANDA SAN MARINO SAO TOME SAUDI ARABIA SENEGAL SERBIA AND MONTENEGRO SEYCHELLES SIERRA LEONE SINGAPORE SLOVAK REPUBLIC SLOVENIA SOLOMON ISLANDS SOUTH AFRICA SPAIN SRI LANKA ST, KITTS ST, LUCIA ST, VINCENT SUDAN SURINAME SWAZILAND SWEDEN SWITZERLAND SYRIA TAJIKISTAN TANZANIA THAILAND TIMOR, EAST TOGO TONGA TRINIDAD AND TOBAGO TUNISIA TURKEY TURKMENISTAN UGANDA UKRAINE UNITED ARAB EMIRATES UNITED KINGDOM UNITED STATES URUGUAY UZBEKISTAN VANUATU VENEZUELA VIETNAM WEST BANK YEMEN ZAMBIA ZIMBABWE
14
Appendix B. Definitions and basic statistics of variables utilized in the empirical model Definition, characteristics and Variable Obs. Mean Std. Dev. Min source Common border with Poland, 1442 0,034 0,181 0,000 border dummy variable Common Commercial Policy, Partner Country under CCP after 2004 1442 0,252 0,435 0,000 ccp accession of Poland to the EU, dummy variable Membership in CEFTA, dummy 1442 0,022 0,147 0,000 cefta variable Log of the size of Polish migrant 1442 4,265 4,315 0,000 diasp community Log of distance between Warsaw and 1442 8,432 0,910 5,969 distance foreign capital city, Google Earth FTA area with EFTA (EEA), dummy 1442 0,015 0,120 0,000 efta variable FTA with/within EU, dummy 1442 0,085 0,279 0,000 eu variable Exchange rate volatility, standard deviation of average monthly 0,039 0,017 0,014 exchange rate from the mean in year 1400 exvol t, own calculations based on NBP data Bilateral FTA with Poland, dummy 1442 0,018 0,133 0,000 fta variable Log of real GDP, constant 2000 1240 23,162 2,382 17,621 lngdp USD, WDI2007 Log of real GDP per capita, constant 1227 7,573 1,592 4,409 lngdppc 2000 USD, WDI2007 log of population, WDI2007 1337 15,415 2,084 10,240 lnpop Poland, log of real GDP, constant 1442 25,913 0,062 25,826 pllngdp 2000 USD, WDI2007 Poland, log of real GDP per capita, 1442 8,451 0,065 8,355 pllngdppc constant 2000 USD, WDI2007 Poland, log of total population, 1442 17,461 0,004 17,457 pllnpop WDI2007 Political stability, Kaufmann D. et al. 1071 -0,016 0,990 -2,870 polstab (2007) Rule of law, Kaufmann D. et al. 1153 -0,015 0,995 -2,310 roflaw (2007) Log of total trade with partner i, in constant 2000 USD, adjusted 1382 16,161 3,471 2,857 tt COMEXT Source: Own calculations in STATA 8.0.
Max 1,000
1,000
1,000 16,176 9,781 1,000 1,000
0,111
1,000 30,033 10,863 20,989 26,014 8,557 17,470 1,770 2,280 24,610
15
References Aitken, N. (1973) The effect of the EEC and EFTA on European trade: A temporal cross-section analysis, American Economic Review, Vol. 63, pp. 881–892. Bergstrand, J. (1989), The Generalized Gravity Equation, Monopolistic Competition, and the FactorProportions Theory of International Trade, Review of Economics and Statistics, Vol. 23, pp. 143-153. Carrere C. (2006), Revisiting the effects of regional trade agreements on trade flows with proper specification of the gravity model, European Economic Review, Vol. 50, pp. 223–247. Cieślik A. (2007), The Impact of Free Trade Agreements on Poland’s Foreign Trade in 1992-2004, Bank i Kredyt, Vol. 6/2007. Egger P. (2002), An Econometric View on the Estimation of Gravity Models and the Calculation of Trade Potentials, World Economy, Vol. 25(2), pp. 297 – 312. Egger P., Pfaffermayr M. (2003), The proper panel econometric specification for the gravity equation: A three-way model with bilateral interaction effects, Empirical Economics, Vol. 28 (3), pp. 571–580. Egger P. (2005), Alternative Techniques for Estimation of Cross-Section Gravity Models, Review of International Economics, Vol. 13, pp. 881-891. EUROSTAT (2007), Intra and Extra EU Trade Statistics, COMEXT, Brussels. Feenstra Robert C. (2004), Advanced International Trade, Princeton University Press, Princeton, pp. 146 – 149. Frankel J. Rose A. K. (2002), An Estimate of the Effect of Common Currencies on Trade and Income, The Quarterly Journal of Economics, Vol. 117(2), pp. 437-466. Glick R., Rose, A.K. (2002), Does a currency union affect trade? The time-series evidence, European Economic Review, Vol. 46 (6), pp. 1125–1151. Groot de, H. et al. (2004), The Institutional Determinants of Bilateral Trade Patterns, Kyklos, Vol. 57 (1), pp. 103 – 123. Helpman E. (1987), Imperfect Competition and International Trade: Evidence from Fourteen Industrial Countries, Journal of the Japanese and International Economies, Vol. 1, pp. 62-81. Kaufmann D. et al. (2007), Governance Matters IV: Governance Indicators for 1996-2004, Word Bank Paper WPS 3630. Matyas L. (1997), Proper econometric specification of the gravity model, World Economy, Vol. 20, pp. 363–368. Marques H. (2008), Asymmetries in Heterogeneous Integrated Areas: Evidence from Intra-EU Sectoral Trade, paper presented at 2008 EEFS conference in Prague. Papazoglou Ch. et al. (2006), A Gravity Model Forecast of the Potential Trade Effects of EU Enlargement: Lessons from 2004 and Path-dependency in Integration, World Economy, pp. 10771089. Rose, A.K. (2000), One money, one market: Estimating the effect of common currencies on trade, Economic Policy , Vol. 20, pp. 7–45. Rose, A.K. (2001), Currency unions and trade: The effect is large, Economic Policy, Vol. 33, pp. 449– 461. Tinbergen J. (1962), Shaping the world economy: suggestions for an international economic policy, Twentieth Century Fund, New York. World Bank (2003), World Development Indicators 2007, World Bank, Washington DC.
16