Brazil´s Foreign Trade and CNI´s Agenda Diego Bonomo Executive Manager Foreign Trade Unit – CNI
[email protected]
International Area
Foreign Trade Unit
International Negotiations
• Trade-related services
• Trade agreements agenda
• Trade policy and trade facilitation
• Services agenda for manufacturing competitiveness
• Business diplomacy • International relations • International cooperation
• Brazilian investments abroad • Trade remedies
International Business Centers
•
International Business Centers Network: Promotes Brazilian companies internationalization by offering trade-related services.
•
Presence in all 27 Brazilian states.
•
Since 1998.
•
Network composed by 305 analysts and experts.
•
More than 15,000 products and services were delivered in 2013.
International Business Centers Services to Foster Foreign Trade •
Business Training
•
Commercial Intelligence
•
Business Promotion
•
Internationalization Programs
•
Certificate of Origin
•
Consultancy and Advisory Services
•
ATA Carnet Emission
•
Support to Foreign Investors
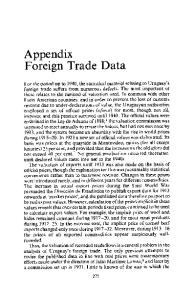
Trade Balance Brazil`s Trade Balance US$ billion 197,9
73,2
118,5
96,7
48,3 24,9
2003
62,8
73,6
33,8
44,9
2004
160,6
137,8
2005
173,0
120,6
201,9 181,8 153,0
256,0 226,2
242,2 242,6 239,6 223,2
127,7
91,4 46,5
40,0
2006
2007 Exports
Total imports by partner (2013)
25,0 2008 Imports
25,3 2009
20,1 2010
2011
19,4 2012
2013
Total exports by partner (2013) China 19%
USA 15%
USA 10%
Others 50%
Argentina 7% South Korea 4%
Nigeria 4%
2,6
Trade balance
China 16% Other 48%
29,8
Germany 6%
Germany 3%
Japan 3%
Argentina 8% Netherlands 7%
Manufactured Goods Trade Balance Brazil`s Trade Balance US$ billion
184,8 150,8
132,5 39,8 37,8
53,1 47,7
2,0 2003
65,4 56,8
75,0 69,9
8,6
5,4 2004
83,9
2005
93,2 92,7
5,1
-9,2
2006
2007
Exports
Manufactured Imports by partners (2013) Other 42%
Japan 4% South Korea 5%
67,3
2008
-39,8
Imports
103,8 79,6
2009
-36,5
92,3
2010
-71,2
93,1
90,7
2011
2012
USA 17%
Germany 7% Argentina 7%
2013
-94,2
-92,5
-105,0
Trade balance
Manufactured exports by partners (2013)
China 18%
198,1
184,9
Other 49%
Argentina 19%
USA 14%
Netherlands 9% Mexico 4%
Panama 5%
Trade balance – partners (2013)
Trade Balance - Total
Trade Balance – Manufactured Goods
Netherlands
Netherlands
15,0
China
8,7
5,7
Panama
4,4 4,1
Middle East
3,6
Argentina
Argentina
3,2
Africa
-0,3
Japan
0,9
Middle East
-1,2
United Kingdom
0,5
Switzerland
-1,7
Chile
0,2
Mexico
-1,9
United Kingdom
-2,0
Spain
-0,9
Mexico
Spain
-1,6
Italy
-2,6
-3,6
France
-5,5
France
-3,1
Italy
-5,7
European Union
-3,1
India
-5,8
India
-3,2
Japan
-6,1
South Korea
South Korea
-4,8
Africa
Germany
-6,4
Germany
-8,6
United States
Nigeria
-8,8
European Union
United States
*US$ billion
-20,0
China
-11,3 -10,0
-8,9
0,0
10,0
20,0
-12,2 -19,8 -31,0 -34,8
-40,0
-30,0
-20,0
-10,0
0,0
10,0
Brazilian trade by products
Brazilian exports by main products and groups - 2013 Description US$ Billions Part.(%) Primary goods 113.0 100.0 Iron ore 32.5 28.7 Soybean 22.8 20.2 Crude Oil 13.0 11.5 Semi manufactured goods 30.5 100.0 Sugar Cane 10.0 32.9 Pulp 4.7 15.4 Semimanufactured goods of iron or steel 3.8 12.6 Manufactured goods 93.1 100.0 Automobiles 5.5 5.9 Airplanes 3.8 4.1 Auto parts 3.3 3.6
Brazilian Imports by main products and groups - 2013 Description US$ Billions Part.(%) Primary goods 33.3 100.0 Crude oil 16.3 49.0 Natural gas 3.9 11.6 Wheat 2.4 7.2 Semi manufactured goods 8.2 100.0 Potassium chloride 3.3 40.6 Copper cathode 1.8 22.2 Syntetic rubber 0.7 8.7 Manufactured goods 198.1 100.0 Automobiles 9.1 4.6 Auto parts 8.3 4.2 Medicines for humans and animals 6.7 3.4
Source: Secex/MDIC.
Manufactured goods 39% Primary goods 48%
Semimanufaturados 13%
Semi manufactured goods 3%
Primary goods 14%
Manufactured goods 83%
Investments in Brazil
The largest part of the FDI Stock in 2010 was directed to services (44%) and manufacturing (40%) FDI Stock by Final investor partner - 2010 Country USA Spain Belgium United Kingdom France Germany Japan Italy Mexico Netherlands Canada Total Source: BACEN
US$ billion 109.7 85.4 50.3 41.6 30.7 30.4 29.0 18.2 15.7 14.9 14.4 541.0
Part% 20.3% 15.8% 9.3% 7.7% 5.7% 5.6% 5.4% 3.4% 2.9% 2.8% 2.7% 100.0%
According to the last UNCTAD data, in 2012, Brazil was the 4th country with the largest influx of FDI in the World
Brazilian investments abroad Brazilian multinational investments abroad by location South america
53
NAFTA EU
Brazilian Investments Stock: Description Agriculture, livestock and mineral mining Metalic mineral mining Oil and gas extraction Industry Metallurgy Food Non-metallic mineral products Chemical products Sevices Financial services Infraestructure services Total Fonte: BACEN
35
Africa
2012 US$ billion 61.9 42.8 12.3 44.7 15.2 16.9 8.1 0.7 140.5 97.9 4.3 247.2
19
% 25.1 17.3 5.0 18.1 6.1 6.8 3.3 0.3 56.9 39.6 1.7 100
17
Other Asian
10
Other
8
China
8
Middle East
4
Agenda on Trade and Investment Policies
1. Trade Agreements
2. Trade Facilitation 3. Brazilian Investments Abroad 4. Trade in Services 5. Other Trade Policy Issues
1. Trade Agreements CNI supports deeper integration of Brazil to the world economy through trade agreements. For CNI, Brazil should have a multifaceted strategy, covering bilateral, regional and multilateral agreements (WTO DDA). Agenda and Suggestions Multilateral: reduce agricultural and industrial subsidies, non tariff barriers, improve trade remedies agreements, eliminate export restrictions and others; Regional: deepen agreements, including non tariff measures, services, investments, procurement. Foster energy and infrastructure agenda; Bilateral: negotiate agreements with countries outside the region. The priority is the European Union – Mercosul Agreement.
2. Trade Facilitation TF policies are crucial to reduce export and import clearance and release time. CNI priority is to implement the provisions of the recently approved WTO Trade Facilitation Agreement.
Agenda and Suggestions Single Window: harmonize and integrate customs-related agencies procedures to increase efficiency and decrease costs and time. Imports currently take around 17 days and exports 13 days;
Authorized Economic Operators: implement Brazil´s mechanism to include more companies and to harmonize with other countries’ mechanisms;
3. Brazilian Investments Abroad Investing abroad contributes to increase Brazilian exports, innovation and companies´ productivity. CNI developed an ambitious agenda in this area that covers four topics: taxation, finance, diplomacy and innovation. Agenda and Suggestions Taxation: improve Brazil´s multinational companies profit tax regime and celebrate more Bilateral Tax Treaties (Brazil has only 29 agreements); Economic Diplomacy: increase diplomatic support to Brazilian companies abroad to reduce investment barriers and celebrate Bilateral Investment Treaties.
3. Brazilian Investments Abroad Brazilian Multinational Companies Priorities (CNI´s Survey of 2013) Bilateral Tax Treaties Country United States Australia Colombia Germany Russia Venezuela Paraguay United Kingdom Switzerland Uruguay Angola Saudi Arabia Singapore United Arabic Emirates Guinea Mozambique
Companies 13 4 4 3 3 3 2 2 2 2 1 1 1 1 1 1
Bilateral Investment Treaties Country / Region South America NAFTA China Africa Germany Russia India Australia Turkey Indonesia
Companies 25 12 5 5 2 2 2 1 1 1
4. Trade in Services Services have a growing importance for manufacturing competitiveness in Brazil. Services represent around 55% of industrial production valueadded and 40% of Brazil´s exports value-added.
Agenda and Suggestions
Services agreements: engage in multilateral, regional (South and Latin America), bilateral and plurilateral services agreements aiming specifically at the liberalization of strategic services for the manufacturing sector. Services imports: reduce tax burden on services imports in Brazil, currently around 50%.
5. Other Trade Issues CNI has also an internal agenda to reform some of the Brazilian trade support instruments. Some of the main areas are: institutional reform, trade finance and tax credits.
Agenda and Suggestions Trade Court: establishment of specialized trade courts in Brazil. Tax credits and trade finance: improve guarantees for trade finance to enable more companies to use public credit, and accelerate tax restitution.