DEPARTMENT OF ECONOMICS ISSN 1441-5429 DISCUSSION PAPER 03/13
Export-Led Growth in Cambodia: An Empirical Study Tuck Cheong Tang and Chea Ravin
Abstract: The study examines the export-led growth (ELG) hypothesis for Cambodia. The sample covers annual observations between 1972 and 2008. The Granger’s non-causality tests support ELG as well as the growth-led exports. Also, there is causality from imports growth to exports growth. The study also presents the results of impulse response functions and variance decomposition. Some policy implications are viewed in the study. Key words: Cambodia; Exports; Imports; Growth JEL codes: E2; F4
Tuck Cheong Tang, Monash University Sunway campus Chea Ravin, National Bank of Cambodia (NBC)
© 2013 Tuck Cheong Tang and Chea Ravin All rights reserved. No part of this paper may be reproduced in any form, or stored in a retrieval system, without the prior written permission of the author.
1
1.
Introduction
Cambodia, a trnsition economy which is classified as a low-income developing country (UNCTAD, Handbook of Statistics 2009) has undergone through different stages of economic reforms during the past two decades – from a command economy in the late 1980s to a free market economy. Cambodia jointed the AFTA (ASEAN Free Trade Agreement) which requires for reduction of tariff rates on imported goods from ASEAN members improving market access in the region. In addition, Cambodia became a member of WTO (World Trade Oragnization) in 2003 with a view to fostering its integration into the world economy in order to achieve higher growth, poverty reduction and sustainable development. Between 1998 and 2007, Cambodia demonstrated remarkable average annual economic growth of about 10 percent. The expansion was driven largely by rapid export growth (exports from textile and garment industry), which increased dramatically from 16 percent of GDP in 1993 to 60 percent of GDP in 2009. Cambodia’s traditional export markets are comprised of the U.S., the European Union, Singapore, Thailand and Malaysia. Cambodia’s Trade Integration Strategy in 2007, identified 19 products and services such as garments, footwear, rice, cassava, rubber, fish, cashew nuts, silk, soybeans, corn, woood products, light manufacturing, and tourism those to have export potential.1 In 2004, Cambodia’s imported 79.3% of manufactures, 10% for fuel and 8% for food, while exporting 97% of manufactures with economic growth rate of 10.3%.2 Cambodia’s trade policies are aimed to implement an export-led growth (ELG) approach, a standard model of development through rapid liberalization and further integration into the global economy.
The ELG strategy considers the need to attract
investment to the major ‘growth poles’ - Phnom Pehn, Siem Reap and Sihanoukville, and in rural areas, that may translate into accelerated poverty reduction in the context of overall sector and economy wide poverty reduction strategies.3
The objective of this study is to examine the causal relationship between exports and economic growth in Cambodia, by the mean of ELG hypothesis. A bulk of empirical studies of ELG is available and well-documented in the literature. For example, (Giles & Williams, 2000a) (2000b) surveyed more than 150 ELG studies, and they also re-examined the ELG for Portugal and Canada with the robustness of the method adopted to deal with non-stationarity. 1
Box 1.6: Export Diversification Strategy: The Case of Cambodia. http://www.undp.org/content/dam/undp/library/Poverty%20Reduction/Inclusive%20development/Towards%20 Human%20Resilience/Towards_SustainingMDGProgress_Chapter1.pdf Accessed: 14 September 2012. 2 The figures are taken from the World Tables, World Bank. 3 http://www.cdc-crdb.gov.kh/cdc/ngo_statement/trade_policy_62.htm
2
The results of error-correction model (ECM) from (Mah, 2005) support long-run causality between export and growth for China. But, bivaraite ELG framework such as (Mah, 2005) may be misspecified. According to (Riezman, Whiteman, & Summers, 1996), the imports variable is an important variable in the causal relationship between exports and economic growth and the failure to include it in the test could lead to a biased conclusion – the role of imports is mainly intermediate inputs in exports. For an economy that depends on export promotion for its growth process, imports are important in restoring external imbalances to its sustainable steady-state path. (Tang, 2006) re-examined (Mah, 2005)’s study by adding imports as additional variable in a trivariate framework for causality between exports and economic growth in China – no long-run relationships among exports, real GDP and imports, but economic growth does Granger-cause imports in the short run for the period 1970-2001 (yearly data). From the literature survey on ELG, no study is available for the case of Cambodia. A relevant study by (Tang & Wong, 2011) found causal relationship between inward FDI, exports and imports of merchandise as well as services in Cambodia. An inward FDI not only can promote both merchandise and services exports but also indicate the presence of backward and forward linkages, which could result in positive externalities. But, the study does not examine the ELG hypothesis.
Hence, the present study contributes to the existing literature by exploring empirically the causal relationship between exports, imports and growth in Cambodia. Also, the bilateral causal relationship between exports and growth supports the ELG - it may provide an insight to policymakers on its feasibility.
2.
Data and methods
The data used in this study are annual from 1972 to 2008 obtained from World Tables, World Bank.4
The three candidate variables are real GDP (Y), real exports (X), and real imports
(M).5 The data are measured in local currency (Riels) in millions and they have been 4
The quarterly data are available from 2002Q1 to 2007Q4 as obtained from the relevant official databases that such a short sample span is not feasible for the present study. 5 The raw data of GDP, exports and imports are obtained from the World Tables, World Bank. The nominal variables are deflated by GDP deflator - the nominal GDP divided by real GDP then multiplying 100. The nominal GDP is not available for the period 1975-1986. Hence, the GDP deflator for those periods has been constructed by Purchasing Power Parity (PPP) assumption, e = pf/pd, where e is nominal exchange rate, and pf and pd are foreign and domestic price, respectively. The relevant variables (e, pf and pd) are available from the Penn World Table 6.2. The data including its construction are available from the corresponding author upon request.
3
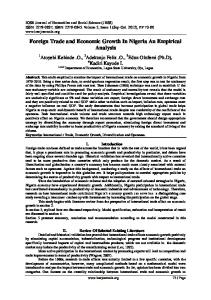
transformed into natural logarithmic form. Visual inspection from Figure 1 shows that the three variables are co-moving after 1985 with a rapid growth of exports and imports (goods and services). However, the Cambodian trade balance is in deficits over the observed period. The augmented Dickey-Fuller (ADF) and Phillip-Perron (PP) unit root tests are reported in Table 1. More consistently, the Phillip-Perron (PP) tests suggest the three variables are firstdifferenced stationary or I(1). The Engle-Granger tests suggest two cointegrating relations.6 20
16
12
8
4
0 1970
1975
1980
1985
1990
1995
2000
2005
Real GDP Real exports Real imports
Figure 1 Plots of GDP, Exports and Imports for the Period 1972-2008
Table 1 Unit root tests lnY ∆lnY lnX ∆lnX lnM ∆lnM
ADF tests -2.743 [2] (0.227) -1.750 [1] (0.399) -2.245 [9] (0.449) -4.162*** [0] (0.0024) -1.931 [0] (0.619) -1.552 [9] (0.493)
PP tests -1.953 [4] (0.607) -2.619* [3] (0.098) -2.536 [4] (0.310) -4.151*** [2] (0.003) -2.138 [4] (0.509) -5.706*** [4] (0.000)
Notes: ln is natural logarithmic form. The unit root equations include a constant and time term for the data in levels, but only constant for the data in first differences. A maximum lag of 9 is considered for ADF tests with Akaike information criterion [.], while the value of [.] in the PP tests is bandwidth Newey-West automatic using Bartlett. ***, ** and * indicate the significance level of 1%, 5% and 10%, respectively.
6
The p-values of tau-statistics for these two relations lnM –lnX –lnY, and lnX –lnM –lnY are 0.015 and 0.035, respectively. The other relation lnY –lnM –lnX has a large p-value of the Engle-Granger’s tau-statistic, 0.320 suggesting non-cointegration.
4
Given the non-stationarity of the variables (lnY, lnX and lnM), the VAR(d) for the Granger’s non-causality specifications will be estimated with variables in first-differenced as in equations (1)-(3). Two dummy variables are taken into account – KHMER (value one for 1975-1979 but value zero for other years) for the Khmer Rouge period (1975–1979) refers to the Khmer Rouge Communist party over Cambodia; and AFTA (value one for 1999-2008, and value zero otherwise) that captures the Cambodia’s entry into the ASEAN Free Trade Area (AFTA) in 1999 offers substantial potential for its integration with international economies (Huot & Kakinaka, 2007). It is to say, for equation (1), the exports growth (∆lnX) does Granger-cause economic growth (∆lnY) if the sum of βl statistically significant. And, the statistical significance of coefficients γl reflects causality from imports (∆lnM) to growth (∆lnY). Similar interpretations are applied to equations (2) and (3).
(1)
(2)
(3)
3.
Empirical Results
The computed statistics of final prediction error, Akaike information criterion, Schwarz information criterion and Hannan-Quinn information criterion consistently suggests one lag, VAR(1) from a maximum lag of 3 years. The estimated parameters of equations (1)-(3) are reported in Table 2. Figure 2 virtualizes the directions of (short-run) causality among exports, imports and economic growth. A bilateral causal relationship is supported between exports and economics growth. The export-led growth hypothesis is hold for Cambodia as well as the growth-led exports. The results also show the causality from the growth of imports to exports but in a negative sign – demand for imports depresses the exports (in the short-run). The estimated long-run import-elasticity to exports is 0.43 that 1% increase in imports,
5
Cambodia’s exports will be at an additional roughly 0.43%.7 Cambodia’s exports are partially manufactured by imported inputs (such as raw materials, intermediate goods, and physical and human capitals). It is also interesting that no (short-run) causality from the growth of exports to imports (Equation 3, Table 2). But, its [export] elasticity to imports is 0.68; a rise in exports increases imports by 0.68% in the long-run (see footnote 7). It shows that Cambodia is dependent on imported inputs for producing exports - more exports will drive imports. Table 2 VAR – Trivariate Framework VAR(1) ∆lnMt-1 ∆lnXt-1 ∆lnYt-1 KHMER AFTA Constant R-squared F-statistic
Equation (1) (∆lnYt) -0.047 (0.584) 0.190* (0.063) 0.297 (0.151) -0.273* (0.079) -0.143 (0.177) 0.172** (0.022) 0.536 7.153 (0.000)
Equation (2) (∆lnXt) -0.549*** (0.002) 0.497** (0.015) 0.987** (0.017) -0.225 (0.447) -0.263 (0.202) 0.299** (0.039) 0.548 7.505 (0.000)
Equation (3) (∆lnMt) -0.480** (0.046) 0.351 (0.202) 0.530 (0.342) -0.876** (0.04) -0.406 (0.161) 0.508** (0.014) 0.289 2.516 (0.05)
Notes: (.) denotes the p-value. ***, ** and * indicate the significance level of 1%, 5% and 10%, respectively.
Figure 3 is about the graphical presentation of the impulse response analysis in VAR(1). The first panel shows the response of import growth rate to a unit impulse in its own growth rate, exports and economic growth – the import growth respond quickly (negatively) to its own shock, but positively to a shock in exports or economic growth until 2 years then returning to equilibrium in year 3. A shock of imports has a negative impact on export growth rate until 2 years, then a positive response from 2 – 3 years. The economic growth responses negatively to a shock of exports, imports and its own shock (last panel) approaching the equilibrium.
Exports
Economic Growth
(∆lnXt)
(∆lnYt)
7
Imports
The OLS estimated long-run relations of exports and imports are lnXt = -10.5 +0.43lnMt +1.14 lnYt + εt, and (∆lnMt) + e , respectively. Most of the estimated parameters are statistically lnMt = -1.41 +0.68lnXt +0.40lnY t t significance at 10% level.
6
Figure 2 Short-Run Causality between Exports, Imports and Economic Growth
The results of variance decomposition analysis are tabulated in Table 3. The import growth is almost 90%, explained by its own. But, the import growth rate explains 28% of export growth in the years, but around 8% of export growth by the unanticipated change in the Cambodian economic growth. The growth is mainly contributed by the unanticipated change in exports (44%), its own growth (31%) and imports (25%) over the periods.
4.
Concluding Remarks
This study finds empirical support of a bilateral causal relationship between exports and growth in Cambodia, supporting both ELG and growth-led exports (GLE) hypotheses. Meanwhile, the causal relationship is also running from imports growth to exports growth. For policy implication, sustainable export promotion policies should consider the relevant trade policies on imports, in particular imported inputs for producing more output for global market. By the same token, the support of GLE hypothesis suggests that export oriented policies are appropriate in making Cambodia grew and economic prosperity.
7
Res pons e of DM to Choles k y One S.D. Innovations .8 .6 .4 .2 .0 -.2 1
2
3
4
5
DM
6
7
DX
8
9
10
9
10
9
10
DY
Res pons e of DX to Choles k y One S.D. Innovations .4 .3 .2 .1 .0 -.1 1
2
3
4
5
DM
6
7
DX
8 DY
Res pons e of DY to Choles k y One S.D. Innovations .20 .16 .12 .08 .04 .00 1
2
3
4
5
DM
6 DX
7
8 DY
Figure 3 Impulse Response Functions from Trivariate VAR Notes: DM = ∆lnM, DX = ∆lnX, and DY= ∆lnY
8
Table 3 Variance Decomposition of Exports, Imports and Economic Growth Variance Decomposition of ∆lnM: Period S.E. ∆lnM 1 0.706 100.0 2 0.755 91.1 3 0.764 90.0 4 0.768 89.2 5 0.769 89.0 6 0.770 88.8 7 0.770 88.8 8 0.770 88.7 9 0.770 88.7 10 0.770 88.7 Variance Decomposition of ∆lnX: 1 0.504 43.4 2 0.628 29.7 3 0.663 29.4 4 0.677 28.3 5 0.683 28.0 6 0.686 27.8 7 0.687 27.8 8 0.687 27.8 9 0.688 27.7 10 0.688 27.7 Variance Decomposition of ∆lnY: 1 0.259 30.1 2 0.296 29.0 3 0.312 26.4 4 0.318 25.8 5 0.321 25.5 6 0.322 25.3 7 0.322 25.3 8 0.322 25.3 9 0.322 25.2 10 0.322 25.2
∆lnX 0.0 7.6 8.4 9.0 9.2 9.4 9.4 9.4 9.4 9.4
∆lnY 0.0 1.3 1.6 1.8 1.8 1.8 1.8 1.9 1.9 1.9
56.6 63.6 63.0 63.7 63.8 63.9 63.9 63.9 64.0 64.0
0.0 6.7 7.6 8.0 8.2 8.3 8.3 8.3 8.3 8.3
29.2 37.1 41.2 42.4 43.0 43.2 43.3 43.3 43.4 43.4
40.7 33.9 32.4 31.8 31.5 31.5 31.4 31.4 31.4 31.4
Notes: Cholesky Ordering: ∆lnM ∆lnX ∆lnY Standard Errors: Monte Carlo (100 repetitions)
9
References Engle, R. F., & Granger, C. W. (1987). Cointegration and error correction: Representation, estimation, and testing. Econometrica , 55 (2), 251-276. Giles, J. A., & Williams, C. L. (2000a). Export-led growth: a survey of the empirical literature and some non-causality results. Part 1. Journal of International Trade and Economic Development , 9 (3), 261-337. Giles, J. A., & Williams, C. L. (2000b). Export-led growth: a survey of the empirical literature and some non-causality results. Part 2. Journal of International Trade and Economic Development , 9 (4), 445-470. Huot, N., & Kakinaka, M. (2007). Trade structure and trade flows in Cambodia: a gravity model. ASEAN Economic Bulletin , 24 (3), 305-319. MacKinnon, J. (1996). Numerical distribution functions for unit root and cointegration tests. Journal of Applied Econometrics , 11 (6), 601-618. Mah, J. S. (2005). Export expansion, economic growth and causality in China. Applied Economics Letters , 12 (2), 105-107. Osterwald-Lenum, M. (1992). A note with quantiles of the asymptotic distribution of the maximum likelihood cointegration rank test statistics. Oxford Bulletin of Economics and Statistics , 54 (3), 461–472. Riezman, R., Whiteman, C. H., & Summers, P. M. (1996). The engine of growth of its Handmaiden? a time-series assessment of export-led growth. Empirical Economics , 21 (1), 77-110. Tang, T. C. (2006). New evidence on export expansion, economic growth and causality in China. Applied Economics Letters , 13 (12), 801-803. Tang, T. C., & Wong, K. N. (2011). Foreign direct investment, merchandise and services trade in a transition economy: the case of Cambodia. International Economic Journal , 25 (2), 251-267.
10