International Research Journal of Finance and Economics ISSN 1450-2887 Issue 59 (2010) © EuroJournals Publishing, Inc. 2010 http://www.eurojournals.com/finance.htm
Tax Composition and Growth in Turkey: An Empirical Analysis Ibrahim Arisoy Department of Economics, Faculty of Economic and Administrative Sciences Cukurova University, 01330, Adana - Turkey E-mail:
[email protected] Tel: +90-322-3387254; Fax: +90-322-3387283 Ilter Unlukaplan Department of Public Finance, Faculty of Economic and Administrative Sciences Cukurova University, 01330, Adana - Turkey E-mail:
[email protected] Tel: +90-322-3387254; Fax: +90-322-3387283 Abstract The dominant view in the endogenous growth literature draws on the idea that direct taxation harms economic growth while indirect taxation does not. The object of this paper is to test the effect of direct-indirect tax composition on economic growth for the Turkish Economy for the period of 1968-2006 and to assess whether the choice between direct and indirect taxes is linked to the growth rate of the economy or not. The model in this analysis employs Feder model to investigate the relation between tax composition and growth in Turkey. In line with the predictions of the endogenous growth models, our findings suggest that the real output is positively related to indirect tax revenue but direct taxation has no significant effect. These results imply the positive effect of the transformation in the tax revenue composition on the economic growth during the involved period in Turkish Economy. Keywords: Tax composition, growth, direct tax, indirect tax, tax mix. JEL Classification Codes: D58, E01
1. Introduction The primary object of taxation is to finance public goods and services. Taxation is also used to promote other objectives such as fair distribution of income and wealth, efficient resource allocation and economic stabilization (Musgrave, 2006: 5-7). Taxes affect the optimal decisions formed by individuals and firms as well as saving and investment decisions therefore influencing the growth rate of the economy. Economic growth, based on the increased prosperity, can be achieved by the accumulation of physical as well as human capital and innovations which boost technological progress, thereby increasing input productivity and potential output level. The growth rate of the economy can also be altered by policy implementations through the effect that taxation has upon economic decisions. An increase in tax rates causes the return of both human capital and research & development expenditures to fall by dropping the rate of economic growth off (OECD, 2009b: 5).
International Research Journal of Finance and Economics - Issue 59 (2010)
51
Until the early 1990's, the literature on economic growth focused on modeling the economy with a long-run equilibrium where the output per capita is constant and technological progress is exogenous. By specifying the technological progress as exogenous, it is meant that the economic growth is determined outside the system and not affected by the government policy. Traditional Neoclassical growth models, or so-called exogenous growth models imply that taxation can affect only the output level but not the growth rate of the economy by putting forward that the output of an economy grows as a result of the increase in physical inputs such as capital and labor. The technological progress and the growth rate of the economy said to be “exogenous”. As stated by Solow (1970), the underlying fact behind this structure is that the Neo-classical view assigned the economic growth as a result of the increase in physical capital and labor where law of diminishing returns to scale is on duty. The instruments of government policy and non-physical variables such as human capital have no permanent impact on the growth rate of the economy in these models. Within this approach, growth in per capita output stems from exogenous technological progress and the magnitude the composition of tax revenue does not generate a permanent effect on output growth while generating only temporary “level” effects (Lee and Gordon, 2005: 1029). In this context, government’s tax policy has no role to promote growth in these models as active government policies, including tax policies generate only level effects corresponding to temporary growth. Endogenous growth theory emphasizes the endogenous determination of economic growth, rather than exogenous technological change. Tax policy in the endogenous growth models has dual properties. Not only it should intervene to correct the Non-Pareto optimality states but also it should pursue active policies to maintain long run economic growth. In endogenous growth models, not only the level of taxes but also the tax composition matters. The endogenous growth models classify taxation instruments into distortionary taxation, which discourages to invest in physical/human capital and non-distortionary taxation which does not affect the above incentives (Benos, 2009: 2). Any tax policy that distorts the capital accumulation will permanently reduce growth rate, i.e. direct taxes like personal income taxes and corporate income taxes. On the other hand, indirect taxes only distort intertemporal consumption choice while leaving capital accumulation and growth unchanged. According to these reflections, at the theoretical level, the predictions indicate that the tax composition matter for growth. The indirect taxes play a predominant role in Turkish Tax System; the indirect taxes as a percentage of total tax revenue have increased from 37.2 % in 1980 to 53.1% in 1985, 59.3% in 1995 and 68.7% in 2006. Considering the last decades, the composition of the tax revenue in Turkey critically relies on indirect taxation as opposed to direct taxation. This indicates a significant change in the tax burden from direct to indirect taxation (OECD, 2006: 6). The substantial share of indirect tax stems from specific consumption tax and value added tax. The main object of this paper is to investigate the relationship between tax composition and the growth in Turkey by specifying the relative dominancy of direct and indirect taxation. The paper is organized as follows: section 2 is devoted to explain the underlying structure behind the evolution of tax revenue composition in Turkey, section 3 gives an overview of the empirical works on tax composition and growth, section 4 reveals the empirical strategy, data, method and results of the study; section 5 concludes.
2. Tax Composition in Turkey Between 1965 and 2007, tax revenue as a percentage of GDP increased in Turkey. But, considering the first portion of this period, between 1965 and 1985, the share of tax revenue in GDP decreased from 9,9 % to 9,8 %. These values don’t indicate an increase in tax revenue in Turkey between 1965 and 1985. But, as stated by the figure 1, substantial increase in tax revenue that lasted until 2000 was initiated. The source of this increase was the value added tax (VAT), introduced in 1985. After the introduction of the VAT, tax revenue increased continuously until 2000. For the year 2000, the share of tax revenue in GDP reached to 19.6 % according to OECD Revenue Statistics. Between 2000 and
52
International Research Journal of Finance and Economics - Issue 59 (2010)
2007, measurable reductions in tax revenue were recorded: 18.8 % in 2005 and 18.6 % in 2007. With regard to OECD countries’ average, stable increase in the tax revenue as a percentage of GDP was observed, 20.9 % in 1965 and 26.7 % in 2007. These statistics indicate that tax revenue in Turkey is below the OECD averages. Figure 1: Tax Revenue in Turkey and OECD Countries, as a Percentage of GDP (1965-2007)
Source: OECD (2009a)
Table 1 compiles the share of taxes on income and profits, property taxes, taxes on goods and services in GDP for Turkey and OECD countries during the period 1965-2007. For this period, rise in taxes on income and profits and taxes on goods and services but fall in property taxes are observed. Moreover, the revenue generated from taxes on income and profits is below the OECD averages and has a decreasing trend, especially after 2000. As reflected by the table 1, after the introduction of VAT in 1985 and Specific Consumption Tax in 2002, revenue from taxes on goods and services steadily increased and reached 11,3 % of GDP, a value above the OECD average. Table 1:
Tax Revenue Components in Turkey and OECD Countries as Percentages of GDP (1965-2007)
Turkey OECD
1965 3,1 9
1970 3,1 10,2
1975 5 11,2
Turkey OECD
1965 1,1 1,9
1970 1 1,9
1975 0,8 1,7
1965 1970 5,7 4,6 Turkey 9,6 9,8 OECD Source: OECD (2009a)
1975 4,9 9,3
Taxes on Income and Profits 1980 1985 1990 6,9 4,3 5 11,9 12,2 12,9 Property Taxes 1980 1985 1990 0,7 0,5 0,3 1,6 1,7 1,9 Taxes on Goods and Services 1980 1985 1990 3,4 4,1 4,2 9,8 10,5 10,5
1995 4,8 12,4
2000 7,1 13,1
2005 5,3 12,8
2007 5,6 13,2
1995 0,5 1,8
2000 0,8 1,9
2005 0,8 1,9
2007 0,9 1,9
1995 6,3 11
2000 10,1 11,1
2005 12 11,2
2007 11,3 10,9
Table 2 displays the share of various tax components in total tax revenue, i.e tax structure, in OECD countries. Considering the direct/indirect tax composition, Personal Income Tax, Corporate Income Tax and Property Taxes are included in direct taxes while General Consumption Tax, Specific Consumption Tax and other taxes are included in indirect taxes. Our calculations imply that the share of direct taxes as a percentage of total tax revenue is 53 %, 58%, 56%, 55% and 57% for the time period in table 1. These values reverberate that the major part of tax revenue is acquired by the direct taxes in OECD countries.
International Research Journal of Finance and Economics - Issue 59 (2010)
53
Tax Structures in OECD Countries1 (1965-2007)
Table 2:
1965 32 11 10 15 30 2 100
Personal Income Tax Corporate Income Tax Property Taxes General Consumption Tax Specific Consumption Tax Other Taxes Total Source: OECD (2009a).
1975 40 10 8 17 23 2 100
1985 40 10 6 21 21 2 100
1995 36 11 8 24 18 3 100
2007 34 15 8 26 15 2 100
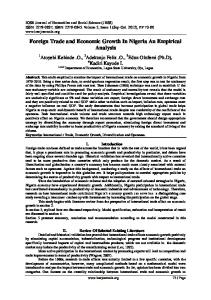
Figure 2 depicts the evolution of the direct and indirect taxes as a percentage of total tax revenue by rejoicing in the data compiled by table 2. According to the figure 2, indirect taxes are dominant in Turkish Tax System, As stated before, the share of indirect taxes have considerably been increased especially after the introduction of VAT and Specific Consumption Tax: 64.9 % in 1968, 62.4 % in 1970, 53.2 % in 1975, 37.2 % in 1980, 53.1 % in 1985, 59.3 % in 1995, 68.7 % in 2000, 66.3 % in 2002, 68.7% in 2006. Indirect tax reforms in Turkey play a substantial role in this increase. VAT system was introduced in Turkey in 1985, replacing eight indirect taxes. Other indirect policy reform in 2002 was introducing a unified Specific Consumption Tax replaced a range of indirect taxes on oil products, vehicles, alcohol and tobacco products and a range of luxury consumer goods into a one single tax. These results put forward a very important insight: In OECD countries, the relative share of direct tax revenue is high while in Turkish Tax System the indirect taxes play a predominant role. Indirect taxes constitute about 70 percent of the total tax revenues in Turkey (The European Union average is around 35 percent). Figure 2: The Evolution of Direct and Indirect Tax Revenue in Turkey (1968- 2008) 80 70 60 50 40
Direc t Tax es
30
Indirec t Tax es
20 10 0 1968
1973
1978
1983
1988
1993
1998
2003
Source: General Directorate of Budget and Fiscal Control (http://www.bumko.gov.tr)
3. Literature Review Since the seminal studies of Barro (1990), King and Rebelo (1990) and Lucas (1990), endogenous growth models extensively began to analyze the effects of fiscal policy on growth. The role of taxation in the long-run growth process has been central in public finance especially since the appearance of the endogenous growth models. In these models, economic growth has different responds to tax components. Indirect taxation does not affect individuals’ incentives to accumulate capital and therefore leaves growth unaffected. Direct taxation, on the other hand, is harmful to growth in nearly all endogenous growth models. These predictions, devoted to specifying the relationship between tax composition and growth, were tested by numerous empirical studies. But the consensus on the theoretical predictions becomes hold off when the results of empirical studies are considered. 1
The values are recalculated by subtracting social security contributions from total tax revenue.
54
International Research Journal of Finance and Economics - Issue 59 (2010)
Harberger (1964) shows a switch from direct to indirect taxation does not affect investment to such an extent to contribute to higher growth. Because, in the model the changes in direct/indirect tax composition do not affect the labor supply and investment enough, thereby negligible changes on the economic growth are observed. Hall (1968) develops a saving-consumption model including the property that changes in tax structure generate only temporary effects on economic growth. Based on the properties of NeoClassical Growth Model, the model indicates that the composition of tax revenue does not matter for economic growth. Following Harberger’s analysis of the interactions between tax policy, investment and growth, Mendoza et al (1995), use a panel of 18 OECD countries for the period of 1966-1990. Their findings point out that the changes in income taxation have more positive effects on growth than changes in capital income and consumption taxation. Another contribution by Mendoza et al (1997) highlights the fact of the significant effect of tax composition on private investment. But their empirical conclusion is that the tax composition has no significant effect on economic growth. Using cross-section data for 20 high and low income countries, Marsden (1983) finds negative correlation between tax to GDP ratio and economic growth. Moreover, results of the analysis conducted for both low – income and high income countries suggest a negative correlation for lowincome countries but not for high-income countries. Considering the components of tax revenue, only taxes on goods and services are negatively correlated with economic growth. Skinner (1988) uses the data of Sub-Sahara African countries for the period 1965-1982 and finds significant negative effect of personal income taxes on economic growth. The import, export and especially sales taxes exhibit only marginal effect on economic growth. In line with Skinner (1988), Easterly and Rebelo (1993) employ a cross-section analysis and find that in developing countries, marginal income tax rate and economic growth rate are significantly negatively correlated. Kneller et al (1999) test the growth effects of fiscal policy for a panel of 22 OECD countries during 1970-1995. The results indicate that the structure of taxation has important effects on economic growth: distortionary taxation reduces growth but non-distortionary taxation does not. Branson and Lovell (2001) estimate a combination of the tax burden and the tax composition which would maximize the economic growth by implying that such a change in the tax structure would generate nearly a 17% increase in real GDP for the New Zealand data covering the period of 1946-1995. In the specified tax composition, the weight of direct taxes is the 65% of the total tax revenue. Widmalm (2001) explores the relationship between tax composition and economic growth in 23 OECD countries for 1965-1990 within a pooled cross sectional data and finds taxes on corporate income has a positive, personal income taxes has a negative correlation with economic growth. The property taxes, taxes on wages and consumption taxes are considered to be fragile. By using the South African tax and economic data for the period of 1960-2002, Koch et al (2005), not only analyze the relationship between taxes and economic growth, but also analyze the effects of the ratio of indirect taxes to tax revenue on the economic growth. Contrary to the dominant view, their findings indicate an increase in indirect taxation relative to direct taxation reduces economic growth. Lee and Gordon (2005), explore the relationship between taxation and economic growth using both cross-sectional and time series data for 1970-1997. The findings suggest the negative effect of corporation income tax on economic growth. The other type of taxes in the model is not significantly associated with economic growth. Mamatzakis (2005) employs a VAR model to assess the respond of the economic growth to the shocks in the tax composition in Greece for the period of 1960-2003. The evidence of this study suggests the evidence of a positive impact of the tax mix (the ratio of indirect tax revenue to direct tax revenue) on the economic growth. By pointing out the fact that the specific fiscal policy tools, namely tax composition and the size of the government spending can alter the economic growth, de Wet et al. (2005), report that for the South African Economy, the economic growth is negatively affected by the increases in the public expenditures and direct tax revenue for the period of 1969-2003. Tosun and Abizadeh (2005), examine the changes in the tax composition of the OECD countries with respect to economic growth for 1980-
International Research Journal of Finance and Economics - Issue 59 (2010)
55
1999. The main finding of the study is the significant effect of the economic growth on the tax composition in the 24 OECD countries for the years 1980 - 1999: The shares of personal and property taxes respond positively while shares of the payroll and property taxes respond negatively to economic growth. By heavily focusing on how taxes affect economic growth, empirical evidence found in OECD (2008) calls attention to the design of tax structures to promote growth and suggests that corporate income taxes are the most harmful for growth, followed by personal income taxes, consumption taxes and finally taxes on wealth in the OECD countries. Aiming a different concern, aside from the taxesgrowth nexus, a recent study by Ardic et al (2010), puts forward that the recent increase in the indirect taxes in Turkey puts the burden on mostly the poor, raising concerns of inequality and evaluates the efficiency of the current indirect taxes in Turkey by taking into account distributional concerns. Their findings indicate that the current tax rates are not optimal.
4. Empirical and Analytical Framework The analytical framework of the study is based on Feder’s two-sector production function approach. de Wet, Schoeman and Koch (2005) employ Feder’s (1983) theoretical framework to examine the effects of direct and indirect taxes on economic growth in South Africa. Following Ram (1986) and de Wet, Schoeman and Koch (2005), it is assumed that the economy is divided into two major sectors, the government sector (G) and the non-government (private sector) (P). In this two-sector model, the production functions for the government and non-government sectors can be written as follows: (1) P = P ( LP , K p , G )
G = G( Lg , K g )
(2)
Here, L is labor input, K is capital input and, subscripts p and g denote sectoral inputs. The total inputs can then be specified as follows: L = LP + L g (3) (4) K = KP + Kg It is clear that the total output (Y) is the sum of outputs (P and G) in the two sectors and thus ΔY ΔP P ΔG G Y = P+G ⇒ = ( )+ ( ) (5) Y P Y G Y where Δ indicates growth rate. Assuming that the relative factor productivity in the private and government sectors varies, the following relation can be specified: GL GK = = (1 + δ ) (6) PL PK where GL = is the marginal product of labor in the government sector or ∂G / ∂L ; PL = the marginal product of labor in the private sector or ∂P / ∂L ; GK = the marginal product of capital in the government sector or ∂G / ∂K ; and PK = the marginal product of capital in the private sector or ∂P / ∂K : Using the sectoral production functions and relations (3) to (6), after some algebraic manipulations Ram (1986) and de Wet, Schoeman and Koch (2005) derive the following aggregate growth equation: ΔY I ΔL ΔG ⎛ δ ⎞ ΔG ⎛ G ⎞ (7) = α1 + β +θ + ⎜( −θ )⎟ ⎜ ⎟+ε Y Y L G ⎝ 1+ δ ⎠ G ⎝Y ⎠ Following de Wet, Schoeman and Koch (2005), we assume that a stable and consistent relationship between government expenditure and taxes exists, therefore it is possible to proxy G with taxes (T) such that: G = T = Td+Tid
56
International Research Journal of Finance and Economics - Issue 59 (2010)
and ΔG ΔTid + ΔTd (8) = G G where Td and Tid stand for direct and indirect taxes, respectively. If one substitutes equation (8) into equation (7), the following equation is derived: ⎡⎛ ΔTd⎞ Td⎤ ⎡ δ ⎡⎛ ΔTid⎞ Tid⎤ ⎡ δ ΔY I ΔL ⎤⎛ ΔTd⎞ Td ⎤⎛ ΔTid⎞ Tid (9) −θ)⎥⎜ −θ)⎥⎜ =α0 +α1 + β +θTd ⎢⎜ ⎟ ⎥ + ⎢( ⎟ +θTid ⎢⎜ ⎟ ⎥ + ⎢( ⎟ +ε Y Y L ⎦⎝ Td ⎠ Y ⎣⎝ Td ⎠ T ⎦ ⎣ 1+δ ⎣⎝ Tid ⎠ T ⎦ ⎣ 1+δ ⎦⎝ Tid ⎠ Y It, however, is notable that collinearity between indirect taxes (Tid) and direct taxes (Td) leads to collinearity issue. therefore it is problematic to estimate equation (9). To account for the collinearity problem, we estimate equation (9) for both direct and indirect taxes, separately. We employ the empirical regression equations for both direct and indirect as follows: ⎡⎛ ΔTd ⎞ Td ⎤ ⎡ δ I ΔY ΔL ⎤⎛ ΔTd ⎞ Td = α 0 + α1 + β + θ Td ⎢⎜ − θ )⎥⎜ +ε (10) ⎟ ⎥ + ⎢( ⎟ Y Y L ⎦⎝ Td ⎠ Y ⎣⎝ Td ⎠ T ⎦ ⎣ 1 + δ
⎡⎛ ΔTid ⎞ Tid ⎤ ⎡ δ I ΔY ΔL ⎤⎛ ΔTid ⎞ Tid = α 0 + α1 + β + θ Tid ⎢⎜ + ⎢( − θ )⎥⎜ +ε (11) ⎟ ⎟ ⎥ Y Y L ⎦⎝ Tid ⎠ Y ⎣⎝ Tid ⎠ T ⎦ ⎣ 1 + δ where εt is a random error term having the traditional statistical properties. θ denotes the impact of taxation on non-government sector, thus we can regard this as the external effect of the revenue collection activities on the non-government. If θ is statistically significant, government tax collection has an impact on economic growth. The estimated value of θTd and θTid would, therefore, represents the government’s external impact on economic growth. If θTd and θTid are significant, taxes have an effect on economic growth. Nonetheless, it should be noted that equation (8), G=T=Td+Tid , assumes balanced budgets and no seigniorage, which may not be realistic for Turkey because seigniorage was an important source of revenue during the high inflation period, from the late 1970’s until the late 1990’s. Therefore, we include seigniorage as an explanatory variable since it was a relevant source of revenue. 4.1. Data
All data descriptions and sources are given in appendix. The GNP (Y) and physical capital data which is proxied by the gross domestic investment obtained from State Planning Organisation (SPO), and TUIK. Human capital data was taken from Altug et al.(2008). We gathered the data on taxes from General Directorate of Budget and Fiscal Control (BUMKO). Seigniorage (SG) is defined as, following Cukierman et al (1992), as the ratio of the increase in base money to total government revenue. The GNP deflator (1987=100) was used to deflate nominal values.
5. Empirical Results Table 3 provides the results for the estimated growth model with the direct and indirect tax components, respectively. All data descriptions and sources are given in appendix. Using annual data for Turkey over the period 1968-2006, equations (10) and (11) have been estimated with ordinary least squares (OLS). Table 3:
Empirical Results, 1968-2006
Variable Constant I Y
Equation 10 Coefficients 0.513 (0.000) 0.2578 (0.001)
Equation 11 Coefficients 0.574 (0.002) 0.2562 (0.001)
International Research Journal of Finance and Economics - Issue 59 (2010) ΔL L ⎛ Δ Td ⎜ ⎝ Td
⎞ Td ⎟ ⎠ T
⎛ Δ Td ⎜ ⎝ Td ⎛ Δ Tid ⎜ ⎝ Tid
⎞ ⎟ ⎠ ⎞ ⎟ ⎠
⎛ Δ Tid ⎜ ⎝ Tid
⎞ Tid ⎟ ⎠ Y
Td Y Tid T
0.447 (0.000) -0.907 (0.413) -0.601 (0.253) -
57 0.465 (0.000) 0.463 (0.047) -0.955 (0.184) 0.0725 (0.139) 0.45 0.378 2.265
0.0706 (0.127) R2 0.47 Adjusted R2 0.369 D.W 2.197 Diagnostic Test 4.926 5.673 Jarque-Bera (0.0709) (0.0671) 4.573 6.974 LM(1) (0.351) (0.526) 0.1719 0.2586 ARCH(1) (0.678) (0.6110) 9.2923 8.3376 White (0.318) (0.401) 2.2231 2.825 Ramsey Reset (0.146) (0.103) Quandt LR test 2.1845 2.2433 Break Date 1992 1992 Notes: Figures in brackets are the p-values. LM (m) is a test of m-order serial correlation ARCH (m) is an m-order test for autoregressive conditional heteroskedasticity. Jarque–Bera is the test of the normality of the residuals. White general heteroscedasticity test is based on the regression of squared residuals on squared fitted values. Ramsey Reset is a test for functional form using the square of the fitted values. SG
Table 3 shows the results for the estimated growth model with the direct and indirect tax components, respectively. As clearly seen from the table, the fit of the equations, as measured by the adjusted R2, is satisfactory, considering that the equations are expressed in difference forms, which implies that the results do not suffer from the “spurious regression problem” (Granger and Newbold, 1977)2. The empirical results imply that the main determinants of growth are labor and investment growth. The diagnostic tests indicate no problems with the models. Empirical results reveal that the human capital growth rate has actually contributed positively to the growth of GDP and that growth in fixed and human capital contribute positively to income growth. Other hand, seignorage variable (SG) is not statistically significant in both equations. Our first estimation equation, in the first column, indicates that direct taxes have no impact on economic growth because both θTd and the relative efficiency variables for direct taxes are not significant. Moreover, our estimation results suggest that no efficiency losses occur due to the extraction of resources out of non-government sector, since the relative efficiency variables for direct and indirect taxes are not statistically significant. Other hand, in the second column, the significant and positive coefficient on the indirect tax effect indicates that indirect tax collection is not detrimental to economic growth. The results are consistent with the economic theory advocating indirect taxes have
2
Although Feder model generally includes rate of change the variables which implies first differencing, this does not always imply stationarity of variables. Therefore, we conduct unit root tests of the variables used in our model to avoid spurious regressions. The results of unit root tests indicating the stationarity of all variables are not reported here for the sake of brevity but can be obtained from the authors upon request. Thus, the results obtained from the ordinary least squares technique are reliable.
58
International Research Journal of Finance and Economics - Issue 59 (2010)
less harmful influence on economic activities than direct taxes, due to the fact that direct taxes change the relative prices in the economy (de Wet, Schoeman and Koch, 2005: 206). Though the diagnostic tests indicate no problems with the models, all these results, however, should be interpreted with a caution as the parameters may not remain stable during the period. To test whether there is no endogenous shift in the parameters, we consider Quandt likelihood ratio test for parameter stability. For the stability test, the null hypothesis is that there are no changes in the parameters. The test results given Table 1 suggest that the parameters are stable over the time period since the null hypothesis can not be rejected. To confirm parameter stability, we also use the cumulative sum of the standardized recursive residuals (CUSUMQ) test. As seen from Figures 3 and 4, the plots of CUSUMSQ statistics are confined within the critical bounds, implying that all coefficients in the models are stable. Figure 3: The Plot of CUSUMSQ statistics for Model 1 CUSUMSQ plot with 95% confidence band 1.4
1.2
1
0.8
0.6
0.4
0.2
0
-0.2
-0.4 1970
1975
1980
1985
1990
1995
2000
2005
2010
Observation
Figure 4: The Plot of CUSUMSQ statistics for Model 2 CUSUMSQ plot with 95% confidence band 1.4
1.2
1
0.8
0.6
0.4
0.2
0
-0.2
-0.4 1970
1975
1980
1985
1990
1995
2000
2005
2010
Observation
6. Summary and Concluding Remarks Determining the composition of direct and indirect taxes is a fundamental tax policy choice. Many studies of the relationship between tax composition and growth were conducted after the introduction of the endogenous growth models. Existing empirical studies on tax composition and growth differ in terms of countries and period covered in the sample, the variables in the model and the method of estimation. The dominant view is that the relative share of indirect taxation should be greater than direct taxation in order to promote growth.
International Research Journal of Finance and Economics - Issue 59 (2010)
59
Turkish Tax System comprises direct and indirect taxes. Direct taxes include Income Tax, Corporation Income Tax and Property Taxes. Indirect taxes include Value Added Tax (VAT), Specific Consumption Tax, Stamp Tax, Motor Vehicle Tax, Banking and Insurance Transactions Tax and Communication Tax. The Turkish Tax System relies on taxation of goods and services. VAT system was introduced in Turkey in 1985, replacing eight indirect taxes. Other indirect policy reform in 2002 was introducing a unified Special Consumption Tax replaced a range of indirect taxes on oil products, vehicles, alcohol and tobacco products and a range of luxury consumer goods into a one single tax. The indirect taxes play a predominant role in Turkish Tax System; the indirect taxes as a percentage of total tax revenue have increased from 37.2 % in 1980 to 53.1 % in 1985, 59.3 % in 1995 and 68.7 % in 2006. These data reflect that the composition of the tax revenue in Turkey critically relies on indirect taxation as opposed to direct taxation. This indicates a significant change in the tax burden from direct to indirect taxation even if in OECD countries, the relative share of direct tax revenue is higher than the indirect taxes. The important reflection is that Turkish public finance authorities are relying on indirect taxation, a relatively easy tax component to collect, to solve fiscal needs despite their unfair effects on income distribution. Based on the investigation of the effects of this serious transformation from direct taxes to indirect taxes on the growth rate, this study aimed at testing the relationship between direct/indirect tax composition and economic growth rate in Turkey for the period 1968-2006. Empirical results of the study indicate that the indirect taxes are significantly positively correlated with economic growth in a time series data of Turkish Economy during 1968 – 2006 supporting the predictions of the endogenous growth models. Moreover, direct taxes are not significantly associated with economic growth. Our estimation results indicate that the scope of government to directly influence economic growth through taxation should be with indirect taxation by lowering the relative share of direct tax taxation in total tax revenue. These results imply that governments are able to influence the economic growth rate by altering the indirect-direct tax composition. Specifically, the favorable tax composition is the one that would give the weight to indirect taxation.
Acknowledgement We would like to thank to Francisco José Veiga for his helpful comments.
References [1] [2] [3] [4] [5] [6] [7] [8]
Altug, S., A. Filiztekin, and S. Pamuk (2008). \Sources of Long-Term Economic Growth For Turkey, 1880-2005," European Review of Economic History, 12, 393-430. Ardic, O. P., B. Erus and G. Soydan, 2010. “An Evaluation of Indirect Taxes in Turkey”, Economics Bulletin, 30 (4), pp. 2787-2801. Barro, R. J., 1990. “Government Spending in a Simple Model of Endogenous Growth”, Journal of Political Economy, 98 (5), pp. S103-S125. Benos, N., 2009. “Fiscal Policy and Economic Growth: Empirical Evidence from EU Countries”, MPRA Paper, No:19174. Branson, J., and C. A. K. Lovell, 2001. “A Growth Maximizing Tax Structure for New Zealand”, International Tax and Public Finance, 8, pp. 129-141. Cukierman, A., S. Edwards and Tabellini, G., 1992. “Seignorage and Political Instability”, American Economic Review, 82, pp. 537-55. De Wet, A.H., N. J. Schoeman and S. F. Koch, 2005. “The South African Tax Mix and Economic Growth”, South African Journal of Economic and Management Sciences, 8 (2), pp. 201-210. Easterly, W., S. Rebelo, 1993. “Fiscal Policy and Economic Growth: An Empirical Investigation”, Journal of Monetary Economics, 32, pp. 417-458.
60
International Research Journal of Finance and Economics - Issue 59 (2010)
[9]
Feder, G., 1983. “On Exports and Economic Growth”, Journal of Development Economics, 12, pp. 59-73. Granger, C. and W. J., P. Newbold, 1977., Forecasting Economic Time Series, New York: Academic Press. Hall, R. E., 1968. “Consumption Taxes versus Income Taxes: Implications for Economic Growth”, Proceedings of the 61. Tax Conference, San Fransisco, CA. Harberger, A., 1964. “Taxation, Resource Allocation and Welfare” in The Role of Indirect Taxes in the Federal Reserve System (Ed.) by the NBER and Brookings Institution, Princeton University Press: Princeton. King, R. and G., S. Rebelo, 1990. “Public Policy and Economic Growth: Developing Neoclassical Implications”, Journal of Political Economy, 98, pp. S126-150. Kneller, R., M. F. Bleaney and N. Gemmell, 1999. “Fiscal Policy and Growth: Evidence from OECD Countries”, Journal of Public Economics, 74, pp. 171-190. Koch, S. F., N. J. Schoeman, and J. J.Van Tonder (2005), “Economic Growth and the Structure of Taxes in South Africa: 1960-2002”, South African Journal of Economics, 73 (2), pp. 190210. Lee, Y. and R. H. Gordon, 2005. “Tax Structure and Economic Growth”, Journal of Public Economics, 89, pp. 1027-1043. Lucas, R., 1990. “Supply-side Economics: An Analytical Review”, Oxford Economic Papers, 42 (2), pp. 293-316. Mamatzakis, E. C., 2005. “The Dynamic Responses of Growth to Tax Structure for Greece”, Applied Economic Letters, 12, pp. 177-180. Marsden, K., 1983. “Links Between Taxes and Economic Growth: Some Empirical Evidence”, World Bank Staff Working Paper, No: 605. Mendoza, E., G. Milesi-Fereti and A. Patrick, 1995. “Do Taxes Matter for Long-Run Growth?”, IMF Working Paper, No: (95)79. Mendoza, E., G. Milesi-Ferretti and P. Asea, 1997. “On the Effectiveness of Tax Policy in Altering Long-Run growth: Harberger's Superneutrality Conjecture”, Journal of Public Economics, 66 (1), pp. 99-126. Musgrave, R. A., 2006. “Public Finance and Three Branch Model”, The Elgar Companion to Public Economics-Empirical Public Economics,(Edited by A.F.Ott ve R. J. Cebula ), Cheltenham: Edward Elgar. OECD, 2006. Tax Policy Reforms in Turkey, Center for Tax Policy and Administration. OECD, 2008. Tax and Economic Growth, Economics Department Working Paper No: 620 OECD, 2009a. Revenue Statistics 1965-2008, Organization for Economic Co-Operation and Development Publication. OECD, 2009b. “Economic Growth and the Role of Taxation-Theory”, Organization for Economic Co Operation and Development Economics Department Working Paper No:713. Ram, R., 1986. “Government Size and Economic Growth: A New Framework and some Evidence from Cross Section and Time Series Data”, American Economic Review, 76, 191-pp. 203. Skinner, J., 1988. “Taxation and Output Growth in Africa”, The World Bank Policy Research Working Paper Series, Vol: 73. Solow, R. M., 1970. Growth Theory: An Exposition, New York: Oxford University Press. Tosun, M. S. and S. Abizadeh, 2005. “Economic Growth and Tax Components: An Analysis of the Tax Changes in OECD”, Applied Economics, 37, pp. 2251-2263. Widmalm, F., 2001. “Tax Structure and Growth: Are Some Taxes Better Than Others?” Public Choice, 107, pp. 199-219. The previous version of this paper was presented at the Annual Meeting of European Public Choice Society, April 8-11 2010, Izmir-Turkey.
[10] [11] [12] [13] [14] [15] [16] [17] [18] [19] [20] [21] [22] [23] [24] [25] [26] [27] [28] [29] [30] [31] [32]
International Research Journal of Finance and Economics - Issue 59 (2010)
Appendix: Data Source and Descriptions ΔY Y I Y ΔL L SG
ΔTd Y ΔTid Y ΔTd Y ΔTid Y
Data Descriptions The growth rate of real GDP per capita The ratio of fixed capital formation to GDP The growth rate of the human capital
Data Source SPO, TUIK SPO, TUIK Altug et al.(2008)
Growth rate of seigniorage The growth rate of the direct taxes as a share of total tax revenue
SPO, TUIK and TCMB General Directorate of Budget and Fiscal Control (BUMKO)
The growth rate of the indirect taxes as a share of total tax revenue
General Directorate of Budget and Fiscal Control (BUMKO)
The growth rate of the direct taxes as a share of total income, which measures the relative efficiency between direct taxes and the real sector The growth rate of the indirect taxes as a share of total income, which measures the relative efficiency between indirect taxes and the real sector
General Directorate of Budget and Fiscal Control (BUMKO) General Directorate of Budget and Fiscal Control (BUMKO)
61