Economic Growth Slows Amid Financial Market Crosscurrents 4.0%
Total Nonfarm Payroll (SA, Year-over-Year % Change)
Incoming economic data point to a widespread loss of momentum in late 2015 and early 2016. We project another year of unspectacular economic growth in 2016, with real gross domestic product (GDP) rising 2.0 percent following a 1.8 percent gain in 2015. Consumer spending will continue to underpin growth in 2016, albeit at a slightly more moderate pace than last year. While lower gasoline prices should benefit consumers, there has been little evidence that windfalls from declining gasoline prices have boosted consumer spending.
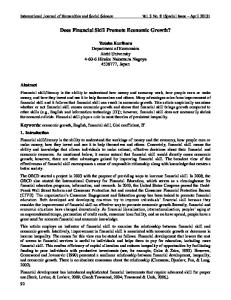
Job Growth Decelerated in Energy-Producing States
3.0% 2.0% 1.0% 0.0% -1.0% -2.0% -3.0%
-4.0%
Energy States*
While an economic boost from declining oil prices has been elusive, Non-Energy States -5.0% evidence of the negative side of the global oil rout is mounting. First, -6.0% the price collapse has reduced the value of energy stocks and the '00 '01 '02 '03 '04 '05 '06 '07 '08 '09 '10 '11 '12 '13 '14 '15 *Energy States: AK, LA, MT, ND, NM, OK, TX, WV, WY overall equity markets. The high correlation between the U.S. stock markets and the price of oil is perhaps because the markets view oil prices as a gauge of the health of the global economy. In addition, the sharp and sustained decline in oil prices has also led to a pullback in domestic crude production and exploration, reducing nonresidential business investment in oil-drilling structures, and capital expenditures in miningrelated equipment. Finally, employment in energy-producing states has reflected the drop in oil prices. Some states, such as North Dakota, saw outright declines in nonfarm payrolls in 2015, but collectively job gains in energy-producing states slowed markedly over the past year. The strong dollar and a sluggish global economy have hurt manufacturing and net exports, which should drag further on economic growth in the U.S. Low energy prices should continue to pressure nonresidential investment in structures, and the squeeze on profit margins and the strong dollar will weigh on business capital investment. However, we expect that the strength in residential investment and government spending should help offset some of those weaknesses. Downside risks to our forecast include increased stress in the banking system that could lead to tighter credit conditions and widening risk spreads; a further slowdown in economic growth in China, as well as turmoil in its equity and foreignexchange markets; additional appreciation in the dollar (e.g., through a large one-off yuan devaluation) or drops in oil prices; and a widening conflict in the Middle-East. Monetary Policy Turns Dovish Around the Globe In addition to slowing economic activity, financial conditions have deteriorated over the past month, with lower equity prices and wider credit spreads. Global concerns have intensified, especially for China, and central banks across the globe have turned more cautious. The Bank of Japan (BoJ) surprised the markets by announcing at its January monetary policy meeting that it would follow the European Central Bank (ECB) and implement a negative interest rate policy. Further cuts seem likely this year as inflation remains well below its target. The ECB also signaled that it might engage in further policy stimulus in the near future. The 10 Year-2 Year Treasury Yield Spread Reaches the Narrowest Gap Since 2008
4.5% Market expectations for the pace of Fed tightening have slowed, UST 10-Year Yield 4.0% reflected in the fed funds futures market, which indicates that 2016 UST 2-Year Yield rate hikes are now off the table. We believe that slowing economic Spread 3.5% growth, a sharp deterioration of financial conditions, and weakening 3.0% inflation expectations suggest more patience from the Fed for the 2.5% next rate increase and a slower pace of tightening over the midterm. We now expect the next fed funds rate increase in June, 2.0% followed by another one in December, compared with three 1.5% increases this year assumed in the prior forecast. Consistent with 1.0% this belief, we assume that reinvestment phase-out will begin in 0.5% early 2018—a year later than in our previous forecast. Recent dovish shifts by the ECB and the BoJ, as well as risk-off sentiment 0.0% '08 '09 '10 '11 '12 '13 '14 '15 '16 in the markets, have put further downward pressure on long-end interest rates, with the 10-year Treasury yield falling below 1.7 percent on February 8 to reach a 12-month low. The yield curve flattened, sending the spread between 2-year and 10-year Treasury yields to the narrowest gap since 2008. The yield hovered around 1.73 percent at the time of this writing.
1
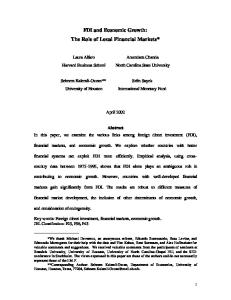
Economic Growth Ends 2015 with a Whimper We trimmed our forecast of first quarter economic growth by 0.6 percentage points to a 1.9 percent annualized pace following the meager 0.7 percent first estimate of fourth quarter growth. Real consumer spending drove growth, rising 2.2 percent annualized and contributing 1.5 percentage points to the increase in GDP. Residential investment and the government sector also added to growth, helping to offset drags from inventories, net exports, and business fixed investment. Although inventory investment declined further in the fourth quarter, we believe the level of investment remains unsustainably high, suggesting that the inventory correction could extend into the current quarter, continuing to drag on GDP growth.
GDP Growth Anemic in Q4 as Personal Consumption is Forced to Carry the Load GDP
0.7%
Personal Consumption Expenditures Nonresidential Fixed Investment
1.5% -0.2%
Residential Fixed Investment
0.3%
Change in Private Inventories
-0.5%
Net Exports of Goods and Services
-0.5%
Government Consumption and Investment
0.1%
-1.0% -0.5% 0.0% 0.5% 1.0% 1.5% 2.0% Contribution to 2015 Q4 Real GDP Annualized % Change
Consumers Save the Day Our forecast of a rebound in growth in the first quarter reflects our expected pickup in real consumer spending growth to 2.7 percent annualized. Real consumer spending was uninspiring in December, edging up only 0.1 percent, despite a decent income gain. As a result, the saving rate rose to tie a three-year best, building a cushion for consumers early this year. In addition, the solid earnings growth reflected in the January jobs report should support stronger consumer spending this quarter. A rebound in January vehicle sales suggests that consumer spending might already be picking up. 4.0%
SA, Year-over-Year % Change
Despite the equity market crosscurrents, the labor market remains healthy. Following outsized gains averaging 279,000 per month during the fourth quarter of 2015, growth in nonfarm payrolls moderated to 151,000 in January. However, the unemployment rate fell to 4.9 percent, the first four-handle rate in nearly eight years, and the labor force participation rate edged up for the second consecutive month. The tightening labor market helped boost average hourly earnings growth, which jumped 0.5 percent from the prior month, the largest monthly increase in a year, and 2.5 percent from a year ago. In another encouraging sign, the average work week rose one-tenth to 34.6 hours. The combination of increased hours worked and solid earnings gains implied strengthening labor income growth at the start of the year.
Wage Growth Picks Up as the Unemployment Rate Declines Further
3.5%
Average Hourly Earnings Unemployment Rate (Right Axis)
9% 8%
3.0% 7%
2.5% 6% 2.0%
5%
1.5%
4%
Quit Rate Jumps to Expansion High 30% 25%
NFIB Small Business Survey (Share of Firms Having...)
2.50%
JOLTS: Quits Rate (SA, %)
Small Businesses Compete to Fill Open Positions
2.25% 2.00%
1.75% 1.50%
30%
20%
25%
15% 20% 10% 15% 5% 10%
0% -5%
Raised Compensation Over Past 3 Months Positions Not Able to Fill (Right Axis)
-10%
1.25% '01 '02 '03 '04 '05 '06 '07 '08 '09 '10 '11 '12 '13 '14 '15
35%
Hundreds
'06 '07 '08 '09 '10 '11 '12 '13 '14 '15 '16 The Job Openings and Labor Turnover Survey (JOLTS), which is released with a one-month lag to the employment report, painted an upbeat picture of the labor market going into 2016, with increased job openings, hires, and quits, as well as decreased layoffs, in December. Notably, the job openings rate increased to 3.8 percent, matching the high for the expansion and the highest on record since the inception of the series in 2000. The quit rate, which reflects workers’ confidence in the jobs market, jumped to an expansion high of 2.1 percent. The combination of more job openings and quits supports the view that wage gains should continue to strengthen. A survey from the National Federation of Independent Business (NFIB) reinforced the notion of a tightening labor market in January. Both the share of firms reporting unfilled job openings and the share reporting increasing compensation over the past three months were at expansion highs. However, the share planning to raise compensation over the next three months pulled back from its expansion high in the prior month.
2.75%
10%
5%
0% '01 '02 '03 '04 '05 '06 '07 '08 '09 '10 '11 '12 '13 '14 '15 '16
2
Consumers Appear More Comfortable Using Credit Cards
15%
Consumer Credit Outstanding (EOP, NSA, Year-over-Year % Change)
The trend in consumer credit outstanding data from the Fed also suggests improving consumer fundamentals. Revolving credit (largely credit card debt) rose 5.1 percent in December from a year ago for a second consecutive month. If this uptrend continues, it would indicate increased confidence, boding well for consumer spending this year. Meanwhile, nonrevolving credit (largely auto and student loans) has slowed slightly during the past year, helping to narrow the gap between revolving and nonrevolving credit.
10%
5%
0%
Drags Remain We expect the strong dollar, sluggish global growth, and low oil -5% prices will remain drags on growth in 2016. After subtracting 0.7 Revolving Credit percentage points from GDP growth in 2015, the biggest drag since Nonrevolving Credit -10% 2004, net exports are expected to slow economic growth again this '05 '06 '07 '08 '09 '10 '11 '12 '13 '14 '15 year, albeit to a lesser degree. Even if the dollar stabilizes, the lags inherent in the relationship between relative prices and trade volumes imply a lasting effect on the change in net exports. Given our expectation of continued low oil prices this year, expenditures on oil and gas wells and shafts and oilfield machinery, which fell about 50 percent in 2015, should continue to decline, but at a moderating pace. Because its share of GDP is now approximately only half of what it was a year ago, the energy sector’s drag on economic growth should be modest this year; however, we expect overall nonresidential investment in structures to subtract from growth again this year. Housing Roundup Against the backdrop of weak activity elsewhere in the economy, the housing market remained resilient, contributing 0.3 percentage points to GDP growth during the fourth quarter as well as for all of 2015. Stronger income growth and low mortgage interest rates last year helped boost housing activity. Single-family starts and new home sales reached the highest annual levels since 2007, existing home sales had the best showing since 2006, and multifamily starts posted the best year since 1988. (For more information on rental market conditions, read the February 2016 Multifamily Market Commentary). Home price gains strengthened, with the CoreLogic home price index rising 6.3 percent in December from a year ago, the biggest annual gain since July 2014. The dearth of homes available for sale should continue to support home prices; however, tight supply could also make it difficult for potential homebuyers to find homes to fit their needs. With renewed declines in the stock market since late last year, strong home price appreciation has become a key support for household balance sheets and helped lift more underwater mortgages into positive equity position, reducing the likelihood of default and creating a healthier housing market. Despite Quarter-to-Quarter Volatility, Housing Formation Has Trended Higher
2,500
Total Occupied Housing Units (Break-adjusted, Thous, Y-o-Y Change)
On a sobering note, the Census Bureau’s Housing Vacancy Survey showed the homeownership rate (not seasonally adjusted) declined 0.2 percentage points to 63.8 percent in the fourth quarter of 2015 from a year ago, sending the 2015 average to 63.7 percent, the lowest annual reading since 1967. Data on household formation from the survey also disappointed, with the year-over-year gain moderating significantly to less than 500,000. However, we do not put much weight on just one quarter of this survey, which can produce volatile estimates of household growth. The weakness may reflect a payback from the spike in household growth registered in the fourth quarter of 2014. The annual average for all of 2015 showed an increase of 1.3 million households over 2014. Smoothing the volatile quarterly series over the past several years, we can clearly see that household formation has trended up.
2,000
1,500
1,000
500
Household Formation 3-Year Moving Average 0 '95
'97
'99
'01
'03
'05
'07
'09
'11
'13
'15
Mortgage interest rates are expected to remain a support for home buying activity this year. Given the renewed flight-tosafety over the past month, we lowered our projected long-term interest rate path, with the 30-year fixed mortgage rate expected to remain below 4.0 percent through the rest of this year. Home sales were upbeat going into 2016. New home sales, which measure contract signings on new homes, posted the biggest monthly jump in December since August 2014. Existing home sales also posted a double-digit increase after a disappointing November, when closings were likely delayed by implementation of the TILA-RESPA Integrated Disclosure (TRID) regulation. Pending home sales, which record contract signings on existing homes, were essentially flat in December, but their stabilization following the 3
While we believe that labor market conditions will tighten further, helping to boost wages, we also expect that home price appreciation will continue to outpace income growth, constraining home purchase affordability and impeding home sales. Affordability challenges are more prevalent in the lower-end of the housing market. Data from CoreLogic showed that home price appreciation in late 2015 was much stronger in the lower-end of the housing market than in the overall market, thanks to a very lean inventory consisting of about five months’ supply of homes for sale. In October 2015, the months’ supply readings for the low and the lowto-middle price tiers were comparable to those witnessed more than a decade ago.
Months' Supply of Homes by Price Tier
downtrend between May and November could be considered a positive. Data from weekly purchase mortgage applications have been much more encouraging, with average monthly readings for December rising 7 percent from a year ago on top of nearly a 5 percent gain in November, though they have cooled somewhat since the start of the year. 25
Inventory Is Tightest for the Low and Low-to-Middle Price Segments Tier 1 Tier 2 Tier 3 Tier 4
20
15
10
5
0 '00 '01 '02 '03 '04 '05 '06 '07 '08 '09 '10 '11 '12 '13 '14 '15
Note: Tier 1: 0-75% of median, Tier 2: 75%-100% of median, Tier 3: 100%-125% of median, Tier 4: 125% + of median
One positive for affordability is continued easing credit standards, according to the latest Fed’s senior loan officer survey. While the survey showed signs of further tightening in lending standards in the three months ending in January for several types of loans, including commercial and industrial loans and commercial real estate loans, lending standards for residential mortgages eased further for GSE-eligible loans, the largest segment of mortgage originations. We believe that continued gradual easing of credit constraints, via low down payment government loans and various GSE products, should help alleviate affordability problems for some potential first-time homebuyers, who are key to continued expansion in the home sales market.
Period-over-Period Change, %
Our outlook for housing activity is little changed from the prior forecast. We expect home sales to rise further this year, but at a more moderate pace than last year. Multifamily starts have been a bright spot for the housing sector during the last few years. Despite continued strong demand for rental housing, we Gains in Housing Activity Should Moderate, believe that expansion in that segment of the market is in a more Except for Single-family Construction 16% mature state, and therefore we expect multifamily construction gains Thous. 2015 2016 Single-Family Starts 715 817 to be more modest this year. We expect that some of the supply 14% Multifamily Starts 396 417 Existing Home Sales 5,260 5,402 constraints for single-family homebuilding will ease amid strong New Home Sales 501 558 12% pent-up demand and positive momentum of new home sales at the 2015 10% end of last year, allowing builders to increase production at a faster 2016 Forecast pace this year. While our forecast of purchase mortgage 8% originations is largely the same as in the January forecast, we 6% revised higher our projected refinance originations by slightly more 4% than $100 billion in 2016 to reflect our lower mortgage interest rate forecast. Total single-family mortgage originations should drop 2% about 11 percent this year to $1.51 trillion, before declining by less 0% than 5 percent in 2017. We expect the refinance share of Single-Family Multifamily Existing Home New Home Starts Starts Sales Sales originations to trend down from 47 percent in 2015 to 37 percent in 2016 and 31 percent in 2017. February 9, 2016 Economic & Strategic Research (ESR) Group For a snapshot of macroeconomic and housing data between the monthly forecasts, please read ESR’s Economic and Housing Weekly Notes. Data source for charts: Bureau of Labor Statistics, Bloomberg, Bureau of Economic Analysis, National Federation of Independent Business, Federal Reserve Board, Census Bureau, CoreLogic, National Association of REALTORS®, Fannie Mae ESR Forecast Opinions, analyses, estimates, forecasts and other views of Fannie Mae's Economic & Strategic Research (ESR) Group included in these materials should not be construed as indicating Fannie Mae's business prospects or expected results, are based on a number of assumptions, and are subject to change without notice. How this information affects Fannie Mae will depend on many factors. Although the ESR group bases its opinions, analyses, estimates, forecasts and other views on information it considers reliable, it does not guarantee that the information provided in these materials is accurate, current or suitable for any particular purpose. Changes in the assumptions or the information underlying these views could produce materially different results. The analyses, opinions, estimates, forecasts and other views published by the ESR group represent the views of that group as of the date indicated and do not necessarily represent the views of Fannie Mae or its management. 4
ESR Macroeconomic Forecast Team Doug Duncan, SVP and Chief Economist Orawin T. Velz, Director Hamilton Fout, Director
Mark Palim, VP Frank Shaw, Financial Economist
5