Enhancing Financial Stability and Economic Growth The Contribution of Superannuation August 2011 Report to the Association of Superannuation Funds of Australia (ASFA)
Allen Consulting Group Pty Ltd ACN 007 061 930, ABN 52 007 061 930
Melbourne Level 9, 60 Collins St Melbourne VIC 3000 Telephone: (61-3) 8650 6000 Facsimile: (61-3) 9654 6363
Sydney Level 1, 50 Pitt St Sydney NSW 2000 Telephone: (61-2) 8272 5100 Facsimile: (61-2) 9247 2455
Canberra Empire Chambers, Level 2, 1-13 University Ave Canberra ACT 2600 GPO Box 418, Canberra ACT 2601 Telephone: (61-2) 6204 6500 Facsimile: (61-2) 6230 0149
Online Email:
[email protected] Website: www.allenconsult.com.au
Suggested citation for this report: Allen Consulting, Enhancing Financial Stability and Economic Growth – The Contribution of Superannuation, Melbourne, August 2011.
Disclaimer: While the Allen Consulting Group endeavours to provide reliable analysis and believes the material it presents is accurate, it will not be liable for any claim by any party acting on such information. © Allen Consulting Group 2011
The Allen Consulting Group
ii
Contents EXECUTIVE SUMMARY .......................................................................................... IV CHAPTER 1 .............................................................................................................1 CONTEXT ................................................................................................................1 1.1 Purpose of this report and report structure .............................................1 1.2 Superannuation in Australia ....................................................................2 1.3 A brief history of superannuation ............................................................4 CHAPTER 2 .............................................................................................................7 SUPERANNUATION AND FINANCIAL STABILITY ......................................................7 2.1 The Australian super industry’s growing investment presence................7 2.2 The Australian super industry’s presence in various investment assets ..9 2.3 The contribution of the Australian super industry to the stability of the Australian financial system...............................................................................11 2.4 Institutional investors and long-term investing strategies .....................15 CHAPTER 3 ...........................................................................................................17 INCREASING THE SUPERANNUATION GUARANTEE – A BENEFICIAL AND AFFORDABLE REFORM ..........................................................................................17 3.1 3.2 3.3 3.4 3.5
The proposed reform ..............................................................................17 Beneficial for future retirees .................................................................18 Acceptable to workers ............................................................................21 Affordable for employers........................................................................23 Affordable for the taxpayer ....................................................................25
CHAPTER 4 ...........................................................................................................27 SUPERANNUATION AND INVESTMENT ..................................................................27 4.1 Superannuation’s role in supporting Australian investment..................27 4.2 Private investment..................................................................................27 4.3 Case studies of direct property investment ............................................29 4.4 Infrastructure investment .......................................................................33 CHAPTER 5 ...........................................................................................................43 QUANTIFYING THE OPPORTUNITY: IMPACT OF INCREASING THE SUPERANNUATION GUARANTEE ...........................................................................43 5.1 Modelling framework .............................................................................43 5.2 The chain of causation from higher savings to higher GDP..................45 5.3 Results ....................................................................................................46 5.4 Conclusion .............................................................................................47
The Allen Consulting Group
iii
ENHANCING FINANCIAL STABILITY AND ECONOMIC GROWTH: THE CONTRIBUTION OF SUPERANNUATION
Executive summary Introduction
In 2009 we wrote a report detailing the benefits of Australia’s compulsory 1 superannuation system. This report updates that work and also provides detail on further ways in which the Australian superannuation system continues to benefit all Australians. It also provides modelling confirmation of the large benefits to the Australian economy of the Government’s announced policy of increasing compulsory superannuation from nine per cent to twelve per cent. Australia’s mature superannuation industry continues to benefit all Australians in three ways. First, Australia’s superannuation sector assisted the country in avoiding the worst consequences of the Global Financial Crisis. When overseas markets dried up, Australia’s large superannuation funds through their direct and indirect investments were able to help Australian companies raise equity and so reduce their reliance on overseas debt markets. Second, the federal government’s announced reform of raising the Superannuation Guarantee from nine per cent to twelve per cent is both good for workers and affordable for employers. Workers benefit from the increase in their post-retirement standard of living that comes from the increase in the Superannuation Guarantee. It is affordable for employers because the economic incidence of the rise in the Superannuation Guarantee does not fall on them once the reform has bedded down. Tax measures to be introduced at the same time will also assist both small and large businesses with any transitional impacts from the increase in the SG. Third, Australia’s superannuation sector plays an increasingly important role in helping to fund Australia’s substantial investment needs now and into the future. This occurs through investments made by investment managers and increasingly direct by superannuation funds. Australian superannuation funds support private sector investment via investments made on the stock exchange. This is currently especially important due to the private investment boom Australia is experiencing as a result of the currently historically unprecedented mining boom. But Australian superannuation is an increasingly important player in funding much-needed public and private infrastructure. This is a role that is likely to increase in the future, as more and more superannuation funds allocate part of their portfolios to infrastructure investment, and as fund-consolidation enables the funding of investments of scale. An aging population will also be seeking the type of long-lived, low risk, moderate reward investments which large-scale public infrastructure projects provide.
1
The Allen Consulting Group
The Allen Consulting Group, Better living standards and a stronger economy: the role of superannuation in Australia, September 2009.
iv
ENHANCING FINANCIAL STABILITY AND ECONOMIC GROWTH: THE CONTRIBUTION OF SUPERANNUATION
ACG has modelled the benefits to the Australian economy of an increase in the compulsory Superannuation Guarantee from nine to twelve per cent. Those benefits are substantial. Using the Monash-COPS MMRT model (a computable general equilibrium model of the Australian economy) we show that such a reform, if implemented in 2013, will raise GDP by 0.33 per cent by 2025 compared to a noincrease scenario. In 2010 dollar amounts, this an extra $5,463 million for the economy as a whole in 2025 compared to the no-increase scenario. 2
Given that the Australian population in 2025 is estimated to be about 28 million, that amounts to an extra $195 in the hands of every Australian in 2025 as a result of the reform (compared to not carrying out the reform). In terms of households, this is 3 an extra $520 in the hands of every Australian household by 2025. Super and financial stability
Australia’s mature superannuation industry played a key role in helping firms maintain funding and liquidity during the height of the crisis. A key part of the financial crisis was the withdrawal of liquidity in overseas debt markets. During that time Australian companies were able to raise equity in Australian capital markets largely thanks to off-market purchases substantially funded by superannuation funds. This was especially true for Australian banks, which were among the biggest players in the capital raising market during the GFC. The ability to de-leverage reduced corporate risk and helped Australia avoid the worst consequences of the Global Financial Crisis. Increasing compulsory super is a beneficial and affordable reform
In 2010 the federal government announced that is would be raising the superannuation guarantee from nine per cent to twelve per cent. This reform is both beneficial for workers and affordable for employers. Workers benefit from the increase in their post-retirement standard of living that comes from the increase in the Superannuation Guarantee. The evidence shows that today’s workers are not putting enough away to ensure a comfortable postretirement standard of living. The literature shows that it is (paradoxically) rational for today’s workers to under-provide for the future, even though they will come to regret it, and so workers benefit from the ‘pre-commitment’ savings ‘technology’ that the government’s raising of compulsory superannuation provides to them.
2
3
The Allen Consulting Group
See Table 9 on page 23 of ABS, Australian Demographic Statistics, September 2010, Cat. No. 3101.0. available at: http://www.abs.gov.au/AUSSTATS/
[email protected]/Lookup/3101.0Main+Features1Sep%202010?OpenDocument. For more on population estimates, see the federal Treasury’s Intergeneration Report 2010, available at: http://www.treasury.gov.au/igr/igr2010/Overview/html/overview_05.htm. See Table 20 on page 38 of ABS, Australian Demographic Statistics, September 2010, Cat. No. 3101.0.
v
ENHANCING FINANCIAL STABILITY AND ECONOMIC GROWTH: THE CONTRIBUTION OF SUPERANNUATION
The Government’s reform is affordable for employers because in the long run the economic incidence of the rise in the Superannuation Guarantee does not fall on them. Although the law places the burden on employers to levy the superannuation and provide it to their employees’ superannuation accounts, this legal incidence is not the same as economic incidence. In the long run, the economic incidence of the rise in the Superannuation Guarantee is akin to a payroll tax, which is well known in economics to be among the most efficient taxes in a government’s revenueraising armoury. In particular, it is known from the economics of payroll-taxes that employer profits and decision-making are not affected once the reform has had time to bed down. Super and investment
Australia’s accumulated superannuation funds provide much-needed private and public infrastructure investment. Australians’ superannuation is invested in many different types of asset classes, but especially in corporate equities (on the Australian stock exchange) and bonds. Australian companies fund their private investment needs with these funds. Australia’s current mining boom requires historically unprecedented private infrastructure investment and Australian superannuation is helping to provide that. Australian superannuation is also playing an increasingly important role in funding public infrastructure investment across Australia. Superannuation funds are also one of the major sources of venture capital in the economy. Quantifying the benefits
Our quantitative modelling shows that the Government’s proposed reform to increase the amount of the superannuation guarantee from its current level of nine per cent to twelve per cent will boost savings, investment and GDP over the next 15 years. In particular, the reform will lead to higher growth in (real) GDP compared to a no-reform scenario. By 2025, GDP will be 0.33 per cent greater than it would be without reform. This is because the increase in the Superannuation Guarantee boosts savings, which in turn boosts investment and so leads (due to the compounding nature of economic growth over time) to higher GDP in the future. Conclusion
Given these findings, it is clear that Australia’s compulsory superannuation regime continues to serve the nation well. Our compulsory superannuation regime helped our corporate sector – and especially our banks - to weather the overseas funding storm during the GFC. Additionally, our compulsory superannuation regime continues to play a significant role funding Australia’s increasingly pressing private and public infrastructure needs, and that role will only increase in the future. Our compulsory superannuation regime will be strengthened by the government raising the amount of the guarantee from nine per cent to twelve per cent, which will be good for the retirement futures of current workers while not adversely affecting employers.
The Allen Consulting Group
vi
ENHANCING FINANCIAL STABILITY AND ECONOMIC GROWTH: THE CONTRIBUTION OF SUPERANNUATION
Our quantitative modelling shows that the benefits to Australians of having a mature superannuation industry, supported by compulsory superannuation payments, will only be enhanced once the government implements its reform of increasing the current level of the superannuation guarantee to twelve per cent. In particular, we show that such a reform will lead to a 0.33 per cent increase in (real) GDP by 2025 compared to the no-reform scenario.
The Allen Consulting Group
vii
ENHANCING FINANCIAL STABILITY AND ECONOMIC GROWTH: THE CONTRIBUTION OF SUPERANNUATION
Chapter 1
Context Chapter 1 outlines the purpose of this report and the report's structure. It places superannuation in Australia in context by outlining the history of superannuation and explaining recent developments.
1.1
Purpose of this report and report structure
Superannuation has long been recognised as an important component of Australia’s personal retirement savings, the national savings program, and a driver of the growing financial industry. This report outlines the evidence that superannuation continues to benefit Australians, and does so in three key ways. First, the existence of a well-developed superannuation industry in Australia provided a bulwark against the financial instability produced by the Global Financial Crisis (GFC). This is because superannuation funds, by their nature, have a more long-term view of financial investment and so their strong presence in (especially) Australia's share markets and in other asset classes helped to ameliorate financial instability in Australia's financial system during the GFC (outlined in Chapter 2). Second, there is a strong case for increasing the Superannuation Guarantee from its current nine per cent to twelve per cent. This is because compulsory superannuation benefits families by assisting them to save for their retirement and enables retirees to enjoy a better standard of living in their retirement than compared to being solely on the Age Pension. Employers can afford the increase because (as is well known) the Superannuation Guarantee has the same effect on employers as a payroll tax, which is known to be among the most efficient taxes in any government’s armoury. It is efficient because in the long run it does not affect employers’ bottom lines or decision-making regarding their deployment of their resources (outlined in Chapter 3). Third, superannuation benefits the Australian economy because it is a key driver of economic growth through national savings and investment. It creates jobs both in the finance industry and directly in other industries in which superannuation funds make real investments as part of their portfolio of investments (outlined in Chapter 4). Finally, this report concludes by examining the effect on the Australian economy of the Australian government increasing the superannuation guarantee from nine per cent (its current level) to twelve per cent. This is shown via CGE modelling of the effect of an increased superannuation guarantee on savings, and hence on investment, capital stock and GDP. It is shown that such a policy change, if implemented, will lead to a 0.33 per cent increase in (real) GDP over the next 15 years (outlined in Chapter 5 and in Appendix A).
The Allen Consulting Group
1
ENHANCING FINANCIAL STABILITY AND ECONOMIC GROWTH: THE CONTRIBUTION OF SUPERANNUATION
1.2
Superannuation in Australia
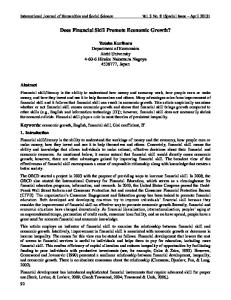
Superannuation as a form of savings has existed for more than a century in Australia, but has only become very widespread since the introduction of award superannuation in the 1980s and when it became compulsory for almost all employees in 1992 with the ‘Superannuation Guarantee’. Employers are now required by law to pay a proportion of an employee's salary and wages into a superannuation fund, which can be accessed when the employee retires or 4 transitions to retirement. Since it became compulsory, superannuation contributions have become a central plank of Australia’s retirement savings system. Household assets in superannuation as a per cent of GDP have risen steadily in the past decade (see Figure 1.1). Figure 1.1
HOUSEHOLD ASSETS IN SUPERANNUATION (PER CENT OF GDP)
Source: ABS 2009a and 2009e
The latest data from 2009 on superannuation coverage from the Australian Bureau of Statistics (ABS) (see Figure 1.2) shows that of all persons aged fifteen or over (16.4 million), 11.6 million have some level of superannuation coverage and 4.8 million do not. Of those with superannuation, 10.8 million have accounts in the accumulation phase; another 0.4 million are accumulating and drawing on their superannuation and 1.2 million are drawing on their superannuation (ABS 2009a).
4
The Allen Consulting Group
Benefits also are available in the case of Total and Permanent Disability (TPD) and hardship or compassionate release.
2
ENHANCING FINANCIAL STABILITY AND ECONOMIC GROWTH: THE CONTRIBUTION OF SUPERANNUATION
Figure 1.2
SUPERANNUATION COVERAGE ACROSS AUSTRALIA
Source: ABS 2009a
Superannuation accumulation is more common in the younger age groups, among men and among employed people. Eighty-seven per cent of people aged 25-54 years have some level of superannuation coverage compared to 50 per cent of people aged 55 years and over. Seventy per cent of men aged 15 years and over have accounts in the accumulation phase compared to 62 per cent of women. Of these groups of men and women with accounts in the accumulation phase, 86 per cent are employed (ABS 2009a). The self-employed are less likely to be contributing to, or drawing on superannuation. Of all those who own unincorporated business income, 71.7 per cent have accounts in the accumulation phase, 3.6 per cent are drawing on superannuation and 26.4 per cent have no superannuation coverage (ABS 2009a). Superannuation (or income derived from it) is less common among retirees than people currently of working age. Current retirees mostly rely on government pensions and allowances for their source of personal retirement income. Sixty-five per cent of retired men and 67 per cent of retired women cite government pensions and allowances as their predominant source of personal retirement income (ABS 2009a). The longer a person is retired, currently the more likely they are to rely on government pensions and allowances as their main source of income. Government pensions and allowances are the main source of income for 45 per cent of people who had retired less than five years ago, 62 per cent of people who had retired five to nine years ago, and 73 per cent of people who retired twenty or more years ago (ABS 2009a). This reflects both the running down of superannuation balances, and the fact that older-age cohorts, (particularly women) have not benefited from compulsory super. The Allen Consulting Group
3
ENHANCING FINANCIAL STABILITY AND ECONOMIC GROWTH: THE CONTRIBUTION OF SUPERANNUATION
Figure 1.3 shows that the average superannuation balance for non-retirees is significantly greater for men than women and greatest for men over sixty-five years of age. Figure 1.3
AVERAGE SUPERANNUATION BALANCES, NON-RETIREES, 2006
Source: Wilkins, Warren and Hahn (2000), HILDA unit record data
1.3
A brief history of superannuation
A range of factors has driven superannuation uptake over time. Most of all, legislative changes have had a large impact on superannuation coverage. Initially the coverage of superannuation applied only to a minority of employees; generally higher paid white-collar staff in large corporations, employees in the finance sector, public servants and members of the Defence Force (APRA 2007a). From the late 1970s and into the 1980s superannuation began to become more widely available as a result of claims lodged in the industrial relations arena (APRA 2007a). The pre-eminence of superannuation as the preferred financial vehicle for household savings is the product of a series of reforms by various Australian governments. Since the mid-1980s governments (both Labor and Coalition) have introduced a variety of initiatives to promote private retirement saving, primarily in superannuation. Some major initiatives, such as the phasing in of the Superannuation Guarantee, commenced during the course of one government but were not completed until well into the course of the following government:
The Allen Consulting Group
The first move towards compulsory superannuation took place in the context of the 1985 Wages Accord negotiations, when it was agreed that a 3 per cent wage increase that was deemed due on productivity grounds should be instead paid as a superannuation benefit. The then government viewed this as part of a longerterm strategy to give superannuation a central role in private saving (Edey and Gower 2000, p. 288).
4
ENHANCING FINANCIAL STABILITY AND ECONOMIC GROWTH: THE CONTRIBUTION OF SUPERANNUATION
In 1991, the government announced the ‘Superannuation Guarantee’ — from July 1992, employers were required to provide most employees with a minimum superannuation contribution of 3 per cent of earnings. The rate increased over time from 3 per cent to reach 9 per cent by July 2002. The Superannuation Guarantee led to a rapid expansion in the percentage of employees with superannuation, and their balances in the system.
In 1997, the then government introduced a broadly based savings rebate available to people who made personal superannuation contributions, or who earned net personal income from other savings and investments. The maximum rebate available was $225 in 1998-99 and $450 the following year. The rebate was abolished in 2000 as part of the government’s A New Tax System reforms.
In 2004, the then government introduced the superannuation co-contribution scheme, under which (with subsequent amendments) the government contributed up to $1.50 for every dollar of personal superannuation contributions made by low to middle income earners (up to $61,920 from July 2009), to a maximum of $1,500 per income year.
In 2006, choice of superannuation fund legislation was introduced to allow most employees the right to choose which superannuation fund their compulsory superannuation contributions are paid into.
In the 2006-07 Budget, Peter Costello, the then Treasurer released a plan to simplify and streamline superannuation. It included a suite of proposals designed to:
sweep away the tax complexities faced by retirees;
improve retirement incomes;
give greater flexibility over how superannuation savings could be drawn down; and
improve incentives to work and save. Superannuation benefits from taxed sources were made tax-free for those aged 60 and over. One objective of this measure was to provide an incentive for workers to delay retirement; it also had the effect of making superannuation a simpler and more attractive saving vehicle. Several other changes were made at this time including the abolition of the reasonable benefit limits.
The Allen Consulting Group
In the May 2009 budget, the Government announced that the age at which retirees could access the Age Pension would increase from 65 to 67 over time; the annual limits on pre-tax contributions were lowered; and temporary changes to the co-contribution scheme were introduced.
In May 2010 the report of the Australia’s Future Tax System Review (the Henry Review) into the Australian tax system was released. The Review recommended that employer contributions to superannuation be taxed at marginal personal income tax rates (with contributions increasing in net terms because tax would no longer be paid on contributions at the fund level), with a flat-rate refundable tax offset provided to individuals for all contributions up to an annual cap of $25,000 (indexed). It also recommended the halving of the tax rate on superannuation fund earnings to 7.5 per cent. 5
ENHANCING FINANCIAL STABILITY AND ECONOMIC GROWTH: THE CONTRIBUTION OF SUPERANNUATION
The Allen Consulting Group
The Government in its response to the Henry Review set out an alternative method for dealing with the equity issues related to tax concessions for superannuation and the need to increase the net contributions being made on behalf of employees. More specifically, the Government announced a phasing in of an increase in compulsory contributions from nine to twelve percent and the introduction of a tax rebate for the contributions tax on contributions made on behalf of those earning less than $37,000 a year.
In 2010 the Super System (Cooper) Review final report was released. It recommended reform of fund governance in general, and reform of the regulations appertaining to self-managed superannuation funds in particular. In December 2010 the Government announced its in principle response to the Report, indicating that amongst other things it would legislate the introduction of a requirement for funds to provide a simple, low-cost superannuation account called MySuper for employees covered by default arrangements.
6
ENHANCING FINANCIAL STABILITY AND ECONOMIC GROWTH: THE CONTRIBUTION OF SUPERANNUATION
Chapter 2
Superannuation and financial stability Chapter 2 describes the ameliorating effect on financial instability - such as was experienced worldwide during the GFC - of a country having a well-developed superannuation industry. The existence of a well-developed superannuation industry enhances financial stability by enabling companies to raise capital via share raisings rather than debt offerings, and because super funds are institutionally wired to take a more longer term view of their financial investments than other types of investors.
2.1
The Australian super industry’s growing investment presence
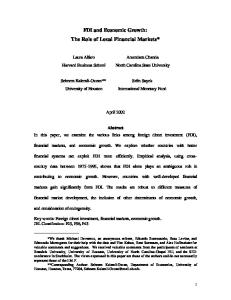
With aggregate assets of over $1.3 trillion dollars (as at March 2011) and large annual flows, superannuation impacts significantly on financial markets, particularly the Australian stock exchange (APRA 2011). Superannuation can stimulate investment, which enables Australian companies to expand and drives economic growth. From June 2002 to March 2011 total assets held by superannuation funds more than doubled from $518 billion to $1,357 billion (APRA 2009b and APRA 2011). Superannuation has been responsible for a significant proportion of the growth in Australia’s growing financial services and insurance industry. The superannuation industry has experienced the fastest growth amongst the finance and insurance industry. Superannuation currently accounts for 45 per cent of the finance and industry sector in Australia — as shown in Figure 2.1 below. As a significant contributor to this industry, it has helped drive strong growth in the sector, increasing Australia’s place as a southern hemisphere leader in finance and insurance (IBISWorld 2008). Figure 2.1
BREAKDOWN OF THE FINANCE AND INSURANCE INDUSTRY IN AUSTRALIA
Source: IBISWorld 2008
5
The Allen Consulting Group
5
IBIS World, Industry Report, Finance and Insurance in Australia, 2008 (as at November 2008).
7
ENHANCING FINANCIAL STABILITY AND ECONOMIC GROWTH: THE CONTRIBUTION OF SUPERANNUATION
The majority of superannuation firms are domestically owned and operated. The superannuation industry has directly created thousands of jobs. It is estimated that the industry accounts for around 60,000 jobs, predominantly in Sydney and Melbourne but with significant numbers in other capital cities and in regional centres such as Wollongong (IBISWorld 2008). The estimated market shares of the top four players in the superannuation industry totals 15 per cent, indicating a low level of industry concentration by the standards of most industries in Australia. AMP Limited is Australia’s largest retail and corporate superannuation provider, and one of the region’s most significant investment managers with more than $129 billion in assets under management. Another major superannuation provider is AustralianSuper, with an estimated market share of 1.5 per cent (IBISWorld 2008). There are fifteen Australian pension funds in the top 300 global pension funds, as 6 measured by consultants Towers Watson. In combination, the fifteen funds held assets of USD210 billion as at 2009, as shown in Table 2.1. Following the merger between AMP and AXA, AMP now has nearly $A70 billion in assets in the various superannuation funds for which it is trustee. It is not unusual for financial institutions offering retail superannuation products to offer a number of differently branded funds with a common trustee. On a consolidated basis a number of such providers would appear in the Global 300 Ranking. Table 2.1
AUSTRALIAN SUPER FUNDS IN GLOBAL 300 RANKING Top 300 Ranking
7
% of Top 300 assets
2009 Rank
2008 Rank
37
52
Future Fund
60.7
0.4
89
120
AustralianSuper
29.2
0.2
98
100
State Super
27.4
0.2
110
144
QSuper
24.8
0.2
123
155
UniSuper
22.8
0.2
170
230
First State Super
16.7
0.2
175
202
ARIA
16.2
0.1
181
251
REST
15.7
0.1
194
205
ESS Super
14.4
0.1
202
272
Sunsuper
13.9
0.1
206
271
Hesta
13.6
0.1
223
279
Cbus
13.0
0.1
285
na
Super SA
9.5
292
na
GESB
9.2
295
na
Telstra Super
9.1
Total
296.3
$US m
3.0
Source: Towers Watson
6 7
The Allen Consulting Group
Towers Watson press release, available at: http://www.towerswatson.com/australia/press/2746. Funds data as at June 2010.
8
ENHANCING FINANCIAL STABILITY AND ECONOMIC GROWTH: THE CONTRIBUTION OF SUPERANNUATION
In terms of domestic competition, the insurance and superannuation companies are experiencing fairly strong competition, with many fund managers vying for super funds (IBISWorld 2008). 2.2
The Australian super industry’s presence in various investment assets
Stock market
Superannuation funds hold a substantial portion of Australian shares by market capitalisation and this relationship has grown over time. The ASX has estimated that the proportion of Australian equities held by superannuation funds grew from 8 8.5 per cent in 1998 to 16.5 per cent in 2007 (ASX 2007). Based on the latest available data, the Allen Consulting Group estimates that superannuation equities accounted for about 29 per cent of total market capitalisation of the ASX in the 9 2009-10 financial year. This is consistent with trends in domestic investment more broadly. Total levels of domestic institutional investment (including banks, life and other insurance companies, superannuation funds and other financial institutions) grew from $34.1 billion (23.1 per cent of total investments) in 1988 to $600.6 billion (40.4 per cent of total investments) in 2007 (ASX 2007). By contributing to total market capitalisation, superannuation helps grow the available funds that can be used by Australian companies to invest and expand. Managed funds
Superannuation funds are the largest contributor to managed funds. As at the March quarter 2011, superannuation funds accounted for 71 per cent of all consolidated assets in managed funds, with public unit trusts, life insurance funds and other 10 funds comprising the remaining 29 per cent (ABS 2011). Recognition of the opportunities created by the growth in funds under management has driven significant global interest in establishing and building funds management operations in Australia. The size of the domestic industry, together with the availability of a highly skilled, multilingual workforce, strategic time zone and access to world class infrastructure, have proven critical factors in the decision by global investment houses and service providers to establish operations in Australia. Investment managers are coming to Sydney from all over, drawn by the prospect of ten11 $100 billion pension funds within 20 years—a fillip for Australia’s financial-services industry.
8
9
10 11
The Allen Consulting Group
Australian Stock Exchange, 2007, Submission to the inquiry into shareholder engagement and participation, Parliamentary Joint Committee on Corporations and Financial Services. This estimate is based on the following data: total market capitalisation of the ASX as at June2010 of $1.3 trillion (ASX 2010 – Annual Report, p. 14); total superannuation assets of $1.316 billion (APRA 2010 – Quarterly Superannuation Performance); 29% of superannuation assets invested in Australian equities (APRA 2010 - Annual Superannuation Bulletin, p. 7). ABS, Managed Funds, Australia, March quarter 2011, cat. no. 5655.0, Canberra. Economist Magazine online, Super Duper Supers, May 26 2011, available at: http://www.economist.com/node/18719616.
9
ENHANCING FINANCIAL STABILITY AND ECONOMIC GROWTH: THE CONTRIBUTION OF SUPERANNUATION
Private equity
Superannuation has also helped drive investment in venture capital and later stage private equity. Venture capital and later stage private equity is high risk capital directed towards businesses with prospects of rapid growth and/or high rates of return. Australian superannuation funds contributed 60 per cent of the total of funds committed toward venture capital and later stage private equity, or $10.4 billion of 12 the total $17.26 billion committed as at 30 June 2010. Of all funding committed to venture capital and later stage private equity in Australia, 93 per cent comes from Australia. Of all funds from Australia, Australian superannuation funds contribute 13 65 per cent of all venture capital and later stage private equity (ABS 2010). Superannuation funds invested in venture capital and later stage private equity vehicles are then invested in a wide range of industries, helping to drive growth in Australian businesses with prospects of rapid growth or high rates of return. Of the total value of nearly $8.8 billion invested in 2009-10, manufacturing and utilities, and finance and property industries were the predominant industries of investment, followed by health and services, transport and communications industries and construction industries (ABS 2010). Superannuation investments in the Australian financial sector
Superannuation is also invested in the financial sector, both as deposits in our Australian deposit taking institutions (ADIs) such as banks and building societies, as well as in the equity of ADIs. As of March 2011, superannuation funds had invested about $163 billion in ADI deposits. A further $16.8 billion was invested in the bonds of financial corporations (bank and non-bank), and $115 billion invested in the equity of financial corporations (bank and non-bank). This is a total of about $295 billion of superannuation invested in Australia’s financial sector, which is 22 14 per cent of all assets invested by the Australian superannuation industry. This is an important source of liquidity for Australian ADIs and it reduces the need for ADIs 15 to source wholesale funding from overseas.
12
13
14
15
The Allen Consulting Group
ABS, Venture Capital and Later Stage Private Equity, Australia, 2009-11, cat. no. 5678.0, Canberra, Table 1 at page 13. ABS, Venture Capital and Later Stage Private Equity, Australia, 2009-11, cat. no. 5678.0, Canberra, Table 1 at page 13. All figures from table 4 on page 13 of ABS, Managed Funds, Australia, March quarter 2011, cat. no. 5655.0, Canberra. There is a sizeable literature on the relationship of pension funds (as superannuation funds are called in the US) and financial liquidity and economic growth. On the relationship of financial (stock market) liquidity and economic growth, see Levine (1997), Financial development and economic growth: Views and agenda, Journal of Economic Literature, vol. 35(2), June, pp. 688-726 and on the importance of pension funds for financial liquidity, see Catalan et. al., Contractual savings or stock market development: Which leads? World Bank Working Paper, August 2000, available at: http://elibrary.worldbank.org/content/workingpaper/10.1596/1813-9450-2421.
10
ENHANCING FINANCIAL STABILITY AND ECONOMIC GROWTH: THE CONTRIBUTION OF SUPERANNUATION
2.3 The contribution of the Australian super industry to the stability of the Australian financial system Australia escapes the worst of the GFC
It is well known that Australia weathered the Global Financial Crisis (GFC) better than many other OECD countries. Table 2.2 shows how Australia compared in quantitative terms to other OECD countries during the GFC. The table shows that Australia’s unemployment rate has been substantially lower than the OECD average, while its GDP growth is substantially higher. Indeed, unlike most OECD countries, which experienced severe recession, Australia escaped a recession and appears rapidly to have returned to its pre-GFC economic situation of growth bumping up against supply and infrastructure constraints. Table 2.2
COMPARISON OF AUSTRALIA TO OECD AVERAGE (2009) Australia
OECD
Unemployment rate (% of labour force)
5.7
8.3
Employment rate (% of working age population)
72
64.8
Growth of real GDP
1.4
-3.3
Employment growth
0.3
-1.8
Source: OECD
16
The freezing of wholesale debt markets
The GFC radically changed the landscape of global capital markets. The collapse of Lehman Brothers in September 2008 was a key turning point and associated with a sharp reduction in available liquidity and investor appetite for debt securities. Globally, debt investors in general retreated to safe haven assets such as cash and AAA bonds, shunning asset-backed securities. On the financial side, one characteristic of the GFC was the high yield spike and corresponding scarcity of corporate debt. The GFC has led to a fundamental repricing of risk. The marginal cost of long term wholesale funding increased with credit spreads widening. Most corporate bonds of large Australian firms are raised in international markets (the Australian market is comparatively thin), and the yield of such bonds increased by about 400 per cent for non-bank corporates, seemingly overnight, as can be seen in Figure 2.2.
16
The Allen Consulting Group
Available at: http://www.oecd.org/document/28/0,3746,en_2649_37457_43200796_1_1_1_37457,00.html (figures last updated 6 July 2010).
11
ENHANCING FINANCIAL STABILITY AND ECONOMIC GROWTH: THE CONTRIBUTION OF SUPERANNUATION
Figure 2.2
AUSTRALIAN BOND SPREADS
Source: RBA – The impact of the financial crisis on the bond market (p. 58)
17
Record-level capital raisings during the GFC
A consequence of this sudden tightening (removal of liquidity) in the corporate bond market was that Australian firms seeking to raise capital had to do so through share raisings rather than through debt markets. Companies raise funds in a number 18 of ways: retained earnings, bank borrowings, debt markets, and equity markets. Increasing the amount of shares on a firm’s portfolio relative to its debt is one way to lower the firm’s ‘leverage’, which is the debt to equity ratio. With the price of corporate debt so high, many large Australian corporates sought to reduce their exposure to debt by deleveraging. By doing so, they reduced the riskiness of the portfolio of their funding and thereby reduced the probability of bankruptcy. This was especially important for Australia’s banks (see below). Few corporate bankruptcies in Australia meant less unemployment during the GFC.
17 18
The Allen Consulting Group
Available at: http://www.rba.gov.au/publications/bulletin/2010/jun/pdf/bu-0610-8.pdf. Reserve Bank Bulletin, October 2009 – Australian Corporates Sources and Uses of Funds, available at: http://www.rba.gov.au/publications/bulletin/2009/oct/1.html.
12
ENHANCING FINANCIAL STABILITY AND ECONOMIC GROWTH: THE CONTRIBUTION OF SUPERANNUATION
In order to deleverage, companies needed to issue new shares. But during that time the share market was also down compared to its recent average, thereby indicating a relative scarcity of demand for equities by the Australian investing community. And yet during 2008-2009, the Australian corporate sector experienced record share 19 raisings. It is a testament to the strength of Australia’s companies and their leadership, and to the strength of the capital markets, that Australian businesses have been able to raise $119.9 bn by equity issues between July 2008 and September 2009 and $77.1 bn since January this year. This record equity capital raising has allowed companies to repay debt and has undoubtedly helped to forestall foreclosures and promote credit growth through the Australian banking 20 sector.
The super industry was front and centre in funding corporate share raising
At a time when many companies sought to issue shares, the superannuation industry was an important buyer for those shares. There are a number of methods to raise shares: placements, share purchase plans, and rights issues amongst them. The choice of method depends on the context of the company board’s decision. During the GFC, speed was an important context, with overnight Wall Street prices playing an important role in board decisionmaking. The need for speed favours private placements to large institutional investors. Indeed, during the GFC these ‘off-market’ private placements were negotiated directly between the raising companies and large fund managers, often in just one or two days. The funding composition of different companies is also part of the context. At the aggregate level, retail investors directly own slightly less than 20% of all listed equities, with domestic institutions owning slightly less than 40% (and foreign 21 investors slightly more than 40%). The bulk of institutional investment is directed towards larger listed companies, particularly in the top 300 (out of nearly 2000 22 domestic listed companies).
19
20
21
22
The Allen Consulting Group
See the speech by John Broadbent, Head of Domestic Markets Department, RBA – Reconnecting Corporate Australia with Frozen Credit Markets, 10 November 2009, available at: http://www.rba.gov.au/speeches/2009/sp-so-101109.html. Speech by Belinda Gibson, Commissioner ASIC, to the Corporate Finance World Australia 2009 conference, 10 November 2009, Facilitating Capital Raising for Corporate Australia, available at: http://www.asic.gov.au/asic/pdflib.nsf/LookupByFileName/Speech-corporate-finance-world-australia-Nov2009.pdf/$file/Speech-corporate-finance-world-australia-Nov-2009.pdf. ASX Information Paper (29 January 2010), Capital Raising in Australia: Experiences and Lessons from the Global Financial Crisis, available at: http://www.asxgroup.com.au/media/PDFs/20100129_asx_information_paper_capital_raising_in_australia.pdf. Ibid.
13
ENHANCING FINANCIAL STABILITY AND ECONOMIC GROWTH: THE CONTRIBUTION OF SUPERANNUATION
In the 2008-09 record year, all three methods were utilised. Placements accounted for 43.4% of all capital raised ($38.2 billion), share purchase plans raised another 23 4.3% (or $3.8 billion), and the rest was via rights issue. Share purchase plans are offers to all shareholders, akin to placements (which usually only go to large institutional shareholders). Had all shareholders accepted the share purchase plans, the amount raised by that method ($36.6 billion) would have rivalled the amount raised by the private placements. The lack of take-up by retail shareholders showed 24 the depressed demand for shares in the equity markets as a result of the GFC. It has been mentioned that pension funds and insurance companies as a category 25 comprise 26% of the ownership of all ASX listed companies. The fact that private placements constituted nearly double that number - along with the fact that such placements were to large institutional investors - is evidence of the fact that the superannuation industry played a disproportionately large role in assisting corporate Australia to lower corporate risk during the GFC. Stabilising the banking sector
This record share raising activity was especially important for the banks, because a large part of the funds they use to finance loans is purchased on the local and overseas wholesale debt markets. The economy benefits from the commercial banking system. Specifically, banks facilitate the money market and reduce transaction costs by bringing together customers that lend money through their deposits to customers who require loans. But because deposits are not sufficient to cover all the loans that Australians want, banks also borrow in professional ‘wholesale’ markets to fill this ‘gap’ in their funding of loans to ordinary Australians. In order to fund the gap between deposit growth and domestic demand for credit by homebuyers and small businesses, Australian banks are significant borrowers in debt markets, both domestically and offshore. The GFC led to a fundamental repricing of risk. When overseas debt markets ‘froze’ (credit spreads widened alarmingly), Australian banks resorted primarily to 26 private placements to raise capital. Australian super fund managers (among other large institutional investors) during this period of private placements played its share in securing confidence in the Australian banking system at a time of 27 heightened global crisis and prevented possible bank bankruptcies and bank runs. By far the largest industry sector raising capital between 2008 and 2009 was the financial sector, dominated by raisings by the large four trading banks during the peak of the crisis and in the early stages of recovery. It was also a sector that was particularly reliant (in both dollar 28 and percentage terms) on the use of placements to raise capital.
23
24 25 26
27
28
The Allen Consulting Group
Belinda Gibson ASIC speech. Also, “[d]uring the worst of the crisis (six months to March 2009), placements made up 55% of the value of secondary raisings and rights issues 20%,” ASX Information Paper (29 January 2010) at page 18. Belinda Gibson ASIC speech. As at 30 June 2009. Source: ABS Cat. No 5232.0. ASX Information Paper (29 January 2010) at page 20, “The largest capital raisings during the past two years were by the big four banks [ . . . and] the banks relied largely on placements [ . . . ] for much of their funding. The banks’ access to overseas debt markets was never wholly reduced, and was supported by the Federal government’s ‘bank guarantee’. ASX Information Paper (29 January 2010) at page 19.
14
ENHANCING FINANCIAL STABILITY AND ECONOMIC GROWTH: THE CONTRIBUTION OF SUPERANNUATION
In late 2009, as the worst effects of the GFC were receding, the Reserve Bank of Australia was able to report: In addition to accessing a wide range of bond markets, Australian banks have continued to raise equity at a strong pace. In the past three months, $8 billion of equity has been raised, bringing banks’ equity raisings over the past year to a record $27 billion – well above the annual average since 2002 of around $4 billion. Most equity has been raised by placements of shares to institutional and retail investors, usually at modest discounts to prevailing market prices. 29 Investor demand for the additional equity has been strong.
2.4 Institutional investors and long-term investing strategies
It is well documented that superannuation funds adopt longer term investing 30 strategies than other types of investors. This is because the investment goal of superannuation funds is to maximise value at the time of a client’s retirement age 31 (or even later), not the day-to-day return on assets. It follows that growth in the volume of superannuation funds will increase the presence of long-term thinking in stock trading. The flow of funds into compulsory superannuation provides a steady stream of capital-seeking investment 32opportunities and has provided a source of demand for equity securities issued by companies.
A consequence of this is that superannuation funds, being invested in a company for the long haul, should be (and are) more concerned about corporate governance than 33 other types of investor. Another consequence is that the investing strategies of superannuation funds can act counter-cyclically to stock-price movements, and so reduce volatility in the stock 34 market. This is because long-horizon traders can afford to absorb short-term price fluctuations. This is especially so with regard to selling rather than buying, providing evidence that institutional investors are reluctant to realise losses.
29
30
31
32 33
34
The Allen Consulting Group
RBA, Statement of Monetary Policy – Domestic Financial Markets, August 2009, available at: http://www.rba.gov.au/publications/smp/2009/aug/html/dom-fin-mkts.html. World Economic Forum, The future of long term investing, page 16, available at: http://www.globalcorporateventuring.com/data/files/wef_futurelongterminvesting_report_2011.pdf. For a survey of the difference in investment beliefs between asset managers and pensions fund managers, see Koedijk and Slager, Do Institutional Investors Have Sensible Investment Beliefs?, Rotman International Journal of Pension Management, Vol. 2, Issue 1, Spring 2009, available at: http://www.top1000funds.com/attachments/315_sensiblebeliefs.pdf. ASX Information Paper (29 January 2010) at page 11. OECD Secretarial Note: Pension fund governance, investment strategies, and their role in corporate governance, page 5, available at: http://www.fiap.cl/prontus_fiap/site/artic/20070611/asocfile/20070611102152/pension_fund_investment_and_ its_role_on_corporate_governance__oecd_.pdf deHaan and Kakes, Momentum or Contrarian Investment Strategies: Evidence from Dutch institutional investors, DNB Working Paper, January 2010, available at: http://www.dnb.nl/binaries/242%20%20Momentum%20or%20Contrarian%20Investment%20Strategies_tcm46-229196.pdf.
15
ENHANCING FINANCIAL STABILITY AND ECONOMIC GROWTH: THE CONTRIBUTION OF SUPERANNUATION
The impact of increased large-scale institutional trading on stock market volatility 35 is empirically difficult to detect. In any event, the absolute level of stock market 36 volatility at any given time is neither socially good nor socially bad. Nonetheless, as discussed above, long-term investors’ comfort with counter-cyclical (or contrarian) investing strategies can help stabilise financial markets by providing liquidity at critical times (such as during the GFC, when there was a flight to 37 liquidity). This idea [of counter-cyclical investing] was echoed by many of the life insurers and pension funds that we spoke to who felt that they have historically played a countercyclical role in the 38 market by buying security as liquidity dried up.
A final consequence is that superannuation funds, having longer investment horizons, are more likely to invest in long-lived assets such as major infrastructure and small-cap, emerging companies (bottom-level venture capital) than other types 39 of investors. Superannuation funds also have the scale necessary to support entry into what can be large scale projects. The ability through scale to achieve diversification of investment portfolios is also important for investments in venture capital. These issues are considered in more detail in chapter 4.
35
36 37 38 39
The Allen Consulting Group
The effect on stock prices appears undetectable - see Lakonishok, Shleifer, and Vishny (1992) The Impact of Institutional Trading on Stock Prices, Journal of Financial Economics 32, 23-43 and the literature following that article. See also Box 5, page 39 of World Economic Forum, The future of long term investing (though the literature summarized there is mainly dealing with sovereign wealth funds). Stock price volatility in Australia appears to have declined in the 1980s and 1990s, but to have risen again recently: see Eichengreen and Tong, Stock Market Volatility and Monetary Policy: What the Historical Record Shows (2003) at page 28, available at: http://www.econ.berkeley.edu/~eichengr/research/sydneywithhui9sep26-03.pdf. The decline in stock market volatility during the 1980s is obviously unable to be attributed to the rise of superannuation funds backed by compulsory super contributions, which only became widespread in 1992 in Australia. Eichengreen and Tong (2003) at page 28. World Economic Forum, The future of long term investing, page 44. World Economic Forum, The future of long term investing, page 44. The future of long term investing, page 14. Also, ASFA, Challenges of Financing Infrastructure, May 2011.
16
ENHANCING FINANCIAL STABILITY AND ECONOMIC GROWTH: THE CONTRIBUTION OF SUPERANNUATION
Chapter 3
Increasing the Superannuation Guarantee – a beneficial and affordable reform Chapter 3 describes the reform the Federal government adopted in 2010, of announcing a phased increase of the Superannuation Guarantee from its current level of nine per cent to 12 per cent. The chapter describes how the reform will be good for future retirees (through an increased standard of living in retirement) and affordable for employers.
3.1 The proposed reform
Lifestyles of Australians in retirement are supported in three ways: the governmentfunded Age Pension, the Superannuation Guarantee (compulsory savings), and voluntary savings. The Age Pension provides basic support to those older Australians with no or moderate private income or assets. The Superannuation Guarantee (SG) requires individuals to save for their retirement and relates an individual’s retirement income to their time in the workforce and their wages while they are there. Under the SG, currently nine per cent of an employee’s remuneration is paid into a superannuation 40 fund to support their retirement. With voluntary savings, individuals choose how much they save, and the investment vehicle in which they save. Voluntary savings can include superannuation contributions above the SG and non-superannuation savings, such as deposits and real estates (including home ownership). The history of the rise of compulsory savings in Australia lies in the introduction of award superannuation in 1986, when industrial awards required individuals to have three per cent of their remuneration paid as superannuation contributions. The SG extended compulsory superannuation to all employees from 1992 as part of the Federal government’s 1991-92 Budget. The current level of the SG (nine per cent) was instituted in 2002. In 2010 the Government announced its intention to implement the policy of 41 increasing the superannuation guarantee from nine per cent to 12 per cent. The reform is sought to begin in 2013-14 and will be phased in over six years. The 42 majority of Australians supports this reform.
40
41
42
The Allen Consulting Group
The SG does not have to be paid if an employee earns less than $450 a month or on an amount of earnings above $38,180 a quarter. It also does not have to be paid to employees aged 70 years or older and certain employees less than 18 years. See the federal government’s May 2010 press release at: http://www.treasurer.gov.au/DisplayDocs.aspx?doc=pressreleases/2010/028.htm&pageID=003&min=wms&Y ear=&DocType=0. Mercer press release, available at: http://www.mercer.com.au/press-releases/1412130 and ASFA’s October 2010 research (67 per cent of adult Australians support higher contributions than the current minimum payment on nine per cent of wages) – see also, http://www.superannuation.asn.au/ArticleDocuments/116/rc1012-ASFACommunityAttitudesResearch.pdf.aspx
17
ENHANCING FINANCIAL STABILITY AND ECONOMIC GROWTH: THE CONTRIBUTION OF SUPERANNUATION
In this chapter we outline why this reform is important for improving the welfare of future retirees while being affordable for employers. 3.2 Beneficial for future retirees (and so, for all current Australian workers)
Increasing the SG from nine to twelve per cent will ensure that future retirees will have a higher standard of living in retirement. Expectations regarding income in 43 retirement and life expectancy are continually rising. The current Age Pension per 44 year is $17,443.40 for singles and $26,296.40 for couples. Yet recent polling shows that half of those currently in the workforce want more than $40,000 a year 45 in retirement, while a third want more than $50,000 or more a year. Even after reviews and possible increases, the Age Pension will not be enough to match 46 Australians’ lifestyle expectations for their future retirement. Currently, fewer than 47 10 per cent of those aged over 65 receive over $40,000 per year. Retirement standards
The ASFA Retirement Standard provides detailed annual budgets for both ‘modest’ and ‘comfortable’ retirement living standards for Australians, as outlined in Table 48 3.1.
43 44 45 46
47 48
AFA 2008, Will you get what you want, need or deserve in retirement?(ASFA 2008) See http://www.centrelink.gov.au/internet/internet.nsf/payments/age_rates.htm. ASFA 2008 and ANOP polling. The age pension is currently being reviewed. See http://www.fahcsia.gov.au/sa/seniors/progserv/PensionReview/Pages/default.aspx. ASFA 2008. Modest lifestyle is defined as: Better than the Age Pension, but still only able to afford fairly basic activities. Comfortable lifestyle is defined as: Enabling an older, healthy retiree to be involved in a broad range of leisure and recreational activities and to have a good standard of living through the purchase of such things as; household goods, private health insurance, a reasonable car, good clothes, a range of electronic equipment, and domestic and occasionally international holiday travel.
The Allen Consulting Group
18
ENHANCING FINANCIAL STABILITY AND ECONOMIC GROWTH: THE CONTRIBUTION OF SUPERANNUATION
TABLE 3.1: ASFA RETIREMENT STANDARD SPENDING Modest lifestyle single
Modest lifestyle couple
Comfortable lifestyle single
Comfortable lifestyle couple
Housing – ongoing only
$55.96
$53.71
$64.85
$75.18
Energy
$30.62
$40.67
$31.08
$42.15
Food
$72.78
$150.75
$103.97
$187.14
Clothing
$17.62
$28.61
$38.14
$57.22
Household goods and services
$26.02
$35.28
$73.19
$85.74
Health
$33.12
$63.92
$65.71
$115.97
Transport
$88.63
$91.14
$132.07
$134.59
Leisure
$73.03
$108.80
$221.31
$303.28
Communications
$9.16
$16.03
$25.17
$32.04
Total per week
$406.94
$588.91
$755.49
$1,033.31
Total per year
$21,218
$30,708
$39,393
$53,879
Source: ASFA 2010, December Quarter 2010
49
The Age Pension alone is not enough
Using the ASFA Retirement Standard, a single person needs around $407 per week, and a couple needs to spend around $589 per week to fund a modest lifestyle. This is higher than the Age Pension, which currently pays $335.45 per week for a single 50 person and $505.70 per week for a couple. According to the ABS, in 2008, 60 per cent of retirees received gross personal 51 weekly income from all sources of less than $300 per week. Comparing the spending needed according to the ASFA Retirement Standard to actual income enjoyed by retirees indicates that less than 17.5 per cent of retirees without 52 superannuation achieve a comfortable lifestyle, as shown in Figure 3.1.
49 50
51
52
The Allen Consulting Group
Available at: http://www.superannuation.asn.au/RS/default.aspx. See http://www.centrelink.gov.au/internet/internet.nsf/payments/age_rates.htm.It is important to note that the ASFA retirement standard is based on retirees owning their own home outright. This also shows in the amount of money budgeted for housing expenses. See http://www.abs.gov.au/AUSSTATS/
[email protected]/Latestproducts/6361.0Main%20Features2Apr%20to%20Jul%20 2007%20(Reissue)?opendocument&tabname=Summary&prodno=6361.0&issue=Apr%20to%20Jul%202007%20(Reissue)&num=&view=. See also Clare, The Age Pension, Superannuation and Australian Retirement Incomes, ASFA Research Paper (December 2008), available at: http://www.superannuation.asn.au/ArticleDocuments/116/rc0901-agepension.pdf.aspx.
19
ENHANCING FINANCIAL STABILITY AND ECONOMIC GROWTH: THE CONTRIBUTION OF SUPERANNUATION
Figure 3.1
ASFA RETIREMENT STANDARD AND STANDARDS OF LIVING
Source: ASFA and ABS 2009
53
It follows that the SG is a fundamental component of ensuring that future retirees can retire with at least a modest lifestyle. A nine per cent superannuation guarantee is not enough
The following table shows that the current level of the SG (nine per cent) is not sufficient to ensure that Australians are able to retire with a comfortable lifestyle. Table 3.2
LEVELS OF CONTRIBUTIONS NEEDED Single
Couple
Modest lifestyle
Yes
Yes
Comfortable lifestyle
No
No
Yes
Yes
9% Super Guarantee, for person on $50K or $100K
12% contributions, household income $100K Comfortable lifestyle Source: ASFA 2008
53
The Allen Consulting Group
Australian Bureau of Statistics, Employment Arrangements, Retirement and Superannuation, Australia, Apr to Jul 2007 (Re-issue),Cat. No. 6361.0, available at: http://www.abs.gov.au/AUSSTATS/
[email protected]/productsbyCatalogue/48C5E083D6820E2CCA257575001C481 B?OpenDocument.
20
ENHANCING FINANCIAL STABILITY AND ECONOMIC GROWTH: THE CONTRIBUTION OF SUPERANNUATION
Australia’s current policy setting for retirement income policy will generate low incomes by international standards. OECD modelling shows that Australia’s current policy settings will provide a ‘replacement rate’ for an average Australian income 54 earner entering the labour market in 2006, of just 41.6 per cent. This compares to 55 an OECD average of 59 per cent. It also should be noted that since compulsory superannuation was first introduced there has been a significant increase in life expectancy. In 1983, a Australian female reaching the age of 65 could expect to live on average for another 18 years, while an Australian male could expect to live for a further 14 years. By 2002, these figures had risen to 21 years for females and 18 years for males. Even if nine per cent contributions were sufficient when the SG was announced, then the increase in life expectancy of between about 20 per cent (for females) and 30 per cent (for males) at age 65 implies that a substantial increase in the rate of the SG is required. 3.3 Acceptable to workers
The purpose of saving is to reduce current consumption in order to be able to increase consumption in the future (during retirement). It follows that it cannot be an automatic criticism of a policy to increase compulsory savings that it might make workers slightly worse off compared to what they would otherwise be able to spend prior to retirement. [T]he increased payments are likely to fall on the employee, either directly from their wages or, if the SG is increased, potentially through reduced wages growth. An implication of increasing compulsory savings is that it will require individuals to have a lower standard of living during 56 their working life, to increase their standard of living in retirement.
Most people are myopic when it comes to managing their finances and if left to their own devices are likely to put off saving for retirement until later in life. In particular, most young people would be unlikely to save any money for retirement unless they were required to do so. However, various survey findings indicate that people support measures which compel them to save. The literature on household saving decisions offers some cause for concern that an under-saving bias may be an important feature of household behaviour. Theorists argue that people choose immediate pleasures and want ‘instant gratification’ instead of waiting for larger rewards. Consumers often display a high degree of impatience and short-sightedness when making decisions about the future. One example is of a person who tends to splurge today and vow to exercise/diet/save tomorrow (Laibson 2005). This sort of attitude induces consumers to follow a path of least resistance, and is therefore argued to create a general bias towards undersaving relative to the optimum.
54
55
56
The Allen Consulting Group
‘Replacement’ rates compare an individual’s spending power before and after retirement. The principle behind the concept is that an individual’s standard of living in retirement should be a reasonable proportion of their standard of living during their working life. They can be calculated using a variety of methodologies. See Australia’s future tax system, Retirement income, Consultation paper, Appendix D: Measures of retirement incomes. ASFA, Spotlight on Henry – A comparative analysis of the Henry recommendations with the proposed increase of the superannuation guarantee to 12 per cent, May 2011 (ASFA 2011). Australia’s future tax system, Retirement income - consultation paper, at page 19.
21
ENHANCING FINANCIAL STABILITY AND ECONOMIC GROWTH: THE CONTRIBUTION OF SUPERANNUATION
These theoretical results seem consistent with survey evidence suggesting that households tend to hold assets that cannot easily be converted to cash (especially houses) and also frequently borrow with credit cards that involve relatively high interest rates (Laibson, Repetto and Tobacman 2003). It also helps to explain why people fail to plan rationally for retirement and/or systematically under-estimate how much saving will be needed to achieve their aspirations. For example, studies in the United States show that of the employees who receive employer-matching contributions, half of the employees contribute below the match threshold, forgoing match payments that average 1.3 per cent of their annual pay (Choi, Laibson and Madrian 2005). Even providing the undersavers with specific information about the ‘free lunch’ had little impact. Besides encouraging people to save, making it hard to access those savings is one of the main benefits of superannuation. In this way the superannuation funds, being ‘locked away’, act as a ‘pre-commitment technology’ (to use the jargon of behavioural economics) for workers aware of their own myopia with respect to saving for the future. Using the terms of a classical legend (and a very early recorded case of behavioural economics), just as Ulysses in Homer’s Odyssey asked his crew to tie him to the mast (the ‘pre-commitment’) while their boat sailed past the island of the sirens, so workers are better off with some compulsion in directing part of their current earnings into an untouchable savings account (the 57 ‘pre-commitment’). The high level of community support for compulsory superannuation is a less glamorous but just as needed form of ‘pre-commitment’. In principle, generally, assets in a person’s superannuation account are locked until they reach the preservation age, which is 55 for those born before 1960, increasing to 60 for those born after 1964. In certain very limited circumstances assets may be released early; the rules are administered by the trustees of individual superannuation funds, and by the Australian Prudential Regulation Authority (APRA). A gradual phasing of the increase in the SG also means that the impact on take home wages will be quite small in any given year. This will be especially so given that superannuation contributions receive favourable tax treatment relative to remuneration taken as wages. Individuals will also generally be receiving wage increases over the period the SG is to be increased. Nominal wages will rise over the period. Many employees will have higher real wages and disposable income at the end of the transition period than they did at the start of the transition despite more of their remuneration being paid as superannuation contributions. As noted above, the popularity of the policy to increase the SG indicates that people recognise their own myopia and need for ‘pre-commitment’ devices in savings 58 technology.
57
58
The Allen Consulting Group
Thaler and Sunstein, Nudge: Improving decisions about health, wealth and happiness, Yale University Press, New Haven, CT, 2008. Mercer press release, available at: http://www.mercer.com.au/press-releases/1412130 and ASFA’s October 2010 research (67 per cent of adult Australians support higher contributions than the current minimum payment on nine per cent of wages).
22
ENHANCING FINANCIAL STABILITY AND ECONOMIC GROWTH: THE CONTRIBUTION OF SUPERANNUATION
3.4 Affordable for employers
When assessing the affordability of an increase in the SG for employers, it is important to distinguish between the short run and long run. In the long run there will be no effect on employers, because employers will pass on the burden of increase either in the form of price rises on the goods and services they sell, or in the form of lowered wages (or wage growth) for their employees, or 59 both. All employers will face the same superannuation obligation so no employer will suffer any specific disadvantage flowing from it. Increasing the Superannuation Guarantee is like imposing a (pure) payroll tax, and it is well-known in the economic literature that such taxes are among the most 60 efficient taxes available to government – in the long run they are known to impart minimal distortions (deadweight loss) on an economy, leading to no change in employment, profits, international competitiveness, or in the allocation of capital 61 and labour in firm production. While the business community has generally opposed payroll taxes, Australian economists 62 have often argued that these taxes are relatively efficient.
The legal incidence of a payroll tax – as with the SG – falls on employers, but the economic incidence (the actual burden) is passed on to workers and customers. Confusing the legal and the economic incidence of a tax explains its bad press in certain business circles. 63
The payroll tax is one of the most unjustly maligned in the current tax armoury.
Short run
An increase in the SG could increase employer costs, especially in the short term. An inability on the part of individual employers to absorb such costs could lead to 64 instances of employee retrenchment or hiring freezes in the short run.
59
60
61
62
63
64
The Allen Consulting Group
It was mentioned in section 3.3 that the lowered consumption due to lowered wages arising from an increased SG is the point of the policy reform, since basic economics tells us that only by sacrificing consumption today can we hope to consume more in the future. See Irving Fisher, The Theory of Interest (1930). Lowered wages from what they would otherwise have been are thus a feature - not a bug - of the reform. The emphasis is on the qualifier ‘pure’ – the payroll taxes levied by Australian States invariably possess welfare-distorting exceptions. The literature goes back to Samuelson (1961), A new theorem of nonsubstitution, pp. 407-427 in Money, Growth and Methodology, vol. 20, Lund Social Science Studies, Lund, Sweden, CWK Gleerup, reprinted in The Collected Scientific Papers of Paul A. Samuelson, MIT Press, Cambridge, 1965, pp. 520-535. Dixon et. al., Payroll taxes: thresholds, firm sizes, dead-weight losses and Commonwealth Grants Commission funding, Economic Record, Vol. 80, No. 250, pp. 289-301, September 2004, draft available at: http://www.monash.edu.au/policy/ftp/report/rp0011.pdf. Brennan, 1990, Commentary, in C. Walsh (ed.) Issues in State Taxation, Centre for Research on Federal Financial Relations, ANU, Canberra, pp. 93-100. Australia’s future tax system, Retirement income, Consultation paper at page 20.
23
ENHANCING FINANCIAL STABILITY AND ECONOMIC GROWTH: THE CONTRIBUTION OF SUPERANNUATION
However, the fact that the increase in the SG will be phased in over six years provides assistance to employers in planning to adapt to its introduction. The impact on wages costs in any one year will be small. SG contributions will be phased in very gradually with 0.25 percentage point rises in 2013-14 and 2014-15 and 0.5 per cent increases after that. Additionally, the already sizeable proportion (25 per cent) of employees who already have superannuation contributions greater 65 than nine per cent will ameliorate the effect. The Government has also announced that it will be reducing the company tax rate and also providing accelerated depreciation provisions for small businesses. Both of these measures will assist employers deal with any cash flow issues that might arise in the short term from an increase in the SG. Long run
In the long run, markets and factors of production adjust so that employers are no better or worse off than they were before the introduction of the rise of the SG. The logic is the same as for a payroll tax, about which there is an established economic 66 literature. The long run effect of a payroll tax is either to be passed on to employees, or to be passed on to customers in the form of higher prices, or both. If it is passed on to employees, then it becomes a de facto flat rate income tax, the 67 most efficient type of income tax one can have. If it is passed on to customers in the form of higher prices, then it becomes a de facto consumption-based value-added tax, a tax well known for its relative 68 efficiency benefits. For equal revenue taxes imposed on a comprehensive base at a single rate, and making standard incidence assumptions, the effects of the GST and payroll tax must indeed be virtually 69 identical.
At worst, the long run effect of a payroll tax is to be a combination of two taxes well known in the economics literature to be relatively efficient. In particular, it is not the case (as is often stated in business circles) that a payroll tax – and, by analogy, raising the SG - is a tax on employment. Indeed, the theoretic economic literature suggests that it is likely to increase employment by lowering the 70 real wage, and empirical modelling appears to confirm that.
65 66
67 68
69
70
The Allen Consulting Group
ASFA March 2010. See M Ryan (1995), What future for payroll taxes in Australia? Treasury Research Paper No. 10, Treasury, Canberra. The regressivity of flat rate income taxes is an issue separate from its efficiency properties. This analysis goes back to Shoup (1969), Public Finance, Aldine, Chicago, at pp. 266-269, 407-409. See also, Chris Murphy, Payroll tax: Is it as good as a VAT or as bad as a sales tax?Econtech report for ACCI, 23 June 1998, available at: http://www.econtech.com.au/information/Tax/ACCI_payroll%20tax-reportf.pdf. Head (ed.), 1993, Fightback! An Economic Assessment, Australian Tax Research Foundation, Sydney, at page 8. See NSW Treasury, Office of Financial Management, The Case for Payroll Tax, (September 1999) at pp. 8-9, available at: http://www.treasury.nsw.gov.au/__data/assets/pdf_file/0017/6650/TRP99-3_Pay_Roll_Tax.pdf, and Chapman and Vincent (1987), Payroll taxes in Australia, Part II: an economy wide approach to estimating the effects of their removal, Economic Analysis and Policy, Vol. 17, pp. 149-177.
24
ENHANCING FINANCIAL STABILITY AND ECONOMIC GROWTH: THE CONTRIBUTION OF SUPERANNUATION
3.5 Affordable for the taxpayer
Recent research published by the Australian Treasury (Gruen and Soding, 2011) explores the impact of compulsory superannuation on both national savings and on the Commonwealth Budget. The authors explain that the public sector forgoes tax revenue that otherwise would have been collected had compulsory super contributions been paid instead as wages to employees. This forgone tax revenue interacts with the Federal government's fiscal strategy in an important way. The Federal government’s fiscal strategy commits it to achieve budget surpluses on average over the medium term. It follows that any budget shortfall arising from the tax-preferred status of compulsory superannuation will be offset elsewhere in the budget, on average over the medium term. The boost to private saving therefore translates (on average over time) to the same boost to national saving because the public sector makes good any shortfall in tax revenues elsewhere in the budget. The current estimated boost to private (national) saving is about 1.5 per cent of GDP, rising significantly over the next decade, as the Superannuation Guarantee rises gradually from 9 to 12 per cent. The public sector's contribution to private (and therefore national) saving as a consequence of the compulsory superannuation system is shown by the blue line in Figure 3.2. As previously mentioned, this public sector contribution arises from the tax-preferred status of compulsory super. The public sector's contribution is estimated to be about 0.4 per cent of GDP currently, rising gradually to nearly 0.7 per cent of GDP by the end of the decade, and then staying around that level to the middle of the century. Figure 3.2: Public Sector Contribution to National Saving and the Net Fiscal Cost
Source: Treasury.
The estimated net fiscal cost to the budget, shown in the red line in Figure 3.2, is smaller than the public sector's contribution to private saving, because budget savings arising from the compulsory super system reduce the net fiscal cost of The Allen Consulting Group
25
ENHANCING FINANCIAL STABILITY AND ECONOMIC GROWTH: THE CONTRIBUTION OF SUPERANNUATION
compulsory super. The net fiscal cost is estimated by Treasury to peak at less than 0.5% of GDP before gradually falling to less than 0.2% of GDP. In comparison the current fiscal cost of the Age Pension is around 2.7 per cent of GDP and this is expected to increase to around 3.9% of GDP by 2050.
The Allen Consulting Group
26
ENHANCING FINANCIAL STABILITY AND ECONOMIC GROWTH: THE CONTRIBUTION OF SUPERANNUATION
Chapter 4
Superannuation and investment Chapter 4 describes the impact of compulsory superannuation on real investment within the Australian economy. This impact is both direct and indirect. The direct impact is through funds investing directly in real assets (like property or infrastructure projects) as part of their investment portfolios. Indirect investments include funds investing in the share market. This chapter describes the impact of invested superannuation savings on national investment (public and private), and provides some case studies of major direct real investments by funds.
4.1 Superannuation’s role in supporting Australian investment
Australia’s compulsory superannuation regime continues to play a significant role in funding Australia’s increasingly pressing private and public infrastructure needs, and that role will only increase in the future. Australian superannuation funds private sector investment via investments made either directly or through investment managers on the stock exchange. This is currently especially important due to the private sector investment boom Australia is experiencing with the current historically unprecedented mining boom a major contributor to that. Australian superannuation is also an increasingly important player in funding muchneeded public sector infrastructure. This is a role that is likely to increase in the future, as more and more superannuation funds allocate part of their portfolios to infrastructure investment, and as fund-consolidation enables the funding of investment of scale. An aging population will also be seeking the type of longlived, low risk, and moderate reward investments which large-scale public infrastructure projects provide. 4.2 Private investment
Australia’s accumulated superannuation funds much-needed private-sector infrastructure investment. As was explained in section 2.2, Australians’ superannuation is invested in many different types of asset classes, but especially in corporate equities (on the Australian stock exchange) and bonds. Australian companies fund their private investment needs with these funds. 4.2.1
Shares and corporate bonds
When a fund manager or superannuation fund buys shares – or equities – what is purchased is ownership of part of a company and shares in its future. Fund managers and analysts generally consider shares a growth asset within the portfolio of investment assets. This means they offer potentially high asset class returns. But share prices can also experience dramatic highs and lows over the short term.
The Allen Consulting Group
27
ENHANCING FINANCIAL STABILITY AND ECONOMIC GROWTH: THE CONTRIBUTION OF SUPERANNUATION
Bonds are also known as fixed-interest securities. They guarantee to pay a regular amount of money and repay your investment at a pre-set date in the future, known as the maturity date. Bonds are generally regarded as a lower-risk asset class investment than shares or property but this will depend on the credit risk status of the issuer. Corporations issue bonds to investors when they want to borrow money (bond-holders are lenders). Fund managers can and do invest in both international and Australian shares and international and Australian corporate bonds. However the evidence shows that most fund managers invest the majority of their equity and bond assets in 71 Australian companies. Indeed, according to the Australian Bureau of Statistics, the overwhelming majority (about 85 per cent) of superannuation funds are invested in 72 Australia - across all asset classes. For example, Unisuper, the industry super fund which focuses on Australia's higher education and research sector, in 2010 held 63 per cent of all its equities in Australian firms and 74 per cent of all its corporate bonds in bonds issued by 73 Australian firms. For the superannuation industry as a whole, in 2010, 29 per cent of all investment in equities was in Australian companies and 10 per cent of all investment in corporate 74 bonds was in bonds issued by Australian companies. 4.2.2
Property – listed and direct
Fund managers consider property to also be a growth asset class, offering the potential for high asset class returns on both capital growth and income. Property can be a direct investment in the actual asset – just like when someone buys a whole house as an investment in the property. But fund managers (and, increasingly, individuals) can also invest in listed property investments that are managed property assets. By doing this, a fund manger can have a growth asset that is still relatively easy to buy and sell and yet gives exposure to the otherwise relatively illiquid property asset class. Total direct investment in property – land, buildings and equipment – by the 75 superannuation industry by March 2011 was 6.1 per cent of all investment. 4.2.3
The mining boom
Australia’s current mining boom requires historically unprecedented private infrastructure and other capital investment. Australian superannuation is helping to fund that.
71 72
73
74 75
The Allen Consulting Group
See ABS, Managed Funds, Cat. No. 5655.0, at p. 13. See ABS, Managed Funds, Cat. No. 5655.0, at p. 13. This issue is also considered in section 5.2 below, especially in the footnotes. See page 43 of the 2010 Report to Members, available at http://www.unisuper.com.au/download.cfm?oid=0F033766-5056-BE7A-AC0984650DBAE70E. See Table 4.2 below. Data from APRA. See ABS, Managed Funds, Cat. No. 5655.0, at p. 13.
28
ENHANCING FINANCIAL STABILITY AND ECONOMIC GROWTH: THE CONTRIBUTION OF SUPERANNUATION
For example, in the Pilbara region of upper Western Australia – Australia’s premier iron ore mining region – mining companies are investing huge sums of money in order to build infrastructure like heavy-haul railways over large distances, ports, 76 airports, and mines. The Pilbara is crucial to the economy of the State and the nation. It is the source of two of the largest export revenue earners – iron ore and liquefied natural gas. The value of the Pilbara’s iron ore and petroleum products 77 amounted to more than $38 billion in 2007-08. Much of the infrastructure needs of the mining industry are being provided by the private sector. Private corporations in turn obtain the enormous funds needed for such large-scale infrastructure by issuing shares and bonds to major institutional investors – like superannuation funds – and retail investors. For example, Cbus, one of Australia’s largest superannuation funds (with its origins in the construction industry) has both BHP Billiton and Rio Tinto (the two largest 78 iron ore miners in the Pilbara) in its list of top 10 Australian share holdings. The same is true for Unisuper, one of Australia’s largest superannuation funds (with its 79 origins in the higher education sector). Indeed, the same is true for most of the 80 major funds, including retail sueprannuation. 4.3 Case studies of direct property investment
Some of the largest funds are direct owners of landmark properties around the country. We list examples from the invested properties of four of Australia’s top-15 81 super funds. 4.3.1
Unisuper
UniSuper is the industry super fund dedicated to all who work in Australia's higher education and research sector. With over 470,000 member accounts and $25.4 billion in assets (at 30 June 2010), they are one of Australia's largest superannuation 82 funds. From Unisuper’s 2010 Report to Members, Unisuper’s direct investment in property and infrastructure assets constituted about 7.5 per cent of its total assets 83 under investment.
76
77
78
79 80
81 82 83
The Allen Consulting Group
See (to give just one example) the recently-announced investment plans of BHP Billiton: http://www.theaustralian.com.au/business/mining-energy/bhp-billiton-approves-us74bn-iron-ore-investmentin-was-pilbara/story-e6frg9df-1226027814345. There is also much investment activity by the small-cap miners: see page 45 ff of the May 2009 report by ACILTasman for the 2020 Project of the Minerals Council of Australia, available at: http://www.minerals.org.au/file_upload/files/resources/vision2020/MCA_2020_Vision_Full_Report.pdf. See page 38 of the May 2009 report by ACILTasman for the 2020 Project of the Minerals Council of Australia. As at 21 March 2011. See http://cbussuper.com.au/investments/how-cbus-invests-your-money/what-we-investin#top%20ten. See http://www.unisuper.com.au/investments/our-investments/australian-international-shares. For another example, see Australian Super, at http://www.australiansuper.com/investments_investmentprocesses_share-holdings_australian-shares-exposure.aspx. See Table 2.1 in chapter 2. See http://www.unisuper.com.au/about-us. See page 43 of the 2010 Report to Members, available at http://www.unisuper.com.au/download.cfm?oid=0F033766-5056-BE7A-AC0984650DBAE70E.
29
ENHANCING FINANCIAL STABILITY AND ECONOMIC GROWTH: THE CONTRIBUTION OF SUPERANNUATION
Unisuper’s property portfolio includes Australian and international listed property securities and a range of Australian unlisted investments, including directly held land and buildings, and interests in unlisted pooled funds. They invest primarily in 84 the office, retail and industrial property sectors. Among its extensive list of direct property investments around the country, UniSuper owns (as at 31 December 2009) 50 per cent (along with the Stockland property investment group) of Macquarie Place, Sydney NSW. This is an office building in the heart of Sydney’s CBD. Figure 4.1 shows the office building. Figure 4.1
7 MACQUARIE PLACE
Source: Stockland
4.3.2
85
Cbus
Cbus has its origin as the industry superannuation fund for the construction, building, infrastructure and allied industries. It was established in 1984, but is now open to anyone. Cbus has over $16 billion in funds under management, more 86 than 600,000 members and more than 70,000 participating employers. Through CbusProperty Pty Ltd, a wholly owned subsidiary, Cbus invests directly in 87 property around the country. Cbus’ direct investment in property constituted about 88 15 per cent of its total assets under investment. Cbus also invests in infrastructure, and its direct investment in major infrastructure (like ports and airports) was around 89 13 per cent.
84 85 86 87 88
89
The Allen Consulting Group
For the full list of properties, see http://www.unisuper.com.au/investments/our-investments/property. http://www.stockland.com.au/leasing-and-tenants/office/nsw/7-macquarie-place-sydney.htm See http://cbussuper.com.au/about-cbus. See http://www.cbusproperty.com.au/Portfolio.aspx. See http://cbussuper.com.au/__data/assets/pdf_file/0019/24184/110324-What-we-invest-in-table-of-assetclasses.pdf (growth option - as at the 01/07/10). See http://cbussuper.com.au/__data/assets/pdf_file/0019/24184/110324-What-we-invest-in-table-of-assetclasses.pdf (growth option - as at the 01/07/10).
30
ENHANCING FINANCIAL STABILITY AND ECONOMIC GROWTH: THE CONTRIBUTION OF SUPERANNUATION
Among its list of direct property investments around the country, Cbus owns (as at 15June 2011) 8 Exhibition Street, Melbourne. This is a largeoffice building in the heart of Melbourne’s CBD, housing major companies like Ernst and Young and UBS. Figure 4.2 shows the office building. Figure 4.2
ERNST AND YOUNG BUILDING – 8 EXHIBITION STREET, MELBOURNE
Source: Cbus Property
4.3.3
90
AustralianSuper
AustralianSuper is one of the largest industry superannuation funds in Australia, with more than 1.5 million members drawn from over 120,000 workplaces and $32 91 billion in funds under management. 92
AustralianSuper invests directly in property around the country. Their direct investment in property constituted about 12 per cent of its total assets under 93 investment. AustralianSuper also invests in infrastructure, and its direct investment 94 in major infrastructure (such as ports and airports) was around 14 per cent. Among its list of direct property investments around the country, AustralianSuper owns (as at 15 June 2011) the large office building, MLC Centre, in the Sydney CBD. Figure 4.3 shows the office building.
90 91 92 93 94
The Allen Consulting Group
See http://www.cbusproperty.com.au/Portfolio.aspx. See http://www.australiansuper.com/about.aspx. See http://www.cbusproperty.com.au/Portfolio.aspx. See http://www.australiansuper.com/investments_investment-options_balanced.aspx (balanced option). See http://www.australiansuper.com/investments_investment-options_balanced.aspx (balanced option).
31
ENHANCING FINANCIAL STABILITY AND ECONOMIC GROWTH: THE CONTRIBUTION OF SUPERANNUATION
Figure 4.3
MLC CENTRE, SYDNEY
Source: Wiki Commons
4.3.4
95
AMP
AMP Capital manages over $16.2 billion in direct real estate assets, largely on behalf of superannuation funds. These include commercial and industrial properties such as Angel Place, NAB House, AMP Centre and Thomas Holt Drive in Sydney, Bourke Place and Collins Place in Melbourne and the Coronation Drive Office Park in Brisbane. AMP Capital Shopping Centres owns 36 properties in Australia and New Zealand with over $8.9 billion (AUD) of assets under management. This incorporates over 1.5 million square metres of retail floor space which generates over $5.9 billion in annual sales. The shopping centres are occupied by over 2,800 retailers.
95
The Allen Consulting Group
See http://upload.wikimedia.org/wikipedia/commons/5/5c/Mlc_center_syd.jpg.
32
ENHANCING FINANCIAL STABILITY AND ECONOMIC GROWTH: THE CONTRIBUTION OF SUPERANNUATION
Examples of shopping centres in the AMP portfolio include Warringah Mall, Macquarie Centre, Marrickville Metro, Riverside Plaza, Cessnock Plaza and Dapto Mall in New South Wales. In Victoria, there are Knox Shopping Centre, Malvern Central, Gateway Plaza and Casey Central. In Queensland there are Pacific Fair, Mt Ommaney Centre and Sugarland Shoppingtown. There also are numerous other shopping centres throughout the rest of Australia owned by AMP Capital.
4.4 Infrastructure investment 4.4.1
Superannuation and infrastructure investment
Investment in infrastructure plays a fundamental role in enhancing the nation’s productivity. Investment in public assets like roads, airports, ports and the like has 96 spill over benefits across many sectors of the economy. For example, building roads connects communities and lowers transport costs. These lowered costs flow through to all sectors that rely on transporting goods and services. The lowered costs are eventually passed on to consumers in the form of 97 lower prices for the goods and services they consume. Other forms of infrastructure provide the logistical supported needed for the production of goods and services both consumed in Australia and exported overseas. Australian superannuation is playing an increasingly important role in funding infrastructure investment across Australia. APRA regulated superannuation funds 98 allocate around five per cent of their total asset allocation to infrastructure assets. This is equivalent to around $45 billion in assets in infrastructure. However, currently only less than a third of all superannuation funds have a significant 99 exposure to infrastructure. There are other estimates which put the percentage of assets in infrastructure a little lower, at around 3 per cent on average for APRA regulated funds. While larger industry, corporate funds, and public sector funds often have more than five per cent of assets allocated to infrastructure other funds will have less, or have indirect exposure through listed investments exposed to the infrastructure sector. It is projected that over the next 15 years the amount of funds in the superannuation 100 system could rise to $5 trillion. If the proportion of assets invested in infrastructure is around 5 per cent on average this suggests that there will be over $200 billion of superannuation savings invested in infrastructure by the year 2025.
96
97
98
99 100
The Allen Consulting Group
The technical economic term for such ‘positive externalities’ to infrastructure construction is ‘network effects’. See http://oz.stern.nyu.edu/io/network.html for an explanation. For an example, see the study of the benefits of toll roads in NSW at http://www.infrastructureaustralia.gov.au/publications/files/Eco_contribn_of_sydney's_TollRoads_EY2008.pdf. See ASFA, Challenges of Financing Infrastructure, May 2011, page 1. We saw above that the allocation for the three funds singled out for the property investment case studies was UniSuper (about 2 per cent), Cbus (about 13), and AustralianSuper (about 14 per cent). See ASFA, Challenges of Financing Infrastructure, May 2011, page 4. See ASFA, Challenges of Financing Infrastructure, May 2011, page 1.
33
ENHANCING FINANCIAL STABILITY AND ECONOMIC GROWTH: THE CONTRIBUTION OF SUPERANNUATION
4.4.2 Case study – AustralianSuper
Table 4.1 lists the top 20 assets owned by AustralianSuper, one of Australia’s largest superannuation funds. Of the Australian assets in the list, it can be seen that AustralianSuper has a an ownership interest in a large number of significant national infrastructure assets, such as the Port of Brisbane, Airports in Melbourne, Brisbane and Perth, and some major energy utilities like Pacific Power.
The Allen Consulting Group
34
ENHANCING FINANCIAL STABILITY AND ECONOMIC GROWTH: THE CONTRIBUTION OF SUPERANNUATION
Table 4.1
LIST OF AUSTRALIANSUPER'S TOP 20 INFRASTRUCTURE ASSETS
Infrastructure asset
Asset type
Location
Percentage of portfolio
Australia, Chile, Brazil
15.53%
Pacific Hydro
Renewable Energy
Melbourne Airport
Airport
VIC
7.95%
North American Energy Alliance
Gas Fired Generation
USA
6.03%
Anglican Water
Water Utility
UK
5.64%
Brisbane Airport
Airport
QLD
5.21%
Colonial Pipeline
Oil Pipeline
USA
4.08%
Perth Airport
Airport
WA
3.80%
Arqiva
Communication Towers
UK
3.57%
District Heating
Poland
3.22%
UK
3.06%
Germany
2.84%
DalkiaPolska 1
Thames Water
Water Utility
50 Hertz
Electricity Transmission & Distribution
Port of Brisbane
Seaport
QLD
2.78%
Duquesne
Electricity Transmission & Distribution
USA
2.63%
Interlink Roads M5
Toll Road
NSW
1.96%
Southern Cross Station
Social Infrastructure
VIC
1.93%
South East Water
Water Utility
UK
1.92%
NT Airport
Airport
NT
1.75%
Ecogen
Gas Fired Generation
VIC
1.62%
Eastern Distributor M1
Toll Road
NSW
1.60%
Wales & West
Gas Distribution
UK
1.05%
Sub-total Source: AustralianSuper (as at 31 December 2010)
101
The Allen Consulting Group
78.18%
101
See http://www.australiansuper.com/investments_investment-processes_infrastructure-holdings.aspx.
35
ENHANCING FINANCIAL STABILITY AND ECONOMIC GROWTH: THE CONTRIBUTION OF SUPERANNUATION
Among its list of infrastructure investments around the country, AustralianSuper lists (as at 31 December 2010) the Port of Brisbane. The Port of Brisbane is Australia’s fastest growing container port, and Queensland’s largest general cargo port. The Port of Brisbane is located at the mouth of the Brisbane River, and is managed and developed by the Port of Brisbane Pty Ltd (under a 99-year lease from the Queensland Government),which in turn is owned by a consortium comprising 102 four of the world’s largest and most experienced infrastructure investors:
Global Infrastructure Partners;
Industry Funds Management;
QIC Global Infrastructure on behalf of its managed funds; and
Tawreed Investments Ltd, a wholly-owned subsidiary of the Abu Dhabi Investment Authority.
AustralianSuper’s interest in the Port of Brisbane is indirect, being managed by the 103 infrastructure management company Industry Funds Management. Figure 4.4 shows a view of part of the port. Figure 4.4
PORT OF BRISBANE
Source : Port of Brisbane
102 103 104
The Allen Consulting Group
104
See http://www.portbris.com.au/AboutUs/AboutUs/OurShareholders. See http://www.australiansuper.com/investments_investment-processes_investment-managers.aspx. See http://www.portbris.com.au/AboutUs/AboutUs.
36
ENHANCING FINANCIAL STABILITY AND ECONOMIC GROWTH: THE CONTRIBUTION OF SUPERANNUATION
4.4.3 Case study – AMP
AMP Capital has been investing in Australian infrastructure since 1988. It launched an infrastructure equity fund in 1995 which was one of the original participants in the development of private infrastructure investment in Australia. The fund invests in a range of core infrastructure assets across Australia and New Zealand, diversified across a broad range of sectors including transport, utilities and social infrastructure. AMP Capital also offers investors a fund which invests in social infrastructure assets in Australia and New Zealand. This fund invests in high quality, predominantly operational community infrastructure assets, with a focus on assets with consistent longterm, inflation-linked cash flows and low exposure to the business cycle. Examples of infrastructure owned include: Australia Pacific Airports Corporation Australia Pacific Airports Corporation (APAC) was formed in 1997 by a consortium of investors, including AMP Capital, and is the leasehold owner and operator of two Australian airports – Melbourne and Launceston. Melbourne Airport is Australia’s second largest airport with over 27 million passengers per annum. It services the world’s fourth busiest airline route (Sydney to Melbourne) as well as a growing international passenger base. Interlink Roads Interlink Roads is the owner and operator of the M5 toll road in Sydney, Australia. The M5 toll road opened to traffic in August 1992, with revenue earned by charging commuters a toll. It runs 22.2 kilometres through Sydney’s south-western suburbs and is a key link in Sydney’s strategic road network. Interlink has the right to operate the M5 as a toll road until 2023 under a concession from the Road Traffic Authority of New South Wales. Southbank Institute The Southbank Institute of Technology is located in Brisbane, Australia and has capacity to provide vocational education and training facilities to over 50,000 students. It was the first public private partnership (PPP) delivered in Queensland and involved the redevelopment and ongoing maintenance of the facilities of the Southbank Institute of Technology. This fully operational asset operates under a concession from the Queensland Government until 2039 and is an availability-style asset whereby investors receive a regular payment from the Queensland Government for making the facilities available for use, regardless of the extent to which they are used. 4.4.4 Case study – Colonial First State
Colonial First State is also a major investor in infrastructure, often on behalf of superannuation funds either associated with CFS or separate to it. The table below provides some recent specific examples.
The Allen Consulting Group
37
ENHANCING FINANCIAL STABILITY AND ECONOMIC GROWTH: THE CONTRIBUTION OF SUPERANNUATION
Adelaide Airport
Brisbane Airport
Bankstown and Camden Airports
FreightLink
Perth Airport
Somerton Pipeline
Hazelwood Power
The Allen Consulting Group
38
ENHANCING FINANCIAL STABILITY AND ECONOMIC GROWTH: THE CONTRIBUTION OF SUPERANNUATION
4.5
Consequences of more assets flowing into self-managed funds
As of June 2010, there were 4,458 (68 per cent by assets) large APRA-regulated funds and 428,198 (32 per cent by asset) small or ATO-regulated funds (which 105 includes self-managed funds). In terms of assets held, self-managed funds have increased in total size by about a factor of four since 2000 (from about $100 billion to about $430 billion). Different types of funds have different investment class profiles. Table 4.2 shows the average proportion of assets for APRA-regulated superannuation funds. Table 4.2
PROPORTION OF ASSETS ALLOCATED IN APRA-REGULATED FUNDS Proportion of Assets
Total
Australian shares
29
International shares
23
Listed property
3
Unlisted property
7
Australian fixed interest
10
International fixed interest
6
Cash
9
Other
13 Total
Source: APRA
100
106
There are very few estimates available on aggregate superannuation assets invested in infrastructure. Based on data available from Chant West, the Allen Consulting Group’s best estimate of the proportion of total assets invested in infrastructure for 107 APRA-regulated funds is at least three per cent. Given that the total volume of assets held in APRA-regulated funds was $795,138 million in June 2010, it follows that in that year at least around $25 billion of funds were invested in infrastructure in Australia by superannuation funds. The following table shows the allocation of assets for self-managed superannuation 108 funds. It can be seen from the table that such funds are not significantly invested in infrastructure although the category “other” might include some investment through listed entities. However, it is likely that the exposure of SMSFs to infrastructure investment is negligible. 105 106 107 108
The Allen Consulting Group
See APRA Annual Superannuation Bulletin 2011, page 21. See APRA Annual Superannuation Bulletin 2011, page 40. Based on data provided by ASFA from Chant West. See http://www.ato.gov.au/superfunds/content.aspx?menuid=49150&doc=/content/00253476.htm&page=9&H9.
39
ENHANCING FINANCIAL STABILITY AND ECONOMIC GROWTH: THE CONTRIBUTION OF SUPERANNUATION
Over time, the proportion of total assets in self-managed funds has risen and they 109 have become the largest single category of superannuation funds in Australia. This gradual rise has macroeconomic implications in terms of the flow and profile of aggregate investment given the markedly different, narrower investment profile of this category of superannuation fund, as evidenced in the table below. 4.6 Simple counterfactual
Private sector funding, largely from superannuation funds, has become a growing source investment capital for Australia’s growing infrastructure needs. If the proportion of total assets in SMSFs continues to increase over the time, the proportion of total superannuation assets invested in infrastructure will decline over time. The total of assets held by APRA-regulated funds in June 2010 was $795,138 million and in June 2009 was $704,527 million. Using a simple linear projection based on current growth rates, it follows that the total amount of assets in APRAregulated funds in 2015 would be around $1,25 billion. Using similar methodology, if the assets in SMSFs continues to grow at the current growth rate, total assets held in SMFS funds would be nearly 36 per cent of all superannuation funds, up from 32 per cent now. If the proportion were to remain at 32 per cent in 2015 (rather than the predicted 36 per cent), then total assets in SMFS funds would be around $620 billion rather than around $690 billion, with the remaining $70 billion being managed instead by APRA-regulated funds. Based on the known current investment profile of APRA-regulated funds, at least three per cent of that $70 billion (or about $2 billion) would be invested in Australian infrastructure. It follows that if a greater proportion of assets are held in SMSFs along the lines of the projection, then there would be around $2 billion less available from superannuation funds for investment in infrastructure by 2015, and more in later years. This example is of course only illustrative, but it does indicate the potential impact on investment patterns from a shift in the asset shares of various types of funds within the superannuation sector.
109
The Allen Consulting Group
See APRA Annual Superannuation Bulletin 2011, page 5, Figure A.
40
ENHANCING FINANCIAL STABILITY AND ECONOMIC GROWTH: THE CONTRIBUTION OF SUPERANNUATION
Proportion of Assets
110
Jun-08
Sep-08
Dec-08
Mar-09
Jun-09
Sep-09
Dec-09
Mar-10
Jun-10
Dec-15
Listed trusts
24,459
23,363
21,610
21,893
19,466
22,326
23,676
24,875
24,027
26,050
Unlisted trusts
29,203
27,894
25,802
26,140
28,637
32,844
34,830
36,594
35,347
63,499
245
243
228
224
197
215
221
226
229
166
Other managed investments
18,519
18,023
16,474
16,246
16,514
18,684
19,404
20,342
20,650
28,622
Cash and term deposits
83,844
86,388
89,084
92,404
100,303
103,148
105,288
107,482
110,064
189,126
Debt securities
2,063
2,125
2,192
2,273
1,931
1,985
2,026
2,069
2,118
1,841
Loans
2,065
2,117
2,146
2,192
1,954
1,994
2,027
2,072
2,104
1,895
103,461
94,106
78,477
78,533
99,274
121,695
127,211
130,641
118,061
239,460
Unlisted shares
3,765
3,861
3,913
3,998
3,864
3,943
4,009
4,098
4,160
5,009
Derivatives and instalment warrants
419
431
445
461
464
477
487
497
509
751
Non-residential real property
30,789
30,813
31,307
32,106
36,115
38,571
41,485
44,569
45,823
92,406
Residential real property
10,834
11,110
11,260
11,504
11,693
11,932
12,131
12,401
12,588
17,376
Artwork, collectibles, metal or jewels
426
437
443
452
481
491
499
511
518
794
Insurance policy
Listed shares
Other assets
10,321
10,585
10,727
10,960
10,904
11,127
11,313
11,564
11,739
15,337
Overseas shares
802
729
608
609
704
863
902
926
837
1,457
Overseas nonresidential real property
64
58
49
49
64
78
82
84
76
163
Overseas residential real property
91
83
69
69
94
115
120
123
111
248
Overseas managed investments
285
259
216
216
247
302
316
325
293
497
1,517
1,379
1,150
1,151
1,326
1,625
1,699
1,744
1,576
2,721
323,170
314,005
296,198
301,481
334,228
372,417
387,727
401,142
390,833
687,425
Other overseas assets Total ($m)
110
The Allen Consulting Group
Estimate of asset proportions for the December quarter 2015 based on simple linear trend.
41
ENHANCING FINANCIAL STABILITY AND ECONOMIC GROWTH: THE CONTRIBUTION OF SUPERANNUATION
The Allen Consulting Group
42
ENHANCING FINANCIAL STABILITY AND ECONOMIC GROWTH: THE CONTRIBUTION OF SUPERANNUATION
Chapter 5
Quantifying the opportunity: impact of increasing the Superannuation Guarantee Chapter 5 explains the methodology used in this report to model the economic impacts of increasing the superannuation guarantee from nine per cent to 12 per cent in Australia. It then presents the results.
5.1 Modelling framework
The results in this chapter show the economic impact attributable to increasing the Superannuation Guarantee in Australia. Differences in economic outcomes between the policy change scenario (the Superannuation Guarantee being set at 12 per cent) and the ‘business as usual’ (BAU) scenario (the Superannuation Guarantee at nine per cent) are calculated to determine the economic benefit stemming from the higher SG over the period 2013 to 2025. It is assumed that the increase occurs entirely in the first year. The phasing in of the increase in the SG will not effect the ultimate impact in terms of changes to economic variables but of course will impact on the time taken to achieve the ultimate impact. These deviations are calculated by comparing the time paths for the economic 111 variables in the policy change scenario against the BAU scenario. The economy-wide impacts of increasing the SG in Australia over the period 2013 to 2025 were estimated using a Computable General Equilibrium (CGE) model of the Australian economy - the Monash Multi Regional Forecasting (MMRF) Model. Box 5.1 provides a brief description of the MMRF model. Box 5.1
THE MMRF MODEL The MMRF is a multi-sector dynamic CGE model of the Australian economy, covering the six states and two territories. It models each region as an economy in its own right, with region-specific prices, region-specific consumers, region-specific industries, and so on. Since MMRF is dynamic, it is able to produce sequences of annual solutions connected by dynamic relationships. The MMRF contains 58 industrial sectors, which produce 63 commodities. The sectoral details allow the benefits of higher BIM adoption rate to be allocated appropriately across the different sectors. The MMRF model is a high-level representation of the Australian economy, facilitating measurement of the wider effects of changes in economic activity in key industries and regions. To the extent that economic activity is interlinked, the MMRF model captures any indirect effects that arise from direct measures. In this instance, the direct impact of an increase in the superannuation guarantee is the increase in national household savings. The MMRF captures the flow-on impacts of this increase in national savings on
111
The Allen Consulting Group
It is important to note that the results from the economic analysis described in the sections below are in 2010 dollars and that all net present valuations of the impacts refer to Net Present Values (NPVs) in the year 2010. The NPVs are calculated using a real discount rate of 5 per cent.
43
ENHANCING FINANCIAL STABILITY AND ECONOMIC GROWTH: THE CONTRIBUTION OF SUPERANNUATION
investment, capital stock and (ultimately) GDP. Importantly, the MMRF model is widely known and has been used for a wide range of policy studies. The Productivity Commission used the model to examine the potential benefits of the National Reform Agenda, and the Commonwealth Treasury used a version of the MMRF to produce the 2008 report, Australia’s Low Pollution Future, which was a companion report to the Climate Change White Paper. The MMRF model has therefore demonstrated its ability to estimate economy-wide impacts of industry or policy changes. Key assumption on the labour market At the national level, the deviation in the consumer's real wage rate from its BAU forecast level increases in proportion to the deviation in employment from its BAU level. The coefficient of proportionality is chosen such that after about five years, the benefits of increasing the superannuation guarantee are realised almost entirely as an increase in the real wage rate, rather than as an increase in employment. This assumption reflects the idea that in the long run national employment is determined by demographic factors (birth and death rates, the level of international migration). It is also consistent with conventional macro-economic modelling in which the unemployment rate reverts to its natural rate in the long run. While Australia-wide employment in the long run is unaffected, there are changes to the sectoral distribution of employment. In other words, labour moves between different sectors so as to maintain the unemployment rate differentials at their BAU levels. Source: Allen Consulting Group, 2011
A summary of the CGE modelling approach is provided in Box 5.2, and it shows that the modelling approach used is conservative. Box 5.2
THE CGE MODELLING APPROACH USED IN THIS STUDY The points below summarise key features of the CGE modelling approach used in this study. The economic impacts of increasing the superannuation guarantee have been calculated using estimates from the literature about the effect of the guarantee on household savings. The economic impacts modelled are based on the differences between a higher superannuation guarantee and a BAU in which the superannuation guarantee remains at its current rate. The economic modelling captures the flow-on investment gains arising from an increase in household savings. Increased investment in turn increases the nation's capital stock and thus national GDP. The long-term national employment figure is fixed, and the labour market adjusts via changes in real wages. However, labour is perfectly mobile across industry and states, thus there can be changes in industry and state employment. Real government consumption (Commonwealth and States) is fixed. This implies productivity gains arising from increasing the superannuation guarantee would not affect government consumption. The economic modelling does not account for the cost involved in raising the superannuation guarantee. Source: Allen Consulting Group analysis, 2011
The Allen Consulting Group
44
ENHANCING FINANCIAL STABILITY AND ECONOMIC GROWTH: THE CONTRIBUTION OF SUPERANNUATION
5.2 The chain of causation from higher savings to higher GDP Offset
Forced saving at the individual level increases national or aggregate saving if Australians do not compensate ('offset') the forced saving by either reducing the amount of saving they hold in other assets (like bank deposits, shares, and so on) or else by increasing the amount of debt they hold. The current consensus is that, while considerable 'off-setting' behaviour does occur, it is not 100 per cent, so that increasing the amount of compulsory saving at the individual level is likely to 112 increase national saving. Saving
In our 2009 report for AFSA, we showed that the introduction of compulsory super (the SG) in 1992 increased national saving by 1.5 per cent of GDP (in 2001-2002 113 dollars). This result was for the policy change of 1992, which was an increase in the SG from zero to (eventually) nine per cent. For the purposes of CGE modelling in this report, we assume that a further three per cent increase in 2013 – being a third of nine per cent – will increase national saving by 0.5 per cent – being a third of 1.5 per cent. These estimates are conservative. The Treasury (Gruen and Soding, 2011) have estimated that compulsory superannuation at nine per cent has already increased national savings by 1.5 per cent and that the over the period to 2040 the effects of both the nine per cent contributions and the additional three per cent contribution will lead to an increase in national savings of 3.0 per cent by 2040. Investment
In a closed economy, an increase in national saving flows directly through to an increase in national investment. In an open economy such as Australia’s, this is not necessarily the case, and, indeed, not even likely the case. However, evidence is 114 robust that most Australian funds put most of their money into Australian assets. We have therefore assumed, for the purpose of modelling, that 73 per cent of the 115 increase in savings goes into Australian investment assets.
112
113
114
115
The Allen Consulting Group
See Connelly and Kohler (2004), who show that the ‘offset’ by individuals forced to divert some savings into superannuation is not 100 per cent. The Allen Consulting Group, Better living standards and a stronger economy: the role of superannuation in Australia, September 2009. Various sources give somewhat differing proportions of superannuation funds invested in Australian assets, but all evidence the fact that it is a large majority. See for example APRA, Annual superannuation bulletin 2010, at pp. 5-7 (about 70 per cent), and ABS, Managed Funds, Cat. No. 5655.0, p. 13 (about 85 per cent). The empirical evidence on the ‘home bias’ in investment – so contrary to economic theory – is a long-standing ‘paradox’ in international macroeconomics. See originally, Feldstein and Horioka (1980), "Domestic Saving and International Capital Flows", Economic Journal, Vol. 90, No. 358, pp. 314–329. See also Obstfeld and Rogoff, Foundations of International Economics, 1996, MIT Press, at pp. 161-164, and Obstfeld and Rogoff (2000), "The Six Major Puzzles in International Macroeconomics: Is There a Common Cause?", in Bernanke and Rogoff, NBER Macroeconomics Annual 2000, 15, The MIT Press, pp. 339–390. Small self-managed funds are now the largest class of funds (32 per cent) and all their funds can be assumed to be in Australian assets. Of the remaining funds, about half follow the ‘default investment strategy’, which has 71 per cent invested in Australian assets. If we assume (conservatively) that the remaining funds put 50 per cent of their money into Australian assets, then this gives the percentage in the text above. See pages 5-7 of APRA, Annual superannuation bulletin 2010. Note that using the APRA data source is conservative, since using the ABS as the data source gives a much higher proportion (85 per cent): ABS, Managed Funds, Cat. No. 5655.0, p. 13.
45
ENHANCING FINANCIAL STABILITY AND ECONOMIC GROWTH: THE CONTRIBUTION OF SUPERANNUATION
5.3 Results
The benefits of increased savings – and, hence, increased investment - arising from the adoption of an increased superannuation guarantee, accrue from the moment of the policy change. Higher investment levels provide a stimulus to the Australian economy. Indeed, higher investment levels boost national output (real GDP). Table 5.1
PERCENTAGE DEVIATION OFMACROECONOMIC VARIABLES OF THE POLICY CHANGE ECONOMY FROM THE BUSINESS AS USUAL ECONOMY Macroeconomic variables
Policy change deviation from BAU (%)
Consumption
-0.59
Investment
1.30
Exports Employment (persons)
1.04 116
0.00
Employment (hours)
0.03
Capital stock
0.9
Real wage rate
1.06
CPI
0.00
Real GDP
0.33
Source: ACG Modelling
The results in 0 detail the deviations in key macroeconomic variables attributable to the increase in the superannuation guarantee from nine per cent to 12 per cent. These deviations are calculated by comparing the time paths for the economic variables in the policy shock scenario against the BAU scenario. A convenient way of reporting these deviations is as percentage changes from where the MMRF projects the economy would otherwise have been (i.e. the 'base case') if there had not been an increase in the superannuation guarantee (the 'policy shock'). An increase in the SG from nine to 12 per cent, implemented in 2013, will raise real GDP by 0.33 per cent by 2025 compared to the BAU scenario. In 2010 dollars, this is an extra $5463 million for the economy as a whole in 2025 compared to the BAU scenario. Given that the Australian population in 2025 is estimated to be about 28 117 million, that amounts to an extra $195 in the hands of every Australian 2025 as a result of the reform (compared to not carrying out the reform). In terms of households, this is an extra $520 in the hands of every Australian household by 118 2025. 116
117
118
The Allen Consulting Group
The economy has returned to its long-run employment level by 2025. During the short run transition (from 2012 – 2023, employment (persons) increased up to 0.27 per cent (compared to BAU). See Table 9 on page 23 of ABS, Australian Demographic Statistics, September 2010, Cat. No. 3101.0. available at: http://www.abs.gov.au/AUSSTATS/
[email protected]/Lookup/3101.0Main+Features1Sep%202010?OpenDocument. For more on population estimates, see the federal Treasury’s Intergeneration Report 2010, available at: http://www.treasury.gov.au/igr/igr2010/Overview/html/overview_05.htm. See Table 20 on page 38 of ABS, Australian Demographic Statistics, September 2010, Cat. No. 3101.0.
46
ENHANCING FINANCIAL STABILITY AND ECONOMIC GROWTH: THE CONTRIBUTION OF SUPERANNUATION
From Table 5.1 it can also be seen that exports and the real wage also rise significantly as a result of the policy change. As expected, national consumption decreases due to the increase in national saving, which in turn feeds into an increase in investment and so an increase in the nation’s capital stock, thus leading to an increase in real GDP. So although national consumption has gone down, the welfare of Australians, as proxied by real GDP, has increased, as we expect under a national savings policy. 5.4 Conclusion
The modelling shows that increasing the SG from nine per cent to twelve per cent would have a positive economic impact on Australia’s economy. Overall economic output is higher when Australians save more, which the increase in SG accomplishes.
The Allen Consulting Group
47
ENHANCING FINANCIAL STABILITY AND ECONOMIC GROWTH: THE CONTRIBUTION OF SUPERANNUATION
The Allen Consulting Group
48
ENHANCING FINANCIAL STABILITY AND ECONOMIC GROWTH: THE CONTRIBUTION OF SUPERANNUATION
References
Australian Bureau of Statistics, Employment Arrangements, Retirement and Superannuation, Australia, Apr to Jul 2007 (Re-issue),Cat. No. 6361.0 Australian Bureau of Statistics 2009, Employment arrangements, retirement and superannuation, Australia, Cat. No. 6361.0 Australian Bureau of Statistics 2009, ‘Retirement and retirement intentions’, Australian Social Trends, March 2009, Cat. No. 4102.0 ABS, Australian Demographic Statistics, September 2010, Cat. No. 3101.0 ABS 2011 - ABS, Managed Funds, Australia, March quarter 2011, cat. no. 5655.0, Canberra Australian Prudential Regulation Authority 2007, A recent history of superannuation in Australia. ABS, Venture Capital and Later Stage Private Equity, Australia, 2009-11, cat. no. 5678.0, Canberra ABS, Managed Funds, Australia, March quarter 2011, cat. no. 5655.0, Canberra APRA 2011 – Quarterly Superannuation Performance APRA 2010 -Annual superannuation bulletin Allen Consulting Group, Better living standards and a stronger economy: the role of superannuation in Australia, September 2009 ASFA 2008, Will you get what you want, need or deserve in retirement?(ASFA 2008) ASFA,Employer contributions to superannuation in excess of 9% of wages, March 2010 ASFA, Challenges of Financing Infrastructure, May 2011 ASFA, Spotlight on Henry – A comparative analysis of the Henry recommendations with the proposed increase of the superannuation guarantee to 12 per cent, May 2011 (ASFA 2011) ASX 2007 - Australian Stock Exchange, 2007, Submission to the inquiry into shareholder engagement and participation, Parliamentary Joint Committee on Corporations and Financial Services. ASX Information Paper (29 January 2010), Capital Raising in Australia: Experiences and Lessons from the Global Financial Crisis ASX 2010 – Annual Report The Allen Consulting Group
49
ENHANCING FINANCIAL STABILITY AND ECONOMIC GROWTH: THE CONTRIBUTION OF SUPERANNUATION
Australia’s Future Tax System Review (the Henry Review) Australia’s future tax system, Retirement income - consultation paper Brennan, 1990, Commentary, in C. Walsh (ed.) Issues in State Taxation, Centre for Research on Federal Financial Relations, ANU, Canberra, pp. 93-100 John Broadbent, Head of Domestic Markets Department, RBA – Reconnecting Corporate Australia with Frozen Credit Markets, 10 November 2009, available at: http://www.rba.gov.au/speeches/2009/sp-so-101109.html Catalan et. al., Contractual savings or stock market development: Which leads? World Bank Working Paper, August 2000 Choi, J, Laibson, D and Madrian, B 2005, ‘$100 Bills on the Sidewalk: Failing to Save Optimally in 401(k) Plans’, NBER Working Paper No. 11554, August. Clare, The Age Pension, Superannuation and Australian Retirement Incomes, ASFA Research Paper (December 2008) Connolly, E and Kohler, M 2004, ‘The Impact of Superannuation on Household Saving’, Research Discussion Paper, March. deHaan and Kakes, Momentum or Contrarian Investment Strategies: Evidence from Dutch institutional investors, DNB Working Paper, January 2010 Dixon et. al., Payroll taxes: thresholds, firm sizes, dead-weight losses and Commonwealth grants Commission funding, Economic Record, Vol. 80, No. 250, pp. 289-301, September 2004 Economist Magazine online, Super Duper Supers, May 26 2011, available at: http://www.economist.com/node/18719616. Edey M. and Gower L. 2000, National Saving: Trends and Policy Reserve Bank of Australia 2000 Conference: The Australian Economy in the 1990s, 24-25 July 2000 Eichengreen and Tong, Stock Market Volatility and Monetary Policy: What the Historical Record Shows (2003) Feldstein and Horioka (1980), "Domestic Saving and International Capital Flows", Economic Journal, Vol. 90, No. 358, pp. 314–329 Irving Fisher,The Theory of Interest(1930) Garnaut Climate Change Review Belinda Gibson, Commissioner ASIC, to the Corporate Finance World Australia 2009 conference, 10 November 2009, Facilitating Capital Raising for Corporate Australia, available at: http://www.asic.gov.au/asic/pdflib.nsf/LookupByFileName/Speech-corporatefinance-world-australia-Nov-2009.pdf/$file/Speech-corporate-finance-worldaustralia-Nov-2009.pdf Chapman and Vincent (1987), Payroll taxes in Australia, Part II: an economy wide approach to estimating the effects of their removal, Economic Analysis and Policy, Vol. 17, pp. 149-177 Head (ed.), 1993, Fightback! An Economic Assessment, Australian Tax Research Foundation, Sydney The Allen Consulting Group
50
ENHANCING FINANCIAL STABILITY AND ECONOMIC GROWTH: THE CONTRIBUTION OF SUPERANNUATION
HILDA unit record data IBIS World, Industry Report, Finance and Insurance in Australia, 2008 Koedijk and Slager, Do Institutional Investors Have Sensible Investment Beliefs?,Rotman International Journal of Pension Management, Vol. 2, Issue 1, Spring 2009 Laibson, D, Repetto, A and Tobacman, J 2003, ‘A Debt Puzzle’ in P. Aghion, R. Frydman, J. Stiglitz, M. Woodford (eds.), Knowledge, Information and Expectations in Modern Economics: In Honor of Edmund S. Phelps, Princeton, Princeton University Press, pp. 228-66. Laibson, D 2005, ‘Impatience and Savings’, NBER Reporter, Research Summary, Fall. Lakonishok, Shleifer, and Vishny (1992) The Impact of Institutional Trading on Stock Prices, Journal of Financial Economics 32, 23-43 Levine (1997), Financial development and economic growth: Views and agenda, Journal of Economic Literature, vol. 35(2), June, pp. 688-726 Chris Murphy, Payroll tax: Is it as good as a VAT or as bad as a sales tax?Econtech report for ACCI, 23 June 1998 Obstfeld and Rogoff (2000), "The Six Major Puzzles in International Macroeconomics: Is There a Common Cause?", in Bernanke and Rogoff, NBER Macroeconomics Annual 2000, 15, The MIT Press, pp. 339–390 Obstfeld and Rogoff, Foundations of International Economics, 1996, MIT Press OECD Secretarial Note: Pension fund governance, investment strategies, and their role in corporate governance OECD, available at: http://www.oecd.org/document/28/0,3746,en_2649_37457_43200796_1_1_1_3745 7,00.html RBA, Statement of Monetary Policy – Domestic Financial Markets, August 2009 Reserve Bank Bulletin, October 2009 – Australian Corporates Sources and Uses of Funds, available at: http://www.rba.gov.au/publications/bulletin/2009/oct/1.html RBA – The impact of the financial crisis on the bond market, available at: http://www.rba.gov.au/publications/bulletin/2010/jun/pdf/bu-0610-8.pdf M Ryan (1995), What future for payroll taxes in Australia? Treasury Research Paper No. 10, Treasury, Canberra Samuelson (1961), A new theorem of nonsubstitution, pp. 407-427 in Money, Growth and Methodology, vol. 20, Lund Social Science Studies, Lund, Sweden, CWK Gleerup, reprinted in The Collected Scientific Papers of Paul A. Samuelson, MIT Press, Cambridge, 1965, pp. 520-535 Shoup (1969), Public Finance, Aldine, Chicago, at pp. 266-269, 407-409 Super System (Cooper) Review
The Allen Consulting Group
51
ENHANCING FINANCIAL STABILITY AND ECONOMIC GROWTH: THE CONTRIBUTION OF SUPERANNUATION
Thaler and Sunstein, Nudge: Improving decisions about health, wealth and happiness, Yale University Press, New Haven, CT, 2008 Federal Treasury’s Intergenerational Report 2010 Federal Treasury Australia’s Low Pollution Future, a companion report to the Climate Change White Paper NSW Treasury, Office of Financial Management, The Case for Payroll Tax, (September 1999) Wilkins R, Warren D and Hahn M 2009, Families, incomes and jobs, volume 4; A statistical report on waves 1 to 6 of the HILDA survey, Melbourne Institute of Applied Economic and Social Research, The University of Melbourne World Economic Forum, The future of long term investing2011
The Allen Consulting Group
52