Knowledge-based analysis of microarray gene expression data by using support vector machines Michael P. S. Brown*, William Noble Grundy†‡, David Lin*, Nello Cristianini§, Charles Walsh Sugnet¶, Terrence S. Furey*, Manuel Ares, Jr.¶, and David Haussler* *Department of Computer Science and ¶Center for Molecular Biology of RNA, Department of Biology, University of California, Santa Cruz, Santa Cruz, CA 95064; †Department of Computer Science, Columbia University, New York, NY 10025; §Department of Engineering Mathematics, University of Bristol, Bristol BS8 1TR, United Kingdom Edited by David Botstein, Stanford University School of Medicine, Stanford, CA, and approved November 15, 1999 (received for review August 31, 1999)
We introduce a method of functionally classifying genes by using gene expression data from DNA microarray hybridization experiments. The method is based on the theory of support vector machines (SVMs). SVMs are considered a supervised computer learning method because they exploit prior knowledge of gene function to identify unknown genes of similar function from expression data. SVMs avoid several problems associated with unsupervised clustering methods, such as hierarchical clustering and self-organizing maps. SVMs have many mathematical features that make them attractive for gene expression analysis, including their flexibility in choosing a similarity function, sparseness of solution when dealing with large data sets, the ability to handle large feature spaces, and the ability to identify outliers. We test several SVMs that use different similarity metrics, as well as some other supervised learning methods, and find that the SVMs best identify sets of genes with a common function using expression data. Finally, we use SVMs to predict functional roles for uncharacterized yeast ORFs based on their expression data.
D
NA microarray technology provides biologists with the ability to measure the expression levels of thousands of genes in a single experiment. Initial experiments (1) suggest that genes of similar function yield similar expression patterns in microarray hybridization experiments. As data from such experiments accumulates, it will be essential to have accurate means for extracting biological significance and using the data to assign functions to genes. Currently, most approaches to the computational analysis of gene expression data attempt to learn functionally significant classifications of genes in an unsupervised fashion. A learning method is considered unsupervised if it learns in the absence of a teacher signal. Unsupervised gene expression analysis methods begin with a definition of similarity (or a measure of distance) between expression patterns, but with no prior knowledge of the true functional classes of the genes. Genes are then grouped by using a clustering algorithm such as hierarchical clustering (1, 2) or selforganizing maps (3). Support vector machines (SVMs) (4–6) and other supervised learning techniques use a training set to specify in advance which data should cluster together. As applied to gene expression data, an SVM would begin with a set of genes that have a common function: for example, genes coding for ribosomal proteins or genes coding for components of the proteasome. In addition, a separate set of genes that are known not to be members of the functional class is specified. These two sets of genes are combined to form a set of training examples in which the genes are labeled positively if they are in the functional class and are labeled negatively if they are known not to be in the functional class. A set of training examples can easily be assembled from literature and database sources. Using this training set, an SVM would learn to discriminate between the members and non-members of a given functional class based on expression data. Having learned the expression features of the class, the SVM could recognize new genes as members or as nonmembers of the class based on their expression data. The SVM
262–267 u PNAS u January 4, 2000 u vol. 97 u no. 1
could also be reapplied to the training examples to identify outliers that may have previously been assigned to the incorrect class in the training set. Thus, an SVM would use the biological information in the investigator’s training set to determine what expression features are characteristic of a given functional group and use this information to decide whether any given gene is likely to be a member of the group. SVMs offer two primary advantages with respect to previously proposed methods such as hierarchical clustering and selforganizing maps. First, although all three methods employ distance (or similarity) functions to compare gene expression measurements, SVMs are capable of using a larger variety of such functions. Specifically, SVMs can employ distance functions that operate in extremely high-dimensional feature spaces, as described in more detail below. This ability allows the SVMs implicitly to take into account correlations between gene expression measurements. Second, supervised methods like SVMs take advantage of prior knowledge (in the form of training data labels) in making distinctions between one type of gene and another. In an unsupervised method, when related genes end up far apart according to the distance function, the method has no way to know that the genes are related. We describe here the use of SVMs to classify genes based on gene expression. We analyze expression data from 2,467 genes from the budding yeast Saccharomyces cerevisiae measured in 79 different DNA microarray hybridization experiments (1). From these data, we learn to recognize five functional classes from the Munich Information Center for Protein Sequences Yeast Genome Database (MYGD) (http:yywww.mips.biochem.mpg.deyprojyyeast). In addition to SVM classification, we subject these data to analyses by four competing machine learning techniques, including Fisher’s linear discriminant (7), Parzen windows (8), and two decision tree learners (9, 10). The SVM method out-performs all other methods investigated here. We then use SVMs developed for these functional groups to predict functional associations for 15 yeast ORFs of unknown function. Methods and Approach DNA Microarray Data. Each data point produced by a DNA mi-
croarray hybridization experiment represents the ratio of expression levels of a particular gene under two different experimental conditions (11, 12). The result, from an experiment with n genes on a single chip, is a series of n expression-level ratios. Typically, the numerator of each ratio is the expression level of the gene in the This paper was submitted directly (Track II) to the PNAS office. Abbreviations: SVM, support vector machine; MYGD, Munich Information Center for Protein Sequences Yeast Genome Database; TCA, tricarboxylic acid. ‡To whom reprint requests should be addressed at: Department of Computer Science, Colum-
bia University, 450 Computer Science Building, Mail Code 0401, 1214 Amsterdam Avenue, New York, NY 10027. E-mail:
[email protected]. The publication costs of this article were defrayed in part by page charge payment. This article must therefore be hereby marked “advertisement” in accordance with 18 U.S.C. §1734 solely to indicate this fact.
Xi 5
log~E iyR i!
ÎO
79 2 j51log ~E jyR j!
.
[1]
The expression measurement Xi is positive if the gene is induced (turned up) with respect to the reference state and negative if it is repressed (turned down) (1). Initial analyses described here are carried out by using a set of 79-element gene expression vectors for 2,467 yeast genes (1). These genes were selected by Eisen et al. (1) based on the availability of accurate functional annotations. The data were generated from spotted arrays using samples collected at various time points during the diauxic shift (12), the mitotic cell division cycle (13), sporulation (14), and temperature and reducing shocks, and are available on the Stanford web site (http:yyrana.stanford.eduyclustering). Predictions of ORFs of unknown function were made by using a slightly different set of data that did not include temperature and reducing shocks data. The data included 6,221 genes, of which 2,467 were the annotated genes described above. The 80-element gene expression vectors used for these experiments included 65 of the 79 elements from the initial data used, plus 15 additional mitotic cell division cycle time points not used by Eisen et al. (1). This data is also available on the Stanford web site. 3
Support Vector Machines. Each vector X in the gene expression
matrix may be thought of as a point in an m-dimensional expression space. In theory, a simple way to build a binary classifier is to construct a hyperplane separating class members (positive examples) from non-members (negative examples) in this space. Unfortunately, most real-world problems involve nonseparable data for which there does not exist a hyperplane that successfully separates the positive from the negative examples. One solution to the inseparability problem is to map the data into a higher-dimensional space and define a separating hyperplane there. This higherdimensional space is called the feature space, as opposed to the input space occupied by the training examples. With an appropriately chosen feature space of sufficient dimensionality, any consistent training set can be made separable. However, translating the training set into a higher-dimensional space incurs both computational and learning-theoretic costs. Furthermore, artificially separating the data in this way exposes the learning system to the risk of finding trivial solutions that overfit the data. SVMs elegantly sidestep both difficulties (4). They avoid overfitting by choosing the maximum margin separating hyperplane from among the many that can separate the positive from negative examples in the feature space. Also, the decision function for classifying points with respect to the hyperplane only involves dot products between points in the feature space. Because the algorithm that finds a separating hyperplane in the feature space can be stated entirely in terms of vectors in the input space and dot products in the feature space, a support vector machine can locate the hyperplane without ever representing the space explicitly, simply by defining a function, called a kernel function, that plays the role of the dot product in the feature space. This technique avoids the computational burden of explicitly representing the feature vectors.
Brown et al.
For some data sets, the SVM may not be able to find a separating hyperplane in feature space, either because the kernel function is inappropriate for the training data or because the data contains mislabeled examples. The latter problem can be addressed by using a soft margin that allows some training examples to fall on the wrong side of the separating hyperplane. Completely specifying a support vector machine therefore requires specifying two parameters: the kernel function and the magnitude of the penalty for violating the soft margin. The settings of these parameters depend on the specific data at hand. 3 Given an expression vector X for each gene X, the simplest kernel K (X, Y) that we can use to measure the similarity between3genes 3 X and Y is the dot product in the input space K (X, Y) 5 XzY 5 79 Si51 XiYi. For technical reasons (see http:yywww.cse.ucsc.eduy researchycompbioygenex), we add 1 to this kernel, obtaining a 33 kernel defined by K (X, Y) 5 XzY 1 1. When this dot product kernel is used, the feature space is essentially the same as the 79dimensional input space, and the SVM will classify the examples with a separating hyperplane in this space. Squaring this kernel, i.e., 33 defining K (X, Y) 5 (XzY 1 1)2, yields a quadratic separating surface in the input space. The corresponding separating hyperplane in the feature space includes features for all pairwise mRNA expression interactions XiXj, where 1 # i, j # 79. Raising the kernel to higher powers yields polynomial separating surfaces of higher degrees in the input space. In general, the kernel of degree d is defined by 33 K(X, Y) 5 (XzY 1 1)d. In the feature space of this kernel, for any gene X there are features for all d-fold interactions between mRNA measurements, represented by terms of the form Xi1Xi2. . . Xid, where 1 # i1,. . . , id # 79. We experiment here with these kernels for degrees d 5 1, 2, and 3. We also experiment with a radial3basis3kernel (15), which has a Gaussian form K (X, Y) 5 exp(2uu X 2 Y uu2y2a2), where a is the width of the Gaussian. In our experiments, a is set equal to the median of the Euclidean distances from each positive example to the nearest negative example (16). The gene functional classes examined here contain very few members relative to the total number of genes in the data set. This leads to an imbalance in the number of positive and negative training examples that, in combination with noise in the data, is likely to cause the SVM to make incorrect classifications. When the magnitude of the noise in the negative examples outweighs the total number of positive examples, the optimal hyperplane located by the SVM will be uninformative, classifying all members of the training set as negative examples. We combat this problem by modifying the matrix of kernel values computed during SVM optimization. Let X(1), . . . , X(n) be the genes in the training set, and let K be the matrix defined by the kernel function K on this training set; i.e., Kij 5 K (X(i), X(j)). By adding to the diagonal of the kernel matrix a constant whose magnitude depends on the class of the training example, one can control the fraction of misclassified points in the two classes. This technique ensures that the positive points are not regarded as noisy labels. For positive examples, the diagonal element is modified by Kij :5 Kij 1 l(n1yN), where n1 is the number of positive training examples, N is the total number of training examples, and l is scale factor. A similar formula is used for the negative examples, with n1 replaced by n2. In the experiments reported here, the scale factor is set to 0.1. A more mathematically detailed discussion of the techniques employed here is available at http:yywww.cse.ucsc.eduy researchycompbioygenex. Experimental Design Using the class definitions made by the
MYGD, we trained SVMs to recognize six functional classes: tricarboxylic acid (TCA) cycle, respiration, cytoplasmic ribosomes, proteasome, histones, and helix-turn-helix proteins. The MYGD class definitions come from biochemical and genetic studies of gene function whereas the microarray expression data measures mRNA levels of genes. Many classes in MYGD, especially structural classes such as protein kinases, will be unlearnable from expression data by PNAS u January 4, 2000 u vol. 97 u no. 1 u 263
GENETICS
varying condition of interest, whereas the denominator is the expression level of the gene in some reference condition. The data from a series of m such experiments may be represented as a gene expression matrix, in which each of the n rows consists of an m-element expression vector for a single gene. Following Eisen et al. (1), we do not work directly with the ratio as discussed above but rather with its normalized logarithm. We define Xi to be the logarithm of the ratio of expression level Ei for gene X in experiment in the reference state, i to the expression level Ri of gene X 3 normalized so that the expression vector X 5 (X1, . . . , X79) has Euclidean length 1:
any classifier. The first five classes were selected because they represent categories of genes that are expected, on biological grounds, to exhibit similar expression profiles. Furthermore, Eisen et al. (1) suggested that the mRNA expression vectors for these classes cluster well using hierarchical clustering. The sixth class, the helix-turn-helix proteins, is included as a control group. Because there is no reason to believe that the members of this class are similarly regulated, we did not expect any classifier to learn to recognize members of this class based on mRNA expression measurements. The performance of the SVM classifiers was compared with that of four standard machine learning algorithms: Parzen windows, Fisher’s linear discriminant, and two decision tree learners (C4.5 and MOC1). Descriptions of these algorithms can be found at http:yywww.cse.ucsc.eduyresearchycompbioygenex. Performance was tested by using a three-way cross-validated experiment. The gene expression vectors were randomly divided into three groups. Classifiers were trained by using two-thirds of the data and were tested on the remaining third. This procedure was then repeated two more times, each time using a different third of the genes as test genes. The performance of each classifier was measured by examining how well the classifier identified the positive and negative examples in the test sets. Each gene in the test set can be categorized in one of four ways: true positives are class members according to both the classifier and MYGD; true negatives are non-members according to both; false positives are genes that the classifier places within the given class, but MYGD classifies as non-members; false negatives are genes that the classifier places outside the class, but MYGD classifies as members. We report the number of genes in each of these four categories for each of the learning methods we tested. To judge overall performance, we define the cost of using the method M as C(M) 5 fp(M) 1 2zfn(M), where fp(M) is the number of false positives for method M, and fn(M) is the number of false negatives for method M. The false negatives are weighted more heavily than the false positives because, for these data, the number of positive examples is small compared with the number of negatives. The cost for each method is compared with the cost C(N) for using the null learning procedure, which classifies all test examples as negative. We define the cost savings of using the learning procedure M as S(M) 5 C(N) 2 C(M). Experiments predicting functions of unknown genes were performed by first training SVM classifiers on the 2,467 annotated genes for the five learnable classes. For each class, the remaining 3,754 genes were then classified by the SVM. Results and Discussion SVMs Outperform Other Methods. Our experiments show that some functional classes of genes can be recognized by using SVMs trained on DNA microarray expression data. We compare SVMs to four non-SVM methods and find that SVMs provide superior performance. Table 1 summarizes the results of a three-fold cross-validation experiment using all eight of the classifiers tested, including four SVM variants, Parzen windows, Fisher’s linear discriminant, and two decision tree learners. Performance is evaluated in the standard machine learning setting, in which each method must produce a positive or negative classification label for each member of the test set based only on what it has learned from the training set. The first four columns are the categories false positive (FP), false negative (FN), true positive (TP), and true negative (TN), and the fifth is a measure of overall performance. For every class (except the helix-turn-helix class), the bestperforming method is a support vector machine using the radial basis or a higher-dimensional dot product kernel. Other cost functions, with different relative weights of the false positive and false negative rates, yield similar rankings of performance. In five separate tests, the radial basis SVM performs better than Fisher’s 264 u www.pnas.org
Table 1. Comparison of error rates for various classification methods Class
Method
FP
FN
TP
TN
S(M)
TCA
D-p 1 SVM D-p 2 SVM D-p 3 SVM Radial SVM Parzen FLD C4.5 MOC1 D-p 1 SVM D-p 2 SVM D-p 3 SVM Radial SVM Parzen FLD C4.5 MOC1 D-p 1 SVM D-p 2 SVM D-p 3 SVM Radial SVM Parzen FLD C4.5 MOC1 D-p 1 SVM D-p 2 SVM D-p 3 SVM Radial SVM Parzen FLD C4.5 MOC1 D-p 1 SVM D-p 2 SVM D-p 3 SVM Radial SVM Parzen FLD C4.5 MOC1 D-p 1 SVM D-p 2 SVM D-p 3 SVM Radial SVM Parzen FLD C4.5 MOC1
18 7 4 5 4 9 7 3 15 7 6 5 22 10 18 12 14 9 7 6 6 15 31 26 21 6 3 2 21 7 17 10 0 0 0 0 2 0 2 2 60 3 1 0 14 14 2 6
5 9 9 9 12 10 17 16 7 7 8 11 10 10 17 26 2 2 3 5 8 5 21 26 7 8 8 8 5 12 10 17 2 2 2 2 3 3 2 5 14 16 16 16 16 16 16 16
12 8 8 8 5 7 0 1 23 23 22 19 20 20 13 4 119 119 118 116 113 116 100 95 28 27 27 27 30 23 25 18 9 9 9 9 8 8 9 6 2 0 0 0 0 0 0 0
2,432 2,443 2,446 2,445 2,446 2,441 2,443 2,446 2,422 2,430 2,431 2,432 2,415 2,427 2,419 2,425 2,332 2,337 2,339 2,340 2,340 2,331 2,315 2,320 2,411 2,426 2,429 2,430 2,411 2,425 2,415 2,422 2,456 2,456 2,456 2,456 2,454 2,456 2,454 2,454 2,391 2,448 2,450 2,451 2,437 2,437 2,449 2,445
6 9 12 11 6 5 27 21 31 39 38 33 18 30 8 24 224 229 229 226 220 217 169 164 35 48 51 52 39 39 33 26 18 18 18 18 14 16 16 10 256 23 21 0 214 214 22 26
Resp
Ribo
Prot
Hist
HTH
The methods are the SVMs using the scaled dot product kernel raised to the first, second, and third power, the radial basis function SVM, Parzen windows, Fisher’s Linear Discriminant, and the two decision tree learners, C4.5 and MOC1. The next five columns are the false positive, false negative, true positive, and true negative rates summed over three cross-validation splits, followed by the total cost savings [S(M)], as defined in the text.
linear discriminant. Under the null hypothesis that the methods are equally good, the probability that the radial basis SVM would be the best all five times is 0.03. The results also show the inability of all classifiers to learn to recognize genes that produce helix-turn-helix proteins, as expected. The results shown in Table 1 for higher-order SVMs are considerably better than the corresponding error rates for clusters derived in an unsupervised fashion. For example, using hierarchical Brown et al.
Table 2. Consistently misclassified genes Class
Gene
Locus
TCA
YPR001W YOR142W YLR174W YIL125W YDR148C YBL015W YPR191W YPL271W YPL262W YML120C YKL085W YGR207C YDL067C YPL037C YLR406C YLR075W YDL184C YAL003W YHR027C YGR270W YGR048W YDR069C YDL020C YOL012C YKL049C
CIT3 LSC1 IDP2 KGD1 KGD2 ACH1 QCR2 ATP15 FUM1 NDI1 MDH1
Resp
Ribo
Prot
Hist
COX9 EGD1 RPL31B RPL10 RPL41A EFB1 RPN1 YTA7 UFD1 DOA4 RPN4 HTA3 CSE4
Error FN FN FN FN FN FP FN FN FP FP FP FN FN FP FN FP FN FP FN FN FP FN FN FN FN
Description Mitochondrial citrate synthase a subunit of succinyl-CoA ligase Isocitrate dehydrogenase a-ketoglutarate dehydrogenase Component of a-ketoglutarate dehydrog. complex (mito) Acetyl CoA hydrolase Ubiquinol cytochrome-c reductase core protein 2 ATP synthase « subunit Fumarase Mitochondrial NADH ubiquinone 6 oxidoreductase Mitochondrial malate dehydrogenase Electron-transferring flavoprotein, b chain Subunit VIIa of cytochrome c oxidase b subunit of the nascent-polypeptide-associated complex Ribosomal protein L31B (L34B) (YL28) Ribosomal protein L10 Ribosomal protein L41A (YL41) (L47A) Translation elongation factor EF-1b Subunit of 26S proteasome (PA700 subunit) Member of CDC48yPAS1ySEC18 family of ATPases Ubiquitin fusion degradation protein Ubiquitin isopeptidase Involved in ubiquitin degradation pathway Histone-related protein Required for proper kinetochore function
The table lists all 25 genes that are most consistently misclassified by the SVMs. Two types of errors are included: a false positive (FP) occurs when the SVM includes the gene in the given class but the MYGD classification does not; a false negative (FN) occurs when the SVM does not include the gene in the given class but the MYGD classification does.
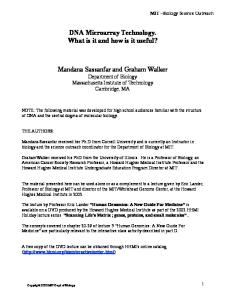
Fig. 1. Expression profile of YPL037C compared with the MYGD class of cytoplasmic ribosomal proteins. YPL037C is classified as a ribosomal protein by the SVMs but is not included in the class by MYGD. The figure shows the expression profile for YPL037C, along with standard deviation bars for the class of cytoplasmic ribosomal proteins. Ticks along the x axis represent the beginnings of experimental series.
Brown et al.
other kernel functions are similar (http:yywww.cse.ucsc.eduy researchycompbioygenex). Significance of Consistently Misclassified Annotated Genes. The five
different three-fold cross-validation experiments, each performed with four different kernels, yield a total of 20 experiments per functional class. Across all five functional classes (excluding helixturn-helix) and all 20 experiments, 25 genes are misclassified in at least 19 of the 20 experiments (Table 2). In general, these disagreements with MYGD reflect the different perspective provided by the expression data, which represents the genetic response of the cell, and the MYGD definitions, which have been arrived at through experiments or protein structure predictions. For example, in MYGD, the members of a complex are defined by biochemical co-purification whereas the expression data may identify proteins that are not physically part of the complex but contribute to proper functioning of the complex. This will lead to disagreements in the form of false positives. Disagreements between the SVM and MYGD in the form of false negatives may occur for a number of reasons. First, genes that are classified in MYGD primarily by structure (e.g., protein kinases) may have very different expression patterns. Second, genes that are regulated at the translational level or protein level, rather than at the transcriptional level as measured by the microarray experiments, cannot be correctly classified by expression data alone. Third, genes for which the microarray data is corrupt may not be correctly classified. False positives and false negatives represent cases in which further biological experimentation may be fruitful. Many of the false positive genes in Table 2 are known from biochemical studies to be important for the functional class assigned by the SVM, even though MYGD has not included these genes in their classification. For example, YAL003W and YPL037C, assigned repeatedly to the cytoplasmic ribosome class, are not strictly
PNAS u January 4, 2000 u vol. 97 u no. 1 u 265
GENETICS
clustering, the histone cluster only identified 8 of the 11 histones, and the ribosome cluster only found 112 of the 121 genes and included 14 others that were not ribosomal genes (1). We repeated the experiment with all four SVMs four more times with different random splits of the data. The results show that the variance introduced by the random splitting of the data is small, relative to the mean. The easiest-to-learn functional classes are those with the smallest ratio of standard deviation to mean cost savings. For example, for the radial basis SVM, the mean and standard deviations of the cost savings for the two easiest classes— ribosomal proteins and histones—are 225.8 6 2.9 and 18.0 6 0.0, respectively. The most difficult class, TCA cycle, had a mean and standard deviation of 10.4 6 3.0. Results for the other classes and
Table 3. Predicted functional classifications for previously unannotated genes Class
Gene
TCA
YHR188C YKL039W
PTM1
YKR016W YKR046C YPR020W
ATP20
Resp
Ribo
Prot
YLR248W YKL056C
Locus
CLK1yRCK2
YNL119W YNL255C
GIS2
YNL053W
MSG5
YNL217W YDR330W YJL036W YDL053C YLR387C
Comments Conserved in worm, Schizosaccharomyces pombe, human Major transport facilitator family; likely integral membrane protein; similar YHL017w not co-regulated. Not highly conserved, possible homolog in S. pombe No convincing homologs Subsequently annotated: subunit of mitochondrial ATP synthase complex Cytoplasmic protein kinase of unknown function Homolog of translationally controlled tumor protein, abundant, conserved and ubiquitous protein of unknown function Possible remote homologs in several divergent species Cellular nucleic acid binding protein homolog, seven CCHC (retroviral) type zinc fingers Protein–tyrosine phosphatase, overexpression bypasses growth arrest by mating factor Similar to bis (59 nucleotidyl)-tetraphosphatases Ubiquitin regulatory domain protein, S. pombe homolog Member of sorting nexin family No convincing homologs Three C2H2 zinc fingers, similar YBR267W not coregulated
The table lists the names for unannotated genes that were classified as members of a particular functional class by at least three of the four SVM methods. No unannotated histones were predicted.
ribosomal proteins; however, both are important for proper functioning of the ribosome. YAL003W encodes a translation elongation factor, EFB1, known to be required for the proper functioning of the ribosome (17). YPL037C, EGD1, is part of the nascent polypeptide-associated complex, which has been shown to bind translating ribosomes and help target nascent polypeptides to several locations, including the endoplasmic reticulum and mitochondria (18). The cell ensures that expression of these proteins keeps pace with the expression of ribosomal proteins, as shown in Fig. 1. Thus, the SVM classifies YAL003W and YPL037C with ribosomal proteins. A false positive in the respiration class, YML120C, encodes NADH:ubiquinone oxidoreductase. In yeast, this enzyme replaces respiration complex 1 (19) and is crucial for transfer of high energy electrons from NADH to ubiquinone, and thus for respiration (19, 20). A consistent false positive in the proteasome class is YGR048W (UFD1). Although not strictly part of the proteasome, YGR048W is necessary for proper functioning of the ubiquitin pathway (21), which delivers proteins to the proteasome for proteolysis. Another interesting false positive in the TCA class is YBL015W (ACH1), an acetyl-CoA hydrolase. Although this enzyme catalyzes what could be considered an unproductive reaction on a key TCA cycle-glyoxylate cycle substrate, its activity could be very important in regulating metabolic flux. Hence, it may be significant that expression of this enzyme parallels that of true TCA cycle enzymes. A distinct set of false positives puts members of the TCA pathway, YPL262W and YKL085W, in the respiration class. Although MYGD separates the TCA pathway and respiration, both classes are important for the production of ATP. In fact, the expression profiles of these two classes are strikingly similar (data not shown). Thus, although MYGD considers these two classes separate, both the expression data and other experimental work suggest that there is significant regulatory overlap. The current SVMs may lack sufficient sensitivity to resolve two such intimately related functional classes using expression data alone. Some of the false negatives occur when a protein assigned to a functional class based on structure has a special function that demands a different regulation strategy. For example, YKL049C is 266 u www.pnas.org
classified as a histone protein by MYGD based on its 61% amino acid similarity with histone protein H3. YKL049C is thought to act as a part of the centromere (22); however, the expression data shows that it is not co-regulated with histone genes. A similar situation arises in the proteasome class. Both YDL020C and YDR069C may be loosely associated with the proteasome (23–25), but the SVM does not classify them as belonging to the proteasome because they are regulated differently from the rest of the proteasome during sporulation. One limitation inherent in the use of gene expression data is that some genes are regulated at the translational and protein levels. For example, four of the five genes that the SVM was unable to identify as members of the TCA class are genes encoding enzymes known to be regulated allosterically by ADPyATP, succinyl-CoA, and NAD1yNADPH (26). Thus, the activities of these enzymes are regulated by means that do not involve changes in mRNA level. If their mRNA levels do not keep pace with those of other TCA cycle enzymes, the SVM will not be able to classify them correctly by expression data alone. Other discrepancies appear to be caused by corrupt data. For example, the SVM classifies YLR075W as a cytoplasmic ribosomal protein, but MYGD did not. However, YLR075W is a ribosomal protein (27, 28), and the original annotation in MYGD has since been corrected. Some proteins—for example, YGR207C and YGR270W—may be prematurely placed in functional classes based only on protein sequence similarities. Other errors occur in the expression data itself. Occasionally, the microarrays contain bad probes or are damaged, and some locations in the gene expression matrix are marked as containing corrupt data. Four of the genes listed in Table 2 (YPR001W, YPL271W, YHR027C, and YOL012C) are marked as such. In addition, although the SVM correctly assigns YDL075W to the ribosomal protein class, YLR406C, essentially a duplicate sequence copy of YDL075W, is not assigned to that class. Similarly, YDL184C is not assigned to the ribosome class despite the correct assignment of its near twin YDL133C-A. Because pairs of nearly identical genes such as these cannot be distinguished by hybridization, it is likely that the YLR406C and YDL184C data is also questionable. Brown et al.
ments and have made predictions aimed at identifying the functions of unannotated yeast genes. Among the techniques examined, SVMs that use a higher-dimensional kernel function provide the best performance—better than Parzen windows, Fisher’s linear discriminant, two decision tree classifiers, and SVMs that use the simple dot product kernel. These results were generated in a supervised fashion, as opposed to the unsupervised clustering algorithms that have been previously considered (1, 3). The supervised learning framework allows a researcher to start with a set of interesting genes and ask two questions: What other genes are coexpressed with my set? And does my set contain genes that do not belong? This ability to focus on the key genes is fundamental to extracting the biological meaning from genome-wide expression data. It is not clear how many other functional gene classes can be recognized from mRNA expression data by this (or any other) method. We caution that several of the classes were selected based on evidence that they clustered using the mRNA expression vectors defined by the 79 experiments available (1). Other functional classes may require different mRNA expression experiments, or may not be recognizable at all from mRNA expression data alone. However, SVMs are capable of using other data, such as the presence of transcription factor binding sites in the promoter region or sequence features of the protein (16). We have begun working with SVMs that classify using training vectors concatenated from multiple sources (16, 33). We believe these approaches have significant potential.
Conclusions We have demonstrated that support vector machines can accurately classify genes into some functional categories based on expression data from DNA microarray hybridization experi-
We thank Tommi Jaakkola for assistance in the development of the SVM software. M.P.S.B. is supported by a Program in Mathematics and Molecular Biology Burroughs Wellcome Predoctoral Fellowship. W.N.G. was supported by a SloanyDepartment of Energy Fellowship in Computational Molecular Biology. N.C. was supported as a University of California, Santa Cruz visiting researcher. The work was also supported by Department of Energy Grant DE-FG03–95ER62112 and National Science Foundation Grant DBI-9808007 to D.H. and National Institutes of Health Grant CA 77813 to D.H. and M.A.
1. Eisen, M., Spellman, P., Brown, P. & Botstein, D. (1998) Proc. Natl. Acad. Sci. USA 95, 14863–14868. 2. Spellman, P. T, Sherlock, G., Zhang, M. Q, Iyer, V. R, Anders, K., Eisen, M. B, Brown, P. O, Botstein, D. & Futcher, B. (1998) Mol. Biol. Cell 9, 3273–3297. 3. Tamayo, P., Slonim, D., Mesirov, J., Zhu, Q., Kitareewan, S., Dmitrovsky, E., Lander, E. & Golub, T. (1999) Proc. Natl. Acad. Sci. USA 96, 2907–2912. 4. Vapnik, V. (1998) Statistical Learning Theory (Wiley, New York). 5. Burges, C. J. C. (1998) Data Mining and Knowledge Discovery 2, 121–167. 6. Scholkopf, C., Burges, J. C. & Smola, A. J. (1999) Advances in Kernel Methods (MIT Press, Cambridge, MA). 7. Duda, R. O. & Hart, P. E. (1973) Pattern Classification and Scene Analysis (Wiley, New York). 8. Bishop, C. (1995) Neural Networks for Pattern Recognition (Oxford Univ. Press, New York). 9. Quinlan, J. (1997) in Programs for Machine Learning, Series in Machine Learning (Morgan Kaufmann, San Francisco). 10. Wu, D., Bennett, K., Cristianini, N. & Shawe-Taylor, J. (1999) in ICML99 (Morgan Kaufmann, San Francisco). 11. Lashkari, D. A, L., DeRisi, J., McCusker, J. H, Namath, A. F, Gentile, C., Hwang, S. Y, Brown, P. O. & Davis, R. W. (1997) Proc. Natl. Acad. Sci. USA 94, 13057–13062. 12. DeRisi, J., Iyer, V. & Brown, P. (1997) Science 278, 680–686 13. Spellman, P., Sherlock, G., Zhang, M., Iyer, V., Anders, K., Eisen, M., Brown, P., Botstein, D. & Futcher, B. (1998) Mol. Biol. Cell 9, 3273–3297. 14. Chu, S., DeRisi, J., Eisen, M., Mulholland, J., Botstein, D., Brown, P. & Herskowitz, I. (1998) Science 282, 699–705. 15. Scho ¨lkopf, B., Sung, K., Burges, C., Girosi, F., Niyogi, P., Poggio, T. & Vapnik, V. (1997) IEEE Trans. Sig. Proc. 45, 2758–2765. 16. Jaakkola, T., Diekhans, M. & Haussler, D. (1999) in ISMB99 (AAAI Press, Menlo
Park, CA), pp. 149–158. 17. Kinzy, T. G & J. L. Woolford, J. (1995) Genetics 141, 481–489. 18. George, R., Beddoe, T., Landl, K. & Lithgow, T. (1998) Proc. Natl. Acad. Sci. USA 95, 2296–2301. 19. Marres, C. A. M, de Vries, S. & Grivell, L. A. (1991) Eur. J. Biochem. 195, 857–862. 20. Kitajima-Ihara, T. & Yagi, T. (1998) FEBS Lett. 421, 37–40. 21. Johnson, E. S, Ma, P. C, Ota, I. M. & Varshavsky, A. (1995) J. Biol. Chem. 270, 17442–17456. 22. Stoler, S, Keith, K. C, Curnick, K. E. & Fitzgerald-Hayes, M. (1995) Genes Dev. 9, 573–586. 23. Fujimuro, M., Tanaka, K., Yokosawa, H. & Toh-e, A. (1998) FEBS Lett. 423, 149–154. 24. Glickman, M. H, Rubin, D. M., Fried, V. A. & Finley, D. (1998) Mol. Cell. Biol. 18, 3149–3162. 25. Papa, F. R, Alexander, Y. A. & Hochstrasser, M. (1999) Mol. Biol. Cell 10, 741–756. 26. Garrett & Grisham. (1995) Biochemistry (Saunders, Philadelphia), pp. 619–622. 27. Wool, I. G, Chan, Y.-L. & Gluck, A. (1995) Biochem. Cell Biol. 73, 933–947. 28. Dick, F. A, Karamanou, S. & Trumpower, B. L. (1997) J. Biol. Chem. 272, 13372–13379. 29. Arnold, I., Pfeiffer, K., Neupert, W., Stuart, R. A. & Schagger, H. (1999) J. Biol. Chem. 274, 36–40. 30. Gross, G., Gaestel, M., Bohm, H. & Bielka, H. (1989) Nucleic Acids Res. 17, 8367. 31. Herschlag, D., Khosla, M., Tsuchihashi, Z. & Karpel, R. L. (1994) EMBO J. 13, 2913–2924. 32. Haft, C. R, de la Luz Sierra, M., Barr, V. A, Haft, D. H. & Taylor, S. I. (1998) Mol. Cell. Biol. 18, 7278–7287. 33. Jaakkola, T & Haussler, D. (1998) in NIPS 11 (Morgan Kaufmann, San Francisco), pp. 487–493.
Brown et al.
PNAS u January 4, 2000 u vol. 97 u no. 1 u 267
GENETICS
Functional Class Predictions for Genes of Unknown Function. In addition to validating the classification accuracy of SVM methods using genes of known function, we used SVMs to classify previously unannotated yeast genes. A common trivial outcome of this experiment predicts a function for ORFs that overlap or are adjacent to annotated class members, a situation that occurs numerous times in the current set of predicted ORFs in the yeast genome. Because the expression array data is gathered with dsDNA, and because in many cases the extent of mRNA transcription beyond ORFs is not known, adjacent or overlapping ORFs cannot always be distinguished, and we ignored these predictions. Table 3 lists the 15 unannotated genes that are predicted to be class members by at least three of the four SVMs. The SVMs agree that these genes are near the indicated functional class members in expression space. The predictions below may merit experimental testing. In some cases described in Table 3, additional information supports the prediction. For example, a recent annotation shows that a gene predicted to be involved in respiration, YPR020W, is a subunit of the ATP synthase complex, confirming this prediction (29). YKL056C, a highly conserved protein homologous to the mammalian translationally controlled tumor protein (30), is co-regulated with ribosomal proteins, the first hint concerning its function. A protein containing seven retroviral type zinc fingers is also coregulated with ribosomal proteins, a compelling finding considering the activity of this type of protein as an RNA chaperone (31). In the proteasome class, YDR330W has homology to ubiquitin regulatory protein domains, suggesting a role in ubiquitin-dependent proteasome activity. The gene YJL036W is a member of the sorting nexin family (32), and we would predict that it is involved in the delivery of proteins to the proteasome. Further biological work on these genes will be necessary to determine whether their regulation is truly providing clues to their function.