School of Doctoral Studies (European Union) Journal
128
2010
Cloning DNA through the use of Recombinant DNA Technology Erik Rotenhoffen (MSc)
Candidate to PhD in Science at the School of Doctoral Studies EU Square de Meeus 37-4th Floor 1000 Brussels, Belgium email:
[email protected]
Abstract Recombinant DNA technology was used to clone specific DNA fragments. Before the technology was used, a basic understanding of the parts and details of the procedure were investigated. It was found that the larger the genome of an organism, the greater its overall complexity relative to other living organisms. This was discovered through the comparison of various genome sizes coming from known specimen. Gel electrophoresis technology was utilized to compare the relative sizes of the DNA. The gels were run from left to right with increasing level of complexity. The samples were, from left to right, plasmid DNA, lambda bacteriophage DNA, calf thymus DNA, and calf kidney DNA. As the complexity of the DNA increased, the number of bands in the lane increased to the point that the Eukaryotic DNA found in the calf thymus and kidney were smears. The gel displayed identical smearing and satellites for the calf kidney and thymus DNA, proving that the DNA is the same even though they are from different part of the organism. Through DNA fingerprinting, DNA fragments were determined that matched a specific pattern after being exposed to a restriction enzyme (HindIII). The DNA fragment containing the 2.0 λ fragment was determined by comparing the electrophoresed cut DNA to known standards and also observing that two highly conserved sequences were seen on the gel after electrophoresis. Through the use of ligation and transformation, DNA cloning was accomplished. Tests were run that involved electrophoresis and digestion by HindIII in order to fingerprint the DNA. The clone was identified as the desired sample through the use of transformation to identify white colonies (those with the insert) and blue colonies (those lacking the insert). The DNA molecule desired was then isolated through the use of a special resin that binds to DNA at high salt and not at low salt. The DNA is purified and the cloned sample is obtained. To verify that the cloned sample contains the correct ligating insert, digestion of the DNA was performed with HindIII and electrophoresed. The samples were found to contain the 2.0 kbp lambda fragment verifying that the sample was indeed cloned by recombinant DNA technology. Key words: DNA Technology, Cloning, Genetics, Biotechnology.
Introduction Over the course of this lab experiment, recombinant DNA technology was used to clone specific DNA fragments. There were several steps to this procedure that utilized various forms of technology and information. The steps performed involved analysis of the anatomy and evolution of the genome, genetic fingerprinting of an unknown sample, the recombinant DNA technology which can be split into ligation, fingerprinting, miniprep, and digestion (Leisner and Shemshedini, 2009).
To fully understand the results and significance of cloning DNA through the use of recombinant DNA technology, a basic understanding of DNA must be obtained. DNA is the genetic material of all living organisms and some viruses. DNA is composed of sugardeoxyribose, phosphates, and nitrogenous bases. DNA is double-stranded, and the sequence of bases found in DNA is a way of storing genetic information. DNA is either replicated or transcribed into RNA, which is then translated into proteins that determine what happens within cells (Leisner and Shemshedini, 2009). The
School of Doctoral Studies (European Union) Journal - 2010
2010
Cloning DNA through the use of Recombinant DNA Technology
genome in an organism is its total complement of DNA. The size of DNA is quantified by giving them in terms of base pairs or in kilobase pairs for large genomes. There are two major groups of organisms: Eukaryotes and Prokaryotes. These classes are based on genome type. DNA is also found in non-cellular entities such as plasmids, viruses, and cellular organelles. Genome size is directly related to complexity of a life form. The larger the genome size is, the more complex the life form (Leisner and Shemshedini, 2009). Plasmids are DNA molecules that are circular in shape and found in most species of bacteria that exist apart from the bacterial chromosome. These molecules encode a small number of genes. Many of the genes that allow bacteria to be resistant to antibiotics are found on plasmids. Viruses are non-cellular organisms and composed of protein and nucleic acid. Cellular organelles contain small circular DNA molecules that encode a few genes. The method used to compare various DNA molecules is to measure the distance migrated from the point of insertion in an electrophoresed gel and to plot it against the log of the molecular weight. Gel electrophoresis is the placement of a gel containing samples of DNA, in this case, into SDS-agarose (a detergent) for denaturing and an electrical charge is put through the medium. The DNA have been stained prior to insertion so that the bands will be visible under ultraviolet light (Leisner and Shemshedini, 2009). The DNA molecules carry a negative charge and move toward the positive electrode. The distance migrated from the point of insertion can be measured and compared to a set known of standards that form a calibration curve in order to obtain the molecular weight of the DNA (Leisner and Shemshedini, 2009). The main difference between electrophoresis of DNA from proteins is that the DNA is digested with restriction enzymes. Restriction enzymes are proteins that cleave DNA at specific locations. A restriction enzyme will cut the DNA at a specific sequence that it recognizes. The cleavage can be blunt or sticky ended. When two sticky ends glue together with another enzyme called DNA ligase specific DNA fragment cloning is possible (Leisner and Shemshedini, 2009). A genetic fingerprint is the specific patter of restriction enzyme-generated fragments. An example of such a genetic fingerprint comes in the case of the comparison between Herpesviridae and Iridoviridae families (Leisner and Shemshedini, 2009). Herpesviridae’s specific pattern is that when cut by restriction enzyme HindIII, two highly
129
conserved DNA sequences are found. In Iridoviridae only a single highly conserved DNA sequence is found when cleaved with HindIII (Leisner and Shemshedini, 2009). Ligation and transformation of DNA into bacteria is the initial step in molecular cloning. An insert (the specific DNA molecule to be cloned) is produced with proper ends by cleavage with a restriction enzyme. The insert is then joined to the vector (another DNA molecule) by DNA ligase (Kornberg 2005). The vectorinser molecule is then propagated with bacteria through a process known as transformation. The vector in this case is a plasmid, pUC18, which is propagated with host bacteria (E. coli) (Kornberg 2005). The way of distinguishing between the bacteria that have taken up the vector with insert and those that have not depends on β-galactosidase. If bacteria have taken up the vector with insert then they will be able to grow on plates containing ampicillin, an antibiotic (Leisner and Shemshedini, 2009). If it does not have the vector with insert, then the bacteria will not propagate on the plate containing ampicillin. Another means of determining which bacteria haven taken up the insert is by determining the color of the bacteria when exposed to X-GAL. The β-galactosidase gene splits the compound X-GAL into X + GAL. When X is freed, a blue color is seen. A blue colony demonstrates that the insert was not taken up, and a white colony establishes that the bacteria contain the insert (Reddi, 2000). Minipreparations are performed on the ligated, digested, and inoculated bacteria. A miniprep is the isolation of DNA from small bacterial cultures. The process for the miniprep is to pick and grow specific bacterical colonies from a transformation plate containing both blue and white colonies. From the liquid culture, the bacteria will be concentrated, broken open, and the plasmid DNA will be purified (Leisner and Shemshedini, 2009). Purification is based on the idea that DNA, when present at high salt, binds to a special resin and does not bind to the same resin at low salt. A cell lysate is then run over the column to purify plasmid DNA. When the plasmid binds to the column, the rest of the bacterial cell materials will be washed away (Reddi, 2000). The DNA is the released from the column giving a pure preparation of plasmid DNA (Leisner and Shemshedini, 2009). The DNA is then digested with HindIII to determine which 1 DNA fragments have been cloned. The overarching hypothesis for this entire process is that by using
Rotenhoffen E. - Cloning DNA through the use of Recombinant DNA Technology
School of Doctoral Studies (European Union) Journal
130
recombinant DNA technology, one can clone specific DNA fragments (Leisner and Shemshedini, 2009).
Materials and Methods The materials and methods can be found verbatim within the Fundamentals of Life Science I Lab Honors manual by Dr. Scott Leisner and Dr. Lirim Shemshedini, except where noted in the following. In the lab for DNA fingerprinting, the standards did not come out in a readable fashion so the standards readings obtained in the lab for analysis of the anatomy and evolution of the genome was used. For the white colonies used in inoculation and later for isolation and digestion, a liquid colony with already prepared bacteria with insert was used because the colonies on Transfomation 4 were satellite colonies and unusable.
Results The results that will soon be presented are used to either refute or support the hypothesis that using recombinant DNA technology allows for the cloning of specific DNA fragments. Several tests were performed in order to test this hypothesis. The anatomy and evolution of the genome was under study. Genetic fingerprinting
2010
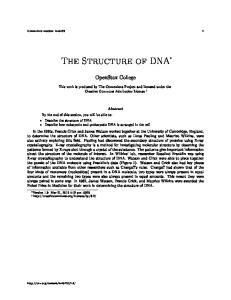
was performed. Recombinant DNA procedures were used to attempt to clone specific DNA fragments, and the results of all these tests follow. 3 The anatomy and evolution of DNA was under examination. The purpose of this lab was to examine the complexity of different genomes, determine if all of the DNA within different cells of an organism is the same, and determine the size of DNA molecules. The complexity of different genomes was determined based on the principle that the larger the genome size, the more complex the life form. The size of the DNA molecules is determined by electrophoresing the samples and comparing the distances they travel from the point of insertion to known standards, in this case the standard is the restriction enzyme map for lambda bacteriophage DNA, and plotting their log base 10 values on a graph to determine molecular weights (Table 1). In Graph 2, the lambda bacteriophage DNA standards are graphed for comparison with the plasmid DNA and the calf DNA. It was determined that the DNA within different cells of an organism are the same by comparing the distances the DNA traveled and the amount of bands in the calf thymus DNA and the calf kidney DNA, if the distances traveled are the same, and the amount of bands is equal then the different cells of an organism are the same (Table 1 and Graph 1).
Figure 1. Photograph of UV Transilluminated Electrophoresed Gel of Plasmid DNA, Lambda bacteriophage DNA, Calf Thymus DNA, and Calf Kidney DNA
P λ
T K
23.1 kb 9.4 kb 6.6 kb
1.44 kb 4.4 kb
2.77 kb
2.3 kb
1.44 kb
P = Plasmid DNA
2.0 kb
λ = Lambda Bacteriophage DNA T = Calf Thymus DNA
0.56 kb
K = Calf Kidney DNA School of Doctoral Studies (European Union) Journal - 2010
Cloning DNA through the use of Recombinant DNA Technology
2010
131
Table 1. Distance Migrated and Size of DNA Molecules for Standards, Calf DNA, and Plasmid DNA Distance Migrated by Standards (cm)
DNA Fragment Length Log Kilobase Pairs
Sizes of DNA molecules in Standards
3.7
1.36
23.1
4.5
0.97
9.4
5.0
0.819
6.6
Plasmid DNA
7.2
0.443
2.77
5.8
0.643
4.4
8.6
0.158
1.44
7.3
0.361
2.3
Calf thymus DNA (satellite)
7.5
0.301
2.0
Calf kidney DNA (satellite)
8.6
0.158
1.44
11.1
-0.252
0.56
Sample
Distance Migrated (cm)
DNA Fragment Length Log Kilobase Pairs
Sizes of DNA Molecules (kb)
Graph 1. Lambda Bacteriophage DNA Log Base 10 of Molecular Weight versus Distance Migrated
Genetic fingerprinting was performed using restriction enzymes to distinguish different virus genomes. This was accomplished by comparing an unknown virus with known characteristics of being an enveloped double-stranded, DNA-containing virus temporarily named KDV to two viruses of known molecular weight that match the unknown viruses characteristics. By comparing the sizes of the KDV DNA fragments with DNA standards of known sizes, the family that KDV belongs to can be determined. This is accomplished by electrophoresing the unknown sample, the standards, and the two virus families (Figure 2) and graphing the distance the samples traveled from the point of insertion to determine the molecular weight of the KDV DNA
to determine its identity (Graph 2). By determining the molecular weight of the unknown, the weight and identity of the KDV DNA can be determined (Table 2). Also in Table 2 is the log base 10 values of the Standard DNA standard weights, but the method for obtaining the molecular weight of the DNA was changed slightly. The Standards distance traveled could not be measured, because they traveled off the gel. This error was remedied by comparing the distance traveled by the two known viruses (Herpesviridae and Iridoviridae) and unknown virus (KDV) to the previously run standards that had been used in the lab studying the evolution of DNA. The two known viruses belong to the Herpesviridae and Iridoviridae families. The main difference between
Rotenhoffen E. - Cloning DNA through the use of Recombinant DNA Technology
School of Doctoral Studies (European Union) Journal
132
2010
the Herpesviridae family of viruses and the Iridoviridae family is that the Herpesviridae family of viruses contains two highly conserved DNA sequences that are cut by the Restriction enzyme HindIII, and when the same process is performed on Iridoviridae one conserved HindIII site is seen. Graph 2 displays the molecular weights and the distance traveled by the standards. The virus that will be taken from the Herpesviridae family is the Herpes Simplex Hemorrhagic Virus (HSHV), and the
virus from the Iridoviridae virus family is the Chicken Hemorrhagic Anemia Virus (CHAV). Table 2 contains all the molecular weights of the unknown, known, and standard DNA fragments with the log base 10 values and the distance traveled from the point of insertion for the unknown and known DNA fragments. No bands of unusual size are seen in Figure 2, showing that the test went just as expected except for the standards going off the gel.
Figure 2. Picture of Electrophoresed Gel Containing Standards, HSHV Cut and Uncut, CHAV Cut and Uncut, and KDV Cut and Uncut
Table 2. Molecular Weights of Standards, CHAV, KDV, and HSHV and the Distance Traveled in Electrophoresed Gel by CHAV, KDV, and HSHV Distance Migrated (cm)
DNA Fragment Length Log Kilobase Pairs
Molecular Weight (kbp)
Cut HSHV 1
4.5
0.301
2
Cut HSHV 2
4.3
0.431
2.7
Cut CHAV
3.6
0.672
4.7
Uncut HSHV 1
3.1
0.877
7.5
Uncut HSHV 2
3.9
0.561
3.6
Uncut CHAV 1
3.3
0.798
6.3
Uncut CHAV 2
4.2
0.443
2.8
Uncut KDV 1
3.1
0.877
7.5
Uncut KDV 2
3.9
0.561
3.6
Cut KDV 1
4.5
0.301
2
Cut KDV 2
4.3
0.431
2.7
Molecular Weights of Standards (kbp)
Distance Migrated (cm)
DNA Fragment Length Log Kilobase Pairs
23.1
3.7
1.36
9.4
4.5
0.97
6.6
5.0
0.819
S = λ Bacteriophage DNA Standards
4.4
5.8
0.643
HU = HSHV Uncut
2.3
7.3
0.361
2
7.5
0.301
0.56
11.1
-0.252
S
HU HC KU
KC CU
CC
Sample
6.3 kbp
7.5 kbp 2.7 kbp
2.7 kbp
7.5 kbp
4.7 kbp
3.6 kbp 3.6 kbp 2.8 kbp 2.0 kbp
HC = HSHV Cut with HindIII KU = KDV Uncut
2.0 kbp
KC = KDV Cut with HindIII CU = CHAV Uncut CC = CHAV Cut with HindIII
School of Doctoral Studies (European Union) Journal - 2010
2010
Cloning DNA through the use of Recombinant DNA Technology
133
Graph 2. The Standards from Graph 1 used to Compare Against to Discover the Molecular Weight of KDV Virus Fragments
The initial steps in the recombination of DNA were to clone 2.0 kbp λ-DNA fragment generated by HindIII digestion into the plasmid pUC18. This was accomplished by producing large amounts of the specific DNA molecule (pUC18) so that it may be manipulated. The insert (pUC18) is cleaved with HindIII and ligated back together in ligation. Ligation is the process of joining the insert to another DNA molecule (the vector) through DNA ligase. Once the insert was ligated to the vector, it was introduced into host bacteria. The bacteria then begin to propagate rapidly, which in turn leads to the production of large amounts of the vector-insert molecule. The bacteria in this lab were Escherichia coli (E. coli). The process of producing large amounts of vector-insert molecule through the introduction to bacteria is called transformation. The bacteria that take up the pUC18 with the insert will be white and have no functional enzyme. The production of β-galactosidase gene splits the compound into X + GAL instead of X-GAL. The bacteria colonies that express a nonfunctional β-galactosidase enzyme appear white on plates containing X-GAL. The purpose of the second part in the recombination of DNA was to isolate plasmid DNA from E. coli harboring pUC18 plasmids with λ-DNA fragment inserts and cut the DNA with HindIII. Bacteria from Transformation 4, both blue and white colonies were to be taken for inoculation. The white colonies could not be obtained because they are
satellite colonies that grow from enzyme excretion. The samples were obtained from already prepared liquid forms of the white colonies. The inoculation was performed by streaking a blue colony from Transformation 4 and five white colonies from separate liquid forms onto a LB AMP X-GAL plate. These samples were also placed in a liquid culture of LB AMP medium. Concentrating the bacteria then breaking them open for purification was the first step to isolating the plasmid DNA from E. coli that had the pUC18 plasmids with λ-DNA fragment inserts. The DNA was purified based on the idea that DNA, when present at high salt, binds to Wizard Minipreps DNA Purification Resin. A cell lysate is then run over the column to purify the sample. The plasmid DNA is now bound to the column and the rest of the cell will be washed away. The DNA is then released from the column giving a high purity preparation of plasmid DNA. The samples are digested with HindIII in order to determine which 1 DNA fragments have been cloned. The two transformation 2 plates were compared, and the T2 with the LB AMP X-GAL had no colonies (although, it should have had blue colonies). The T2 without AMP had smeared bacteria because no antibiotics were present. The number of colonies found on the well plates was recorded as well as there color (Table 3). The color of the streaked columns from Transformation 4 is also recorded (Table 4).
Rotenhoffen E. - Cloning DNA through the use of Recombinant DNA Technology
School of Doctoral Studies (European Union) Journal
134
Table 3. The Characteristics of the E. coli Strands on the Plates T1
T2
T3
T4
0
0
0
12
N/A
N/A
N/A
Number of colonies Color of colonies
T2 (LB)
2010
Figure 3. Picture of Electrophoresed Gel containing Known Standards, Uncut DNA from Blue Colony, Cut with HinDIII DNA from Blue Colony, and 5 Cut DNA with HindIII from White Colonies
Smeared
Blue and White Satellite
Not Distinguishable
Table 4. The Characteristics of the Streaked Samples from the Tranformation 4 Plate Streaked Column Number Color
1 Blue
2
3
4
5
6
White
White
White
White
White
The final procedure for recombinant DNA was to identify plasmids that have the 2.0 kbp λ-DNA fragments. This was accomplished by running the digested DNA HindIII on a gel to separate the DNA fragments (Figure 3). The colonies were compared to blue uncut and cut DNA and known standards (Figure 3). The molecular weight of the fragments was determined, and by discovering the molecular weights of the fragments and comparing them to the known weight (2.7 kb) for the pUC18. The image of the electrophoresed gel is seen in Figure 3. The distance traveled by each of the DNA fragments was recorded and placed in Table 4, the standards were then graphed with their molecular weights against how far they migrated from the point of insertion so as to obtain the molecular weights of the DNA fragments in the blue and white colonies (Table 5 and Graph 3). No bands of unusual size were seen in the white colony samples, but the blue colony sample did contain a band that was found to contain a DNA fragment of 2.5 kb. After all the samples have been digested and electrophoresed, the type of E. coli strains are determined based on their characteristic of whether or not they contained the insertvector molecule or were simply E. coli with the vector or had a different connecting sequence length from 2.0 kb (Table 6). From the table it was obtained that all the original colonies (pJB2-pJB3) contain the 2.0 kb λ DNA fragment. No bands of unusual size were seen on the electrophoresed gel (Figure 3).
S = Standard DNA BU = Blue Colony Uncut BC= Blue Colony Cut by HindIII W1 = White Colony Cut by HindIII W2 = Different White Colony Cut by HindIII W3 = Different White Colony Cut by HindIII W4 = Different White Colony Cut by HindIII W5 = Different White Colony Cut by HindIII
Table 5. The Molecular Weights and Distance Traveled by the Standards, the Blue Colony both Cut and Uncut, and the Five Cut White Colonies Distance Migrated (cm)
DNA Fragment Length Log Kilobase Pairs
Sizes of DNA molecules (kb)
3.1
0.699
5
3.3
0.602
4
3.7
0.477
3
3.9
0.398
2.5
4.3
0.301
2
4.8
0.176
1.5
5.8
0
1
6.4
-0.125
0.75
7.2
-0.301
0.5
8.2
-0.602
0.25
School of Doctoral Studies (European Union) Journal - 2010
Sample
Standards
Cloning DNA through the use of Recombinant DNA Technology
2010
Distance Migrated (cm)
DNA Fragment Length Log Kilobase Pairs
Sizes of DNA molecules (kb)
Sample
N/A
N/A
N/A
Blue Uncut
4.1
0.392
2.7
Blue Cut
4
0.416
2.7
White 1
4.4
0.321
2.0
White 1
4
0.416
2.7
White 2
4.4
0.321
2.0
White 2
4
0.416
2.7
White 3
4.4
0.321
2.0
White 3
4
0.321
2.7
White 4
4.4
0.321
2.0
White 4
4
0.416
2.7
White 5
4.4
0.321
2.0
White 5
135
Graph 3. The DNA Standards Molecular Weights Versus the Distance Migrated
Table 6. The Characteristics and Plasmid Names of the Different E. coli Strains Created
Rotenhoffen E. - Cloning DNA through the use of Recombinant DNA Technology
School of Doctoral Studies (European Union) Journal
136
Calculations For each lab standard graph, the log base 10 was taken of the molecular weight and plotted against the distance migrated from the point of insertion. Example (From Table 1) log (molecular weight) = log base value log (23.1) = 1.364 To determine the molecular weight of the unknown samples being tested in each case, the distance migrated values were plugged into the trend line equation and that value was then used as a power of ten to obtain the molecular weight. The example is taken from the plasmid DNA in Table 1. Example (From Table 1) x = distance migrated (cm) y = log base 10 value of molecular weight y = -0.204x + 1.912 = -.204(7.2) + 1.912 = 0.443 To find the molecular weight the log base 10 value is taken as a power of ten. Molecular weight = 10(log base 10 value)
= 100.443
= 2.77 kbp
Discussion The hypothesis for the entire experiment that was performed was that by using recombinant DNA technology, one can clone specific DNA fragments. The results were used to determine whether or not this claim is supported. In testing the anatomy and evolution of the genome, the larger the genome size the more bands were found when the DNA was electrophoresed. In the example found
2010
in Figure 1 and Table 1, the plasmid DNA was found to have one band signifying that it had a small genome, and, therefore, was low in complexity compared to the calf thymus and kidney DNA. The calf thymus and kidney DNA are shown to have a high complexity based on how the electrophoresed gel containing the DNA was a giant streak for each sample. The samples were also identical when electrophoresed, the streaks were the same and the satellite band that was visible in each sample was in the same place for both. Table 1 showed that the satellite for each was 1.44 kb in molecular weight. This would lead to the conclusion that the DNA in the kidney of the calf was the same as the DNA in the thymus. The satellite and plasmid bands were of relative similarity to the maps provided for comparison. The procedure ran smoothly and the weights and distances migrated of all the samples were easily determined. Genetic fingerprinting was also performed using an unknown virus labeled KDV and comparing it to a set of standards and two known viruses (HSHV and CHAV). The sizes of the HSHV bands seen in Figure 2 are as expected. The cut HSHV DNA has two bands one weighing at 2.7 kb and the other 2.0 kb, just as was described. KDV was found to belong to the Herpesviridae family of virus as seen in Table 2. The results showed that the bands and molecular weights of the DNA fragments for KDV matched perfectly with that of HSHV, which comes from the Herpesviridae family. Although the Standards did not come out as expected, this was remedied by using previously obtained standards. Everything else went as expected and the results supported the hypothesis. The next section of the procedure in DNA cloning revolves around recombinant DNA technology. This process works because of the development of methods for propagating large amounts of a specific DNA molecule. This process involves the production of a specific DNA molecule (the insert) in large amount so that it may be manipulated. The insert is the produced with proper ends for the cloning by cleaving with a restriction enzyme. This insert molecule is then jointed to the vector (another DNA molecule) by DNA ligase, which utilizes ATP. Transformation is the performed, which is the introduction of the vector-insert molecule into bacteria. The bacteria are allowed to propagate and large amounts of the vectorinsert molecule are created. The procedure did not go exactly as planned. The Transformation 2 should have had blue colonies but none formed, signaling an error in
School of Doctoral Studies (European Union) Journal - 2010
2010
Cloning DNA through the use of Recombinant DNA Technology
procedure. Transformation 4 also had a problem in that the white colonies that formed could not be used because they were satellite colonies. The second part of the recombinant DNA procedure involved the isolation and digestion of the DNA in a process known as a miniprep. The colonies stayed white after patching on the new plate indicating that a sample of the desired DNA with insert has been created. When Transformation 2 was compared with the Transformation 2 that was placed on the plate that had only LB, it allowed for the visualization of the effectiveness of the antibiotic. Even though blue colonies should have formed on the Transformation 2 with LB AMP X-GAL, this did not deter the fact that the antibiotic did mutate the bacteria from its original state. The Transformation 2 with just LB was seen as being a smeared plate indicating the existence of large unquantifiable bacteria existence. There were two problems that occurred during the miniprep. The problem being the nonexistence of blue colonies on Transformation 2 and the existence of unusable satellite colonies on Transformation 4. This problem can be attributed to a procedure error in which the bacteria were probably incorrectly placed onto the plate. The final electrophoresed gel gave results
137
showing that five bacterial colonies harboring the 2.0 λ DNA fragment. The blue uncut colony did not show up as having a band, and the cut blue colony only showed a 2.7 kb band (Figure 3). There were no unusual bands, leading to the conclusion that the experiment ran as expected. The names of the plasmids are as follows: pJB1 (pUC18), pJB2, pJB2, pJB3, pJB4, pJB5, pJB6. PJB2-pJB6 came from the white colonies. The hypothesis that using recombinant DNA technology one can clone specific protein was supported by the fact that 5 colonies were created that contained the specific 2.0 λ DNA fragment, signaling that the bacteria contained the desired insert-vector molecule.
References Kornberg, A., & Baker, T. (2005). DNA Replication. University Science Books. Leisner, S. & Shemshedini, L. (2009). Fundamentals of Life Sciene I Lab Honors. Reddi, O.S. (2000). Recombinant DNA Technology. Allied Publishers.
Rotenhoffen E. - Cloning DNA through the use of Recombinant DNA Technology