VOL. 11, NO. 20, OCTOBER 2016
ISSN 1819-6608
ARPN Journal of Engineering and Applied Sciences ©2006-2016 Asian Research Publishing Network (ARPN). All rights reserved.
www.arpnjournals.com
DESIGN AND IMPLEMENTATION OF COOKING OIL AND WATER FILTRATION SYSTEM FOR DOMESTIC APPLICATION Dhanakkumar Sudiskumar1, Firas B. Ismail1 and Mohammad Shakir Nasif2 1
Power Generation Research Centre,College of Engineering,Universiti Tenaga Nasional, Bangi, Selangor, Malaysia 2 Mechanical Engineering Department, Universiti Teknologi Petronas, Bandar Seri Iskandar,Malaysia E-Mail:
[email protected]
ABSTRACT Piping is an important system within any premise. Without a proper piping system, daily activities would be disrupted. As such kitchens are one of the premises that utilise water in large amounts. However, there are a lot of oily content in the waste water that is being flushed away in the sink of a kitchen. As a result, this oily content slowly builds up on the wall of the pipeline slowly forming greasy layer eventually causing pipe blockage. The greasy layer also attracts solid waste that is being disposed in the sink that forms large clumps within the pipeline which makes the blockage even worse. Within this study a new method was adopted in order to prevent these types of blockages. A mechanism that utilises hydro cyclone as the separator will be used to prevent the blockages from happening. The idea is to separate the oily content of the water from the waste water before it enters the exit pipeline. The concept was tested by running simulation using Computational Fluid Dynamics (CFD). The major outcome of the system was that it is capable of functioning at an efficiency of 83% with very minimal oil content at the water exit. This 83% denotes the amount of oil that is passing through the oil exit of the system. The rest of the 17% is water. These values are to be improved in future works. Keywords: flow split, velocity ratio, pressure drop, inlet mass flow rate, hydrocyclone.
INTRODUCTION Malaysia is home to a variety of cuisines and most of the cuisines have cooking oil as it’s essential ingredient in preparation. Cooking oil is typically liquid at room temperature. Frequent usage of cooking oil contributes to a lot of waste oil which is discharged into the pipelines of homes, restaurants or any other commercial kitchens. Continuous discharge could lead to pipe blockages in a certain time frame. This problem can be solved by using the oil-water separator device. An oilwater separator is a device that is used in separating gross amounts of oil from the wastewater of household kitchens or even commercial kitchens. It is also widely applied in oil refineries, petrochemical plants, chemical plants, natural gas processing plant and other industries. The design of the separator is based upon on the specific gravity difference between the oil and the wastewater. With the benefit of the specific gravity knowledge, the oil and waste water can be separated. The concept is to be tested by running simulations using CFD. Related principles and equations are of utmost importance to make the project a success. Sebastian Benavides [1] stated a few principles that were derived by Lapple, Barth, Leith and Licht which could be considered in the making of the system. On the other hand the designing process needs to be looked into as well. Lingjuan Wang [2] and Kung-Yu Kuoet.al [3], stated in their respective research of possible design approach that could lead to an efficient system in operation. Besides the design and principles, there are many variables that could be controlled or kept as manipulative variable in order to achieve better performance of the separator. Many research papers discussed these various methods. Some of it would be, Abdul Motinet.al [4], C. Oropeza-Vasquez et.al [5], and Yong Zhang et.al [6], whom all had different approaches towards making the system run with better efficiency.
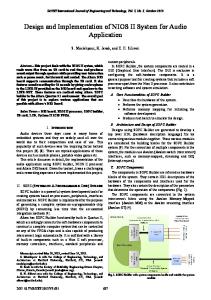
Besides all the previous research area of focus the study on the vortex end of the system itself is important. Without the vortex the system wouldn’t function in the first place. Previously, all the principles and equations are concentrated towards making the vortex formation as perfect as possible. As such, W.Penget.al [7] performed studies on this area and the research paper was used as reference in this research. A benchmarking was also done in order to know what has been considered in previous researches. Each researcher had his own approach to improve in order to get the best results out of the hydro cyclone separator. Flow split ratio is one of the most important parameter that determines the efficiency of the hydro cyclone according to most researchers. Computational fluid dynamics and actual model experimentation is the common method that is used to determine the parameters effecting the results. The outcomes of each related research papers are to be used as consideration in the development of this project Hence, with this system or device, the problem related to pipe blockages due to oil may be solved easily. This solution helps in keeping the pipeline at its highest efficiency which is the ultimate target. The oil-water separator device ensures a longer lifetime of these pipelines without any complications. MATERIALS AND METHODS Figure-1 below shows the process involved which eventually leads to building a prototype.
12222
VOL. 11, NO. 20, OCTOBER 2016
ISSN 1819-6608
ARPN Journal of Engineering and Applied Sciences ©2006-2016 Asian Research Publishing Network (ARPN). All rights reserved.
www.arpnjournals.com Phase 1 : Selection of Technology Phase 2: Identification of Principles and Equations Phase 3: Designing a 2D & 3D model Phase 4: Choosing Suitable Material Phase 5: Simulation run using CFD Phase 6: Analysis of Data Phase 7: Building of a Prototype Figure-1. Flow chart of process. Phase 1: Selection of technology. Initially, thorough studying of present technologies on oil and water separation was done. Followed by that, a comparison was done on the characteristics of the technology. Based on the comparison, the most applicable technology was chosen. Phase 2: Identification of principals and equations. Upon choosing, principals behind the chosen technology were studied. Understanding the background equations of the system that makes it work was important to make it successful. Phase 3: Designing a 2D and 3D model. Upon understanding the technology, drawing software such as CREO or SOLIDWERKS was to be used in design process. Before designing,the dimensions and limitations of the project were determined. Phase 4: Choosing suitable material. Identifying suitable material for each component of the design is important.Based on required flow characteristics, type of material to be used was determined. Comparison is done and the most suitable material was chosen. Phase 5: Simulation run using CFD software. A simulation of water flow into the oil and water separator system was to be done. Upon getting initial results, analysis of separation efficiency would be done. Followed by that, improvements will be done to increase efficiency of the system. Phase 6: Analysis of simulation data. Analysis was done upon getting the final simulation values. Based on analysis, the performance of system was known and further analysis was done for future improvements. Phase 7: Building a prototype.
A prototype of the system was built to understand the nature of the system. The size and positioning of the system are to be analysed WORK CONCEPT Previous research papers were used to extract some of the key information for initial research purposes. On year 2010, researcher Liu et al. [8] took the effort to release a research on using Euler-Euler multiphase approach and the Reynolds stress turbulence model (RSM) to stimulate the flow field characteristic of cylindrical cyclone. He then continued his research on his second paper which he considered the effects of flow split-ratio and the flow rate on the oil and water separation process [9]. Min Yang et.al [10] from his analysis, observed that, the tangential velocity increased rapidly to a maximum with increasing radial distance from the axis, and then decreased slowly, presenting the characteristics of a forced vortex near the axis, and a free vortex in the outer portion, with a transition zone in between. With reference the articles mentioned, the extracted theories were further developed and acquired into modelling a system that works properly in this area of research. Theoretically, the vortex finder of the hydrocyclone design is to be designed to be extensive up to the point below the tangential entrance of the system [11]. This is so that the mixture has sufficient separation space before the oil starts flowing off the vortex finder. In the case whereby the vortex finder is shorter and so is on the same or slightly above level compared to the entrance of the system, a large amount of water will exit through the oil exit as well. This has a huge impact on efficiency of the system. Besides that, the length of the design also matters. It’s important because retention time is effected by this characteristic. However, too long of a design also gives space for pressure drop to occur. Throughout the research, a few sets of equations have been chosen for the development of the project. This set of calculation was chosen based on a research paper by Zhisan et.al. The researcher provided the basic formulas that are required in designing a hydro cyclone separator. Comparison was also done between many other hydro cyclone related research papers one such by Odile Rambeauet.al [12].With this valuable information the related equations were plotted in Table-1 of the research paper by Zhi-san et al [13].
Table-1. List of equations. Num.
Parameter
1
Flow split
2
Pressure drop ratio
3
Reynolds number
4
Efficiency
Equation , � = × ,� � ∆ ,� ,� − , ,� = = ∆ ,� ,� − , � = � =
−
� �
×
12223
VOL. 11, NO. 20, OCTOBER 2016
ISSN 1819-6608
ARPN Journal of Engineering and Applied Sciences ©2006-2016 Asian Research Publishing Network (ARPN). All rights reserved.
www.arpnjournals.com RESULTS AND DISCUSSIONS The first initial case that was studied in the designing process was by using an inlet mass flow rate of 1kg/s. Upon completing the simulation of the case, a set of results were obtained for selected criteria.
Figure-3. Turbulence of mixture within the system.
Figure-2. Pressure profile of mixture within the body. As it can be seen for the case of pressure of mixture as shown in Figure-2, pressure drop can be observed within the system. The pressure is highest at the point of entrance of mixture which is highlighted as the red region within the picture. Observing the figure, pressure is shown to be lowest at the exits of the system. This is known as pressure drop. This is a natural scenario for the hydrocyclone system. Controlling the pressure drop of the system is important for better efficient system. An efficiency calculation was done based on the volume fraction data for this case (mass flow rate=1 kg/s), and it will be noted at later parts of the discussion. Observing Figure-3, the turbulence of the mixture within the system can be observed. In any case of hydrocyclone system, turbulence is to be reduced as low as possible. This is because during the separation process, the oil and water is supposed to form a clear 2 layers of interior and exterior flow within the hydrocyclone. When the flow is clear, the separation is more efficient. In the case of turbulence, the mixture flows at an unstable state, which leaves it in the form of mixture not forming a clear separation layer. This is the reason it is to be avoided as much as possible. The turbulence is usually spotted at the exits of the system. Observing Figure-3, turbulence occurs at the exits similar to the common cases as mentioned previously but is not bad as it is only around a small area. Figure-4 shows the volume fraction of the system for one particular fluid within the mixture which is water. Water is noted as phase 1 during the simulation. That explains the reason it is noted as phase 1 within the picture. Observing the figure, it could be observed that the highest volume of water within the system is recorded at the bottom exit of the system. The red profile within the system highlights the areas which water was noted to be of the highest volume recorded during the simulation. The lowest volume of water was recorded for water more towards the higher end of the system. This explains the fact that water is the heavier liquid within the mixture and it moves down quickly upon entering the system.
Figure-4. Volume fraction profile of water (phase 1) within the system. Figure-5 shows the volume fraction of oil within the mixture which is also known as phase 2 in the simulation. Observing Figure-5, a totally opposite scale of results can be observed compared to Figure-3 in terms of volume concentration location of oil. Oil is observed to be most concentrated at the top end of the system and also the top exit. This is exactly how the system is to function. Oil is to move upwards once forming the centre core of the hydrocyclone. As observed in Figure-5, this is definitely the case in the simulation that was run for the case of inlet mass flow rate of 1 kg/s. Oil concentration is the lowest at lower region of the system. This is a good sign as the main objective of the separation is to prevent oil flow into main pipeline. Since the bottom exit is connected to main pipeline and is reserved only for water to exit, this result seems to be satisfyingly according to objective. Comparing Figures 4 and 5, the efficiency of the system can be calculated for the investigated case. This calculation is done by comparing the volume fraction of oil and water in the top exit of the system. Minimal water in the exit shows that the system is only extracting oil to the top exit and is working as expected. Upon comparing and conducting minor calculation, this case of 1 kg/s inlet mass flow rate of mixture seems to be functioning at a level of 51% efficiency. This is not exactly a good efficiency rate for the system but from this case it is now a known fact that the system actually works. Hence, different case was simulated by varying the inlet mass flow rate of the system to observe and determine the inlet mass flow rate that provides the best results in terms of efficiency. The series of simulation involved different inlet
12224
VOL. 11, NO. 20, OCTOBER 2016
ISSN 1819-6608
ARPN Journal of Engineering and Applied Sciences ©2006-2016 Asian Research Publishing Network (ARPN). All rights reserved.
www.arpnjournals.com mass flow rates which are 1.5, and 2.0 kg/s. The results obtained are as shown below.
Figure-7. Oil volume fraction of best results. Figure-5. Volume fraction profile of oil (phase 2) within the system. Upon running simulations for 1.5 and 2 kg/s cases the system’s performance reduced compared to before. The system noted an efficiency of 24.5% for 2kg/s case. The increase of mass flow rate at inlet continuously showed a drop in terms of efficiency of the system. Hence, it was decided that the best inlet mass flow rate for the system is 1 kg/s. However, the efficiency of the 1 kg/s inlet mass flow rate system did not possess a rather attractive digit in terms of efficiency. So, further variation was done on other aspects for improvement of the system efficiency by setting inlet mass flow rate of 1 kg/s as a constant value. Figures 6 and 7 recorded and shows the best results that finalised on the best characteristics of the system. This system was set to run at a flow split of 3, velocity ratio of 5 and pressure difference of 2. The values were decided based on a series of simulation. This system recorded an efficiency of 83% after the final simulation run. These results were considered as more efficient than the previously set target and far better than the initial value of efficiency obtained which was 51%. Hence, these results were accepted as the best results and characteristics of the system.
Comparing Figure-2 and Figure-8 shows that there is a huge decrease in terms of pressure difference between the inlet region and outlet region. The pressure difference i much lesser in Figure-8. This shows that there is less pressure drop within the system. This scenario is good as it provides with a system with better efficiency all together. Drastic improvement can also be observed in terms of turbulence within the system.
Figure-8. Pressure of mixture within the system for best results. Based on Figure-9 a slight amount of increase can be observed compared to Figure 3 in the initial system. The location of turbulence remains the same as initial case which is near the exits and mostly on the top exit near the inlet to the system. It can be observed as the red highlighted region. Figure-9 shows a highest turbulence value of 1.54 m2/s2. But the highest value is very minimal in the region. Hence, it is considered as within the acceptable range as all the changes made only contributed to better efficiency even when the turbulence increased by a slight margin.
Figure-6. Water volume fraction of best results.
12225
VOL. 11, NO. 20, OCTOBER 2016
ISSN 1819-6608
ARPN Journal of Engineering and Applied Sciences ©2006-2016 Asian Research Publishing Network (ARPN). All rights reserved.
www.arpnjournals.com REFERENCES [1] Sebastian B. 2012. Cyclone Separator.www.ipt.ntnu.no/~jsg/studenter/prosjekt/ 2012BenavidesEmne.pdf, [2] Lingjuan W. 2004. Theoretical Study of Cyclone Design. Biological and Agricultural Engineering.
Figure-9.Turbulence of the mixture for the best results. In Figure-10 (final results), the flow lines can be observed resembling the nature of the hydrocyclone. The centre formation which is in yellow at the upper half of the hydrocyclone body shows the inner vortex (oil) and the outer layer surrounding it is the outer vortex (water).
[3] Kung-Yu K. and Chuen-Jinn T.2001. On the Theory of Partial Cutoff Diameter and Collection Efficiency of Cyclones. Institute of Environmental Engineering. Vol. 1. No. 1. pp. 47-56. [4] Abdul M., Mark D. G., Volodymyr V. T. and Andre B. 2013. Simulations and Performance of the Crossflow Filtration Hydrocyclone (CFFH) for OilWater Separation. [5] C. Oropeza-Vazquez, E.Afanador, L.Gomez, S.Wang, R. Mohan and O. Shoham. 2004. Oil-Water Separation in a Novel Liquid-Liquid Cylindrical Cyclone (LLCC) Compact Separator-Experiments and Modelling. The University of Tulsa. [6] Yong Z., Minghu J., Lixin Z. and Feng L. 2009. Design and Exprimental Study of Hydrocyclone in Series and in Bridge of Downhole Oil/Water Separation System.
Figure-10. Flow of oil and water mixture within separator. CONCLUSIONS Cooking oil being essential is not something that could be avoided. However, as a result of usage pipe blockages can’t be avoided either if it is being dumped into the sink. Pipe blockages can lead to a series of many other related problems which is a complete hassle to any party leading the area. Hence, a method using hydro cyclone technology was designed to solve the problem. The hydro cyclone design requires some important characteristics to be fulfilled in order to get the best out of the separator. Inlet mass flow rate, split ratio, velocity ratio and pressure drop is one of the most important criteria to be looked at in designing a hydro cyclone. Variation can also be done in terms of design dimensions. Better results can be achieved with the same parameters but different dimension of model. However, dimensions were not considered as varying factor in our case study. Future works is to be done in this area. The efficiency of the separation effect depends on very accurate designing. This system has met the target set in the beginning which was above 80% efficiency at oil exit (achieved 83%) but can be improved further for better efficient system.
[7] W.Peng, A.C. Hoffman, H.W.A. Dries, M.A. Regelink and L.E. Stein. 2005. Experimental Study of Vortex End in Centrifugal Separators: The nature of the Vortex End. Chemical Engineering Science, [8] Jing-yu X., Ying-xiang W. and Zheng Hai-fei L. 2010. Numerical study on oil and water two-phase flow in a cylindrical cyclone.Hydrodynamics. p. 6. [9] Jing-yu X., Zhang J., Huan-qiang S., Zhang J., Yingxiang W.and Hai-fei L. 2011. Oil/ water separationin a liquid-liquid cylindrical cyclone.Hydrodynamics. p. 8. [10] Ningyu Z., Yingxin G., Wei A. and Min Y. 2009. Investigation of velocity field and oil distribution in an oil–water hydrocyclone using a particle dynamics analyser. Chemical Engineering Journal. [11] Carlos H.G. 2001. Oil-Water Separation in LiquidLiquid Hydrocyclones (LLHC) – Experiment and Modeling. Discipline of Petroleum Engineering. University of Tulsa.
12226
VOL. 11, NO. 20, OCTOBER 2016
ISSN 1819-6608
ARPN Journal of Engineering and Applied Sciences ©2006-2016 Asian Research Publishing Network (ARPN). All rights reserved.
www.arpnjournals.com [12] Odile R., Tormod D., Torleiv B. and Trygve H. 2006. Performance of a deoiling hydrocyclone during variable flow rates.Minerals Engineering. p. 12. [13] Zhi-shan B., Hua-lin W. and Shan-Tung T. 2011. Oil– water separation using hydrocyclones enhanced by air bubbles. Chemical Engineering Research and Design. p. 5.
12227