Design and Implementation of the EASTWeb System Isaiah Snell-Feikema and Yi Liu Michael Wimberly Department of Electrical Engineering GISc Center of Excellence and Computer Science South Dakota State University Brookings, SD 57007
[email protected],
[email protected],
[email protected]
Abstract The EASTWeb system was designed to automate the retrieval, processing, and storage of satellite remote sensing data for public health officials and GIS researchers. This paper describes the motivating factors behind the design and implementation of the EASTWeb system and focuses on presenting how the system architecture was designed based on Parnas’s information hiding modularization methodology. The paper uses a case study to show the ability of the design to account for large changes in the implementation of the system. The initial implementation of the EASTWeb system suffered from reliability and performance issues related to its reliance on ArcGIS, a commercial geospatial analysis tool. To solve these issues an open source geospatial library, GDAL, was used to replace ArcGIS. As a result of replacing ArcGIS, execution speeds were improved by a factor of five and there was a drop in error rates from 0.3% to less than 0.01%.
1
Introduction
The use of satellite remote sensing data to develop disease models and educate the decisions of public health officials is a promising field of research that could lead to improvements in disease prediction and response [2,4]. Accurate disease forecasts allow public health officials to intelligently deploy resources to prevent or reduce the effects of disease outbreaks. However, researchers and public health officials face a barrier to producing or accessing geospatial data, which requires geographical information studies (GIS) expertise and time consuming retrieval, processing and storage. The EASTWeb system [6] was designed to automate the retrieval, processing, and storage of satellite remote sensing data for public health officials and GIS researchers. The automation of the activities associated with producing geospatial databases makes these data more accessible to researchers and public health officials. The operations automated by the EASTWeb system require numerous different libraries and systems. To simplify the development and maintenance of the system, each module was designed to avoid interdependences between modules wherever possible. In On the Criteria to Be Used in Decomposing Systems into Modules, software engineering pioneer David Parnas states “...it is almost always incorrect to begin the decomposition of a system into modules on the basis of a flowchart. We propose instead that one begins with a list of difficult design decisions or design decisions which are likely to change. Each module is then designed to hide such a decision from the others.” [4] Early software engineers such as Parnas first recognized the importance of quality software architectural design in non-trivial software systems. Since then, these principles have been used in countless software systems in vastly different domains, from business applications like Microsoft Office to mission critical software like the Curiosity rover. This paper presents how to apply these principles successfully in the architectural design of EASTWeb that enables large changes to be performed in an existing software system with minimal modification to other interrelated components in the system. Section 2 illustrates the architectural design of the EASTWeb. Section 3 sketches the implementation of EASTWeb and section 4 uses a case study to illustrate the ability of the design to account for large changes in the implementation of the system.
2
Architectural Design
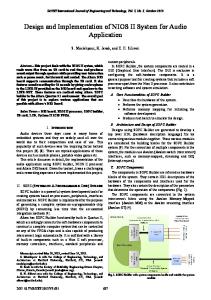
The EASTWeb system was designed to integrate a variety of software tools for acquiring, processing, and managing remote sensing data for spatial modelling and visualization of mosquito-borne disease risk. Figure 1 shows the data flow [6].
EASTWeb System
Water Mask
LP DAAC MCD43B4
Reproject, Mosaic, Create GeoTiff
Compute Vegetation Index Grids
LP DAAC MOD11A2
Reproject, Mosaic, Create GeoTiff
Compute LST Summary Grids
FEWS Net Data Archive
Reproject, Composite, Create GRID
Compute ETf and ETa
GES DISC Daily TRMM
Reproject, Composite, Create GRID
Compute Precipitation Summary Grids
Online Archives
RS Data Processing
Environmental Indices
Zone Shapefile
Surveillance Data
Modelling Model Calibration
Zonal Statistics
PostgreSQL Database
Summarization
Data Storage
Static Maps
Model Predictions
KML/KMZ Files
Visualization
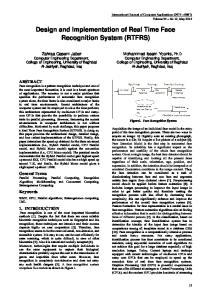
Figure 1. Flowchart outlining the main components of the Epidemiological Applications of Spatial Technologies (EASTWeb) system. We made the following design decisions based on the requirements we collected. These design decisions are the basis of the architectural design. 1. Rapid processing of large datasets The system should be capable of rapidly discovering and processing very large datasets. 2. Maintainable processing modules The processing modules should be easily upgradeable and modifiable. 3. Support for easy addition of environmental indices Additional index calculation modules should be relatively easy to add to the system. In order to address the design decision 1, processing subsystem is designed to discover and process datasets with the help of the scheduling subsystem. A user interface subsystem is designed for handling the user-system interactions. Figure 2 shows the high level architectural design of the EASTWeb system.
Figure 2. The Architecture of EASTWeb
2.1
Processing
The purpose of the processing modules is to provide a set of tools for the scheduling subsystem. The processing modules are designed to be agnostic to the GIS library used to perform the processing. In order to address design decision 2 and 3 the processing subsystem is further decomposed into modules for download, reprojection and conversion, index calculation, zonal statistics calculation, and database upload. The processing modules use files stored in common GIS formats as inputs and outputs, allowing the libraries used to perform processing to be easily changed without affecting other processing modules. Each module provides an abstract interface [1]. An upgrade to any of these modules can be conducted by providing an upgraded implementation to the module’s interface and such upgrade will not affect the other modules.
2.2
Scheduling
The purpose of the scheduling subsystem is to schedule and process data using the processing subsystem. The scheduling subsystem consists of blocking queues containing tasks to perform and worker threads that take tasks from the queues and run the tasks. The tasks use the processing subsystem to process the data.
2.3
Graphical User Interface
The purpose of the graphical user interface subsystem is to facilitate interaction between the user and the scheduling and processing subsystems. The graphical user interface receives information about the status of the processing and the scheduler via the observer pattern.
3
Implementation
The system was implemented in Java, using SWT for the graphical user interface. Initially the processing modules used ArcGIS, a commercial geospatial toolkit, to perform data processing but this was later replaced with an open source geospatial library, GDAL, as described in the case study. PostgreSQL was used to store and retrieve statistical data derived from the processed data. At the core of the implementation is a multi-threaded task scheduler that uses blocking queues and worker threads to process large sets of data efficiently.
3.1
Processing
In the initial implementation, ArcGIS Python scripts were called from the ArcGIS components. Although ArcGIS provided a Java API, the API had no documentation and was functionally useless without an in depth understanding of the inner workings of the ESRI geoprocessor. For this reason, ArcPy, a Python API for the geoprocessor that included extensive documentation was used to implement the ArcGIS components. ArcGIS components would launch a process to run the ArcPy script and report the success or failure of the script.
3.2
Scheduling
The scheduling module was implemented using Java threads and the Java concurrency library. Figure 3 shows the implementation of a worker thread. private final class WorkerRunnable implements Runnable { @Override public void run() { while (true) { final QueueEntry entry; try { entry = mQueue.take(); } catch (InterruptedException e) { e.printStackTrace(); continue; } if (entry.getShouldTerminate()) { System.out.println("Worker thread terminating");
return; } entry.run(); } } }
Figure 3: Implementation of a worker thread.
3.3
Graphical User Interface
The GUI was implemented using SWT, a platform independent open source widget toolkit. Figure 4 and Figure 5 show the scheduler GUI and the project definition GUI.
Figure 4: Scheduler GUI.
Figure 5: Project Creation GUI.
4
Case Study: Replacing ArcGIS with GDAL
Large portions of the EASTWeb system were implemented using ArcGIS, a commonly used commercial GIS application. This decision was originally made to take advantage of the large number of raster-processing functions available in ArcGIS and for compatibility with this wide-used software application. However, the decision to use ArcGIS proved to be a liability. Tasks that relied on modules implemented using ArcGIS suffered from a high error rate, and certain data sets could not be processed by ArcGIS. Additionally, the system’s reliance on ArcGIS required users to own appropriate ArcGIS licenses and potentially reduced system longevity because ArcGIS is frequently updated, increasing the risk that systems that rely on ArcGIS will become outdated. ArcGIS was used to perform TRMM and ETo projection, index calculation, and zonal statistics. Altogether, ArcGIS was present in two thirds of the processing modules.The reliability issues of ArcGIS were not readily apparent for small datasets. However, when processing tens of thousands of tasks, the error rate of the EASTWeb components became a serious issue. To improve the reliability of the EASTWeb system, and enable the system to become open source and not require proprietary components, Geospatial Data Abstraction Library
(GDAL) [3], an open source geospatial library was selected to be used to replace the ArcGIS components. Over the summer of 2012, the ArcGIS components were iteratively replaced. The interfaces allowed the implementation of the modules to easily be swapped out with equivalent GDAL implementations. Figure 3 shows ArcGIS implementation of the NDVI calculation module which calls an ArcPy script to perform the actual processing. Figure 4 shows the GDAL implementation of the module. The implementation of the NDVI module was replaced without requiring extensive changes to external modules. Since files are used as the input and outputs of each module, the implementations of the modules can easily be replaced without requiring changes to other modules. public class NdviCalculator implements IndexCalculator { private File red; private File nir; private File output; public NdviCalculator(File red, File nir, File output) { this.red = red; this.nir = nir; this.outputs = outputs; } @Override public void calculate() throws Exception { Python.run( "python/ndvi.py", Config.getInstance().getIndexPythonTimeout(), red.toString(), nir.toString(), output.toString(), ); } }
Figure 6: ArcGIS implementation of NdviCalculator module. public class NdviCalculator extends SimpleIndexCalculator { private static final int RED = 0; private static final int NIR = 1; public NdviCalculator(File red, File nir, File output) { File[] inputFiles = new File[2]; inputFiles[RED] = red; inputFiles[NIR] = nir; setInputFiles(inputFiles); setOutputFile(output); }
@Override protected double calculatePixelValue(double[] values) { if (values[NIR] == INPUT_NO_DATA || values[RED] == INPUT_NO_DATA) { return OUTPUT_NO_DATA; } else { return (values[NIR] - values[RED]) / (values[RED] + values[NIR]); } } }
Figure 7: GDAL implementation of NdviCalculator module. The transition to GDAL was successful in reducing error rates from 0.3% of all tasks run failing to less than 0.01%. Although the primary reason for replacing ArcGIS was to improve the reliability of the system, the system’s performance was also substantially improved. Replacing ArcGIS with GDAL resulted in an average speed up factor of five for the processing modules that relied on ArcGIS.
5
Conclusion
The EASTWeb system was designed to automate the retrieval, processing, and storage of satellite remote sensing data for public health officials and GIS researchers. Parnas’ information hiding modularization methodology was applied to the design of EASTWeb architecture to enable the flexibility on the changes. The initial implementation of the EASTWeb system suffered from reliability and performance issues related to its reliance on ArcGIS, a commercial geospatial analysis tool. To solve these issues an open source geospatial library, GDAL, was used to replace ArcGIS. Although the initial implementation of the EASTWeb system took eight months for a team of four developers, the design of the EASTWeb system allowed the ArcGIS modules to be successfully replaced within six months by a single developer.
Acknowledgement This work is supported by NIH grant 1R01AI079411-01 “An Integrated System for the Epidemiological Application of Earth Observation Technologies”.
References [1] Britton, K. H., R. A. Parker, and D. L. Parnas. A Procedure for Designing Abstract Interfaces for Device Interface Modules. In Proceedings of the 5th International Conference on Software Engineering, pp. 195-204, March 1981.
[2] Chuang T., and M. C. Wimberly. 2012. Remote Sensing of Climatic Anomalies and West Nile Virus Incidence in the Northern Great Plains of the United States. PLOS One 7:e46882. [3] GDAL - Geospatial Data Abstraction Library. http://www.gdal.org/. last accessed: 3/22/2013. [4] Midekisa, A., G. Senay, G. M. Henebry, P. Semuniguse, and M. C. Wimberly. 2012. Remote sensing-based time series models for malaria early warning in the highlands of Ethiopia. Malaria Journal 11: 165. [5] Parnas, D. L. , On the criteria to be used in decomposing systems into modules. Communications of the ACM, 15(12), 1053-1058. [6] Wimberly, M. C., Ting-Wu Chuang, Geoffrey M. Henebry, Yi Liu, Alemayehu Midekisa, Paulos Semunigse, and Gabriel Senay, A Computer System for Forecasting Malaria Epidemic Risk Using Remotely-Sensed Environmental Data, International Environmental Modelling and Software Society (iEMSs), 2012 International Congress on Environmental Modelling and Software Managing Resources of a Limited Planet, Sixth Biennial Meeting, Leipzig, Germany.