Design and Implementation of an Autonomous Wireless Sensor-based Smart Home Christopher Osiegbu, Seifemichael B. Amsalu, Fatemeh Afghah, Daniel Limbrick and Abdollah Homaifar ECE Dept, North Carolina A&T State University, Greensboro, NC, 27411. {ceosiegb, samsalu}@aggies.ncat.edu, {fafghah, dblimbri, homaifar}@ncat.edu Abstract—The Smart home has gained widespread attention due to its flexible integration into everyday life. This next generation green home system, transparently unifies various home appliances, smart sensors and wireless communication technologies. It can integrate diversified physical sensed information and control various consumer home devices, with the support of active sensor networks having both sensor and actuator components. Although smart homes are gaining popularity due to their energy saving and better living benefits, there is no standardized design for smart homes. In this paper, we put forward a concept by designing and implementing a smart home system which can classify and predict the state of the home based on historical data. We set up a wireless sensor network and collected months of data. By employing supervised machine learning technique, we were able to establish patterns and use the acquired information as a vital cog in our control system algorithm, thereby improving the intelligence of the home. We created a system capable of running with minimal human supervision, an attribute which makes our system an asset for senior care scenarios. Our system also caters to the safety of the home owner. Index Terms—smart home, DigiMesh, supervised machine learning, wireless sensor networks
I.
INTRODUCTION
Mart home is the term commonly used to describe a home with devices that are capable of communicating with each other and can be controlled remotely by the user [1]. The primary objective of a smart home is to enhance comfort, energy saving, and security for the house residents. The smart home is a great asset when it comes to senior care. In 2010 the population of senior citizens (65 and older) globally was 470 million and by 2025, that number is projected to be 820 million [2]. This triggers an effect in all aspects of our society – business, healthcare, policy and technology. As our aging population continues to grow, so does the demand for both inhome care and residential care facilities. This is a niche for the smart home. According to a 2012 survey across the US by Genworth, assisted living, semi-private and private nursing homes cost up to $32,568, $65,160 and $73,800 annually, respectively. The projected rise in the elderly population will lead to greater demand and therefore the cost can only increase. In addition to cost saving, the smart home promotes independent living and social interaction.
The United States department of energy stated that in 2012 the average person spent $3,052 on energy [3]. This cost can be reduced by a smart home equipped with motion, glare and luminosity sensors, constantly providing the actuating system with data leading to situational awareness. The smart home can provide endless security/safety solutions, depending on the requirements of the user. Common solutions tend to emphasize on intruder alert and gas detection. Still, the long term adoption and commercialization of the smart home is hindered by unanswered questions in terms of reliability, implementation cost, standardization and security. Smart homes need to be reliable so as not to fail when users become reliant on its services. In a home that relays real time patient information to a hospital, system failure can lead to misdiagnosis. Standardization of smart homes will lead to reduction in the cost of implementation. Being that data mining is integral to the learning process of smart homes, data security is also very important. Data gathering is the foundation of every smart home’s successful implementation but even with reliable data gathering, how best do we utilize this data? Several machine learning-based algorithms have been recently proposed were residents’ routines were studied and used to predict the future states in smart homes [4-7]. As claimed, the reliability and autonomy of the smart home is improved using these approaches. The current solutions are suited for permanent residents and will be effective after the system has been in place for a period of time. However, they do not cater to commercial buildings with frequently changing residents. Our proposed design models the activities which can occur in a particular space not taking the routine or schedule of a particular user into context. For example, in a bedroom sleeping, reading, grooming, toileting and entertainment are classes which the smart home will recognize as activities in that space. Mapping these activities to an actuating system will produce smart reactions. In this work, a wireless sensor network (WSN)-based smart home was implemented. We installed a WSN in a one bedroom apartment to gather data, considering benefits of WSNs such as, accuracy, scalability, cost and the possibility of upgrading for future applications [8-11]. The gathered data was used to train a classification model that enabled the determination of the real time state of the home, by classifying real time WSN data and serve as
978-1-4799-9964-4/15/$31.00 ©2015 IEEE
input to a prediction model that prompts the retraining of the system, allowing learning of new environment. This prediction feature also promotes the use of our model in commercial applications. II. RELATED WORK In this section, a brief overview of current literature on implementation of smart homes is provided. In [12], the performance of different topologies of WSN network with varying node scales and loads were studied for smart home environment. A small node scale with light loads where acknowledgment (ACK) were disabled, suited the star topology. When the load and nodes were large, mesh topology was more efficient. Byun et al [13] proposed a ZigBee based intelligent selfadjusting sensor (ZiSAS) design, which can autonomously reconfigure middleware, network topology, sensor density and sensing rate based on the environmental situation. In essence, the sensors self-adjustment property saves power as well as bandwidth when the information being sensed is repetitive. Different machine learning algorithms have been utilized in smart home applications, Roy et al [4] utilized information theory and proposed a framework for asymptotic equipartition property to predict routes of inhabitants. Route prediction was utilized to automate device control and proactively reserve resources for example, electrical energy or scarce wireless bandwidth for mobile multimedia applications along the inhabitant’s most probable locations and routes. In [5] two prediction algorithms namely, dynamic Bayesian network-Artificial neural networks (DBN-ANN) and dynamic Bayesian network-Reinforcement learning (DBN-R) based on the deep learning framework were used to predict various activities in a home. Using home activity data-sets, these algorithms were compared to existing methods such as nonlinear SVM and k-means, in terms of prediction accuracy of newly activated sensors. Sequence Prediction via Enhanced Episode Discovery (SPEED), was introduced in [6]. SPEED is a variant of the sequence prediction algorithm. It works with the episodes of smart home events that have been extracted based on the on-off states of home appliances. An episode was defined as a set of sequential user activities that periodically occur in the home. The extracted episodes were processed and arranged in a finite-order Markov model. A method based on prediction by partial matching (PPM) algorithm was applied to predict the next activity from the previous history. Youngblood et al [7] introduced a data-driven approach for building a hierarchical model of inhabitant activities and learning decision policies in smart environments. They designed the ProPHeT decision-learning algorithm that learns a strategy for controlling a smart environment based on sensor observation, power line control and the generated hierarchical model. The performance of the algorithm was evaluated using data collected from a smart home and office environments Most of the related works in this section, studied human behavior in a smart home and used the result to predict activities in the home. The predictions were mostly based on
frequency, hence these models are suitable for permanent residents with strict schedules. However, these models do not present reliable solutions for homes with spontaneous residents or frequently changing occupants such as hotel guests. To that effect, we investigated the smart home learning problem from a different perspective. This perspective is described in detail in section III. III. SYSTEM DESIGN The smart home comes with the promise of better living, security and energy efficiency but due to lack of standardization there is not a global generic design of the smart home. Smart homes setup may be as simple as switching on the lights when a sensor senses presence or as advanced as utilizing user identity, environmental conditions and past preferences, as parameters in making control decisions. A typical smart home architecture is shown in figure 1. The architecture consist of sensors, a communication system, actuators, user interface and a data processing and decision module. In this work, we focused on the sensors, communication system and the data processing and decision module. We designed and implemented a WSN-based smart home, where the collected data was used to classify the state of the home. This model contains two data sources; a historical database and a WSN continuously collecting information in real time as shown in figure 2.
Figure 1. Smart home architecture
In Figure 2, the data from the historical database is used to train classification and prediction models using support vector machine (SVM). SVM is a method used for learning separating functions in pattern recognition tasks. The main idea of SVM is to separate the training data into two classes with a hyper plane that maximizes the margin between them [14-15]. In this system, the real time classified state is always compared to the home’s predicted state. If the two states match, the output is sent to an actuating system. If they do not match the real time state will be sent to the actuating system, terming the differential an anomaly. When the WSN at t =τ continuously produces data-set that cannot be classified by the classification model, the data-set cannot be termed an anomaly hence, it is sent back to the database for retraining of the classification model (the broken lines). For example, if the WSN from a room produces data at 3:15 PM. The context of the data prompts the class "sleeping" and the predicted state is "resident away". The smart home will implement actions
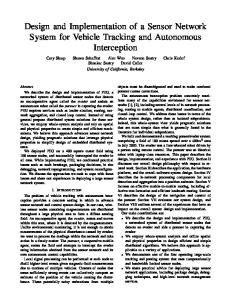
a) Figure 3. A) Waspmote B) Meshlium
b)
Meshlium via the aforementioned protocols. A picture of the Meshlium can be seen in figure 3b. After all the nodes were placed in the apartment, the received signal strength indication (RSSI) was used to ensure a 10 dB margin in every link between the mean RSSI and the receiver sensitivity. This protected the link from unwanted, unpredictable fading effects, interference and moving obstacles.
Figure 2. Smart home system flow chart
for a sleeping resident such as locking the doors and switching off the TV set. However, if a room has been re-purposed and it continuously (days) produces data with high temperatures like that of a steam room. This can no longer be considered an anomaly. Therefore, the data will be sent back to the database for retraining so this occurrence can be classified as one of the states of the home. In subsequent sections we look at the building blocks of our system in detail. IV. TEST BED In this section, we provide a detailed description of the hardware devices and the communication protocol utilized in our WSN-based smart home test-bed. We required sensor nodes and a central sink node. For this, we utilized the Waspmote and Meshlium respectively. These devices were made by Libelium [16]. 1) Waspmote: The Waspmote is furnished with an Xbee radio transceiver, a microprocessor, an electronic circuit and a battery. The Waspmote is a programmable board which when interfaced with a sensor board and sensors can collect data from the environment and either transmit it to a central node or to other Waspmotes. The Waspmote does not have of an operating system. It has a bootloader through which programs are loaded through USB. The programming is done via the Waspmote pro integrated development environment (IDE). Its sensed data can be transmitted using a variety of protocols ZigBee, 802.15.4, DigiMesh, Bluetooth, Wi-Fi and GPRS at frequencies 2.4GHz, 868MHz, 900MHz. The Waspmote is shown in figure 3a. 2) Meshlium: Meshlium is a Linux router which contains 6 different radio interfaces: Wi-Fi 2.4 GHz, WI-Fi 5GHz, 3G/GPRS, Bluetooth and RF (ZigBee, DigiMesh, 802.15.4) communication protocols. The Waspmote equipped with the appropriate transceiver module can communicate with the
3) Wireless sensor network setup: Nodes in WSNs need to be logically arranged so as to bring out the best performance. In our research we required a central node to store all data so the star topology was best suited. However, in larger scale implementations, the tree topology will be better suited because of its scalability and ease in troubleshooting. WSN can communicate using several communication protocols namely, ZigBee, Bluetooth, Wi-Fi, GPRS etc. The selection of a protocol depends on the task to be accomplished. The radio frequency (RF) protocols suited our purpose due to their low data rate and power consumption. In our research we used DigiMesh at 2.4GHz, DigiMesh is a proprietary RF protocol developed by Digi which similar to ZigBee, is built on 802.15.4. DigiMesh offers only one node type therefore there are no parent-child relationships. All nodes can be configured to sleep when there are no events this is ideal for energy conservation. DigiMesh offers different RF data rate options 900 MHz (10, 125, 150 Kbps), 2.4 GHz (250 Kbps). DigiMesh uses one layer of addressing which is the 64bit MAC address. Its simplified addressing method improves network setup and troubleshooting. DigiMesh combats interference by using Direct-Sequence Spread Spectrum (DSSS) at 2.4 GHZ and can send a payload amounting to 256 bytes which yields an improved throughput. To improve the energy efficiency of the sensor nodes in the proposed smart home, sleep timers were embedded into node source codes in order to save energy. The status of the batteries were also sent along with the sensed information in the case of power replenishment. A. Data Gathering In this section we will detail our data collection mechanism. The WSN was installed in a one bedroom apartment shown in Figure 4. The dots in the figure indicate the areas where sensor nodes were placed. The apartment was occupied by a volunteer who lived there full time. The test bed was setup with sensors designed to capture presence, door breach, pressure and environmental conditions such as air composition and light intensity.
utilized in this work. Supervised learning can be applied using machine learning techniques such as Naive Bayes, Decision trees, Support vector machines (SVM), Artificial neural networks and Hidden Markov models [19]. SVM was utilized in this research due to its high performance in many applications such as prediction, handwritten recognition, face detection, text categorization, and speech recognition. A comprehensive survey on the applications of the SVMs in pattern recognition is presented in [18]. In most of these applications SVM outperforms other machine learning techniques in generalizing the pattern recognition problem. We collected approximately eight weeks of data. Our labeling exercise captured seven (7) states in the home. When labeling we considered safety to be integral to our design so the gas levels were taken into consideration when defining every state except arrival and departure. Table 1 describes the states and the parameters which make up the states. 1.
Safe Sleeping (SS): The resident was on the bed sleeping and the gas levels were within acceptable levels.
2.
Safe Away (SA): The resident was away from the home and gas levels were within adequate levels.
3.
Safe Home Activity (SH): The resident was active in the home and the gas levels were adequate.
4.
Alarm (AL): The gas levels exceeded recommended indoor levels but were not up to emergency levels, though further exposure may have been dangerous.
5.
Emergency (EMR): The gas levels have reached emergency levels.
6.
Departure (DP): This state indicated the departure of the resident
7.
Arrival (AR): This state indicated the arrival of the resident.
Figure 4. Floor plan with sensor arrangement
In figure 4, there are 21 sensor nodes and a Meshlium. The one bedroom apartment was equipped with 13 PIR, 1 temperature, 1 luminosity, 1 pressure, 1 of each gas (oxygen, carbon monoxide, carbon dioxide and humidity) and 1 Hall Effect sensor. All nodes transmitting at the same time can present an internal interference problem. Therefore, the radio transceivers were configured using XCTU software to imple¬ment a clear channel assessment protocol. This protocol senses the energy of the channel before it transmits. The amount of time specified to scan each channel affected the detected energy therefore, selecting the minimum energy value was insufficient in detecting channel energy so a higher value was used. Usually, the energy value for a free channel is around -84dBm and -37dBm for an occupied one [17]. We configured the clear channel assessment threshold value for a free channel to be -44dBm. V. SOFTWARE A. Data Classification In this section we will discuss data classification. When faced with a large set of data, patterns in the data need to be recognized in order to classify the data. There are three methods through which this can be done. Supervised, semi supervised and unsupervised. Supervised classification (e.g. discriminant analysis) is a classification method in which the input pattern is identified as a member of a predefined class. Unsupervised classification is a classification method in which the pattern is assigned to a hitherto unknown class [18]. Semisupervised learning (SSL) is halfway between supervised and unsupervised classification, in addition to unlabeled data, the algorithm is provided with some supervision information but not necessarily for all examples. Hence new patterns are discovered. With unsupervised learning it is possible to learn larger and more complex models than with supervised learning. However, unsupervised learning was not suited to our research at this stage because we knew the possible outcomes from the installed sensors, therefore supervised learning was
The rules guiding our labeling can be found in table I. From table I, in order to classify the home state as SH, the O2 level will have to be greater than 20% but less 25%, the CO2 level will have to be equal to or between 0.3% and 0.1%, the CO level will have to be equal to or between 0 and 9ppm, the relative humidity will have to be equal or between 30 and 60% the PIR living room (PIRL) will have to be equal to 1, the luminosity (LUM) will have to be equal to or between 2 and 60 and finally hall effect equal to zero. The other states can be understood by following the explanation of the SH state. TABLE I.
SENSOR DATA LABELING RULES
B. Support Vector Machines SVM are supervised learning models with associated learning algorithms that analyze data and recognize patterns, used for classification and regression analysis. It is unlike classical pattern recognition algorithms that work in an L1 or L2 norm and minimize the absolute value of an error or of an error square, the SVM performs structural risk minimization (SRM) that builds a model with a minimized VC bounds [15]. Since the smart home problem is a multi-class classification problem (Safe Sleeping, Safe Home Activity, Safe Away, Alarm, Emergency, Departing and Arriving), the SVM cannot be applied directly. There are different methods to apply SVM for multi-class classification. The most common ones are one-vs.-one and one-vs.-the-rest [20]. The one-vs.-one method trains a classifier for each possible pair of classes. For M classes, this results in (Μ−1) Μ/2 binary classifiers. When it tries to classify a test pattern, it evaluates all the binary classifiers, and classifies according to which of the classes gets the highest number of votes. The one-vs.-the-rest gets M-class classifiers, it constructs a set of M binary classifiers each trained to separate one class from the rest, and combine them by performing the multi-class classification according to the maximal output. In this work, one-vs-one Multi-class SVM classification method is used to estimate the state of the smart home. Figure 5 shows the pattern recognition algorithm. In Figure 5, the processed features of the sensor data at t=τ are presented to the Multi-class SVM classifier. In the classification stage, the data-set (the data points with their corresponding labels) is divided into 70% training and 30% testing set. The training set is used to build the Multi-class SVM classifier and the testing set is used to calculate the classifier performance C. Prediction The next phase of our research involved prediction of future states in the home. At this stage because the data was already classified, what we were predicting was the next state in the home at a particular time not individual sensor readings. For example a week or three hours from a given time what will be the state of the home? The EMR and AL states were anomalies. We normalized the data by switching those labels to the previous label before their occurrence. For example if the state of the home was SS before AL occurred, we returned the label to SS. SVM was utilized for regression, extracting and labeling sequential home states from the historical data. The time duration of a sequence was varied from weeks to hours, eventually a two and a half hour window was used. The data from the home was pre-processed so each data-set was ten minutes part, therefore a two and a half hour window will consist of fifteen determined states. In order to determine the state at time t = t + τ, the previous 14 states were used. The historical states of the home were converted into time series data, features were extracted every 15 states (2.5 hours) and labeled.
Figure 5. Pattern Recognition Algorithm based on Multi-class SVM [15]
φ(t) = [D (τ−λ), D [τ−λ+λ].........D (τ−λ+λ)] For a given sequence SVM provides a label; L(t) = D (τ+λ). 70% of the data was randomly selected and used to build the multi-class SVM and 30% of the data set was used to test the predictor. The future state of φ(t) was determined using the sequence of past states. For instance, given five home states and a classification model capturing the state of the home every ten minutes, for two and a half hours, the feature vector will be [11122112231444] capturing fifteen states. Using historical sequence of data, what will be the next state if the past states were [11122211223144]? This is the question answered by the SVM prediction model, as it will predict state 4. VI. RESULTS A. Classification The data analysis results for the proposed smart home test-bed is presented in this section. The total data-set contained 8496 data points with corresponding labels. 70% of the data points, that is 5666, were randomly selected from the data-set and used to train the model. The performance of the model was evaluated using 30% of the remaining data-set for testing. The testing result is presented in the confusion matrix (table II), where each column represents the number of instance in a class and each row represents the number of instances in an actual class. The testing phase had an accuracy of 99.72% B. Prediction In the prediction model, One-vs.-one Multi-class SVM is used to predict the states at time = t + τ with the RBF kernel. The confusion matrix on Table III shows the performance of the prediction model which had a 96.25% accuracy when tested with 30% of the data. And also, Figure 6 shows the
actual and predicted classes over 3 days. The Statistics Toolbox of MATLAB was used to implement the Multi-class SVM. TABLE II. THE CONFUSION MATRIX AFTER CLASSIFICATION MODEL WITH 30% OF THE DATA-SET Actual states t =τ SS SA SH DP AR AL EMR
TESTING
THE
Classified states at t = τ SS
SA
SH
DP
AR
AL
EMR
963 0 4 4 0 0 0
0 888 0 0 0 0 0
0 0 932 0 0 0 0
0 0 0 16 0 0 0
0 0 0 0 21 0 0
0 0 0 0 0 1
0 0 0 0 0 0 1
The performance of the model shows that the AR and DP states were not accurately predicted. This was in line with our objective because we wanted the home to predict states within the home. AR and DP are more in line with schedules. Our smart home design predicted domineering activities which happened within the home, hence our systems prediction performance was satisfactory. TABLE III. THE CONFUSION MATRIX AFTER TESTING THE PREDICTION MODEL WITH 30% OF THE DATA-SET Actual state at t=τ SS
945
SA
5
863
1
0
19
SH
22
0
914
0
1
DP
1
0
19
0
0
AR
1
17
1
0
2
SS
Predicted state at f(t) = t + τ SA SH DP AR 1
18
0
0
Figure 6. Actual and predicted classes over 3 days
VII. CONCLUSION In this paper, a system model was designed consisting of a data gathering WSN, a classification and prediction model built with SVM. Using pattern recognition we were able to classify the state of the home achieving an accuracy of
98.6%. Utilizing this information we predicted the state of the home and compared our prediction to real time WSN data with satisfactory results. The proposed model can be utilized in applications with larger number of states, while greater accuracy can be achieved using more sophisticated machine learning methods. This system is capable of being fully autonomous (no human interface), as the historical state of the home can be utilized as a vital cog in the decision making module when future situations arise. Our model provides an advantage over previously designed implementations being that it has a generic design which can be applied to smart homes and commercial buildings such as senior homes, hotels etc. It does not only classify real time data, but also predict the future home state. This can be beneficial in anomaly detection and smart home autonomy. ACKNOWLEDGEMENT The third and last authors would like to acknowledge the support from Air Force Research Laboratory for sponsoring this research under agreement number FA8750-15-2-0116. The U.S. Government is authorized to reproduce and distribute reprints for Governmental purposes notwithstanding any copyright notation thereon. The views and conclusions contained herein are those of the authors and should not be interpreted as necessarily representing the official policies or endorsements, either expressed or implied, of Air Force Research Laboratory, or the U.S. Government. REFERENCES [1]
D. Stefanov, Z. Bien and W.-C. Bang, "The smart house for older persons and persons with physical disabilities: structure, technology arrangements, and perspectives," Neural Systems and Rehabilitation Engineering," Neural Systems and Rehabilitation Engineering, IEEE Transactions, vol. 12, no. 2, pp. 228-250, 2004. [2] J. Hicks, "Forbes," Forbes, [Online]. Available: http://www.forbes.com/sites/jenniferhicks/2013/06/24/robotsand¬smart-homes-for-the-silver-economy/. [Accessed 17 October 2014]. [3] Smart Home automation, "Solution Center," Smart Home, [Online]. Available: http://www.smarthome.com/sc-save-energy-thesmarthome¬way. [Accessed 17 February 2015]. [4] N. Roy, S. Das and K. Basu, "A Predictive Framework for LocationAware Resource Management in Smart Homes," IEEE Transactions on Mobile Computing, vol. 6, no. 11, pp. 1270 -1283, 2007. [5] S. Choi, E. Kim and S. Oh, "Human behavior prediction for smart homes using deep learning," in RO-MAN, Gyeongju, 2013. [6] M. Alam, M. Reaz and M. Ali, "SPEED: An Inhabitant Activity Prediction Algorithm for Smart Homes," Systems, Man and Cybernetics, Part A: Systems and Humans, IEEE Transactions on, vol. 42, no. 4, pp. 985 -990, 2011. [7] G. Youngblood and D. Cook, "Data Mining for Hierarchical Model Creation," Systems, Man, and Cybernetics, Part C: Applications and Reviews, vol. 37, no. 4, pp. 561 -572, 2007. [8] A. Razi, F. Afghah, A. Abedi, "Binary Source Estimation Using a Two-tiered Wireless Sensor Network," IEEE Communication letters, vol. 15, no. 4, pp. 449-451, Apr. 2011. [9] A. Abedi, A. Razi, F. Afghah, "Smart Battery-Free Wireless Sensor Networks for Structural Health Monitoring," International Workshop on Structural Health Monitoring, Stanford University, CA, Sep. 2011. [10] I. Akyildiz and M. Vuran, Wireless sensor networks, West Sussex: John Wiley & Sons Ltd, 2010.
[11] A. Razi, F. Afghah, A. Abedi, "Power Optimized DSTBC Assisted DMF Relaying in Wireless Sensor Networks with Redundant Super nodes", IEEE Transactions on Wireless Communications, vol. 12, no. 2, pp. 635-645, Feb. 2013. [12] C. Zhang and W. Luo, "Topology Performance Analysis of Zigbee Network in the Smart Home Environment," College of Electrical and Information Engineering Guangxi University of Science and technology, Guangxi Zhuang, 2013. [13] J. Byun, J. Boungju, J. Noh, Y. Kim and S. Park, "An Intelligent SelfAdjusting Sensor for Smart Home Services based on ZigBee Communications," Consumer Electronics, IEEE Transactions on, vol. 58, no. 3, pp. 794 -802, 2012. [14] V.Aarohi, C.Paunwala and M.Paunwala "Statistical analysis of various kernel parameters on SVM based multimodal fusion" India Conference (INDICON), Pune, 2014. [15] S. Amsalu, A. Homaifar, F. Afghah, S. Ramyar, and A. Kurt, "Driver Behavior Modeling near Intersections Using Support Vector Machines based on Statistical Feature Extraction," in IEEE Intelligent Vehicles Symposium, 2015. [16] Libelium, "Event sensor board 2.0," Libelium, 2014. [17] Libelium, "Networking guide," Libelium, 2014. [18] S. Lee and A. Verri, "SVM," Springer-Verlag Berlin Heidelberg, vol. Lncs 2388, pp. 213-236, 2002. [19] S. Stenudd, "Using machine learning in the adaptive control of a smart environment," Utigivare, Vuorimiehentie, 2010. [20] A. Jain, R. Duin and J. Mao, "Statistical Pattern Recognition: A Review," IEEE Transactions on Pattern Analysis and Machine Intelligence, vol. 22, no. 1, pp. 4-37, 2000.