Deploying Oracle® Hyperion Smart View for Office, Fusion Edition An Oracle White Paper January 2009
NOTE:
This paper assumes the reader has a basic understanding of Smart View, since this paper focuses new features introduced in release 11.1.1.0.0. Reference to future plan is intended to outline our general product direction. It is intended for information purposes only, and may not be incorporated into any contract. It is not a commitment to deliver any material, code, or functionality, and should not be relied upon in making purchasing decisions. The development, release, and timing of any features or functionality described for Oracle’s products remains at the sole discretion of Oracle.
Deploying Oracle® Hyperion Smart View for Office, Fusion Edition
Page 2
Deploying Oracle® Hyperion Smart View for Office, Fusion Edition
NOTE:................................................................................................................ 2 Introduction ....................................................................................................... 4 Usage Scenarios ................................................................................................. 4 Ad Hoc Analysis ........................................................................................... 4 Predefined Form Interaction ...................................................................... 4 Pre-created Content Access ........................................................................ 5 Reporting........................................................................................................ 5 Platform support ............................................................................................... 5 Architecture........................................................................................................ 5 Data Source Manager........................................................................................ 6 Smart Slice .......................................................................................................... 7 Data Integration & Reporting ......................................................................... 8 Combined Data Display .......................................................................... 8 Report Controls........................................................................................ 9 Cascade ...................................................................................................... 9 Conclusion.......................................................................................................... 9
Deploying Oracle® Hyperion Smart View for Office, Fusion Edition
Page 3
Deploying Oracle® Hyperion Smart View for Office, Fusion Edition
INTRODUCTION Oracle® Hyperion Smart View for Office, Fusion Edition (Smart View) provides a common Microsoft® Office interface for Oracle® Enterprise Performance Management (EPM) suite of products along with Business Intelligence (BI) data sources. Using Smart View, you can view, import, manipulate, distribute and share data in Microsoft® Excel, Word and PowerPoint interfaces. Smart View provides the promise of Office integration today. .
This paper provides an outline of the capabilities of the latest version of Smart View that can be leveraged by organizations when interacting with Oracle Enterprise Performance Management (EPM) as well as Business Intelligence (BI) systems. For the purpose of this document EPM will include BI. Release 11.1.1.0.0 represents a major milestone for the Oracle EPM Suite of products with important new functionality and enhancements to several components. Smart View has accordingly been enhanced with a set of features to provide Office users a rich experience when interacting with EPM and BI data sources. USAGE SCENARIOS
The Office environment is one of the predominant interfaces that power EPM and BI users, whose Smart View use usage can be classified as described below. Ad Hoc Analysis Ad hoc analysis is for users who use Excel to interactively investigate the data contained in the source(s), where they “slice and dice” the data. They may start with templates (such as East->Cola->Sales) or a blank sheet where they begin shaping and altering the grids of data as they work. Typically, users retrieve the data from Oracle EPM sources such as Essbase, Planning, Profitability or Financial Management using mouse clicks or drag and drop. Oracle Business Intelligence Enterprise Edition is also supported as a data source starting with release 11.1.1.0.0 of Smart View. Free form analysis is a variant of ad hoc analysis where users can type in member names from a dimension on a spreadsheet and refresh the data. Predefined Form Interaction EPM application users who execute predefined input or reporting forms find Smart View a convenient way of completing tasks within Office. Such users are planners, consolidators and the like who want to work in Excel for consistent experience compared to the web application or to tie other spreadsheet-based models into their process. For example, a prominent bottling company uses Smart View for Planning to incorporate data that is still housed in spreadsheet and workbook-based models.
Deploying Oracle® Hyperion Smart View for Office, Fusion Edition
Page 4
Pre-created Content Access Another area of use is for importing pre-created content, charts or grids, for example, from Reporting & Analysis products to PowerPoint, Word or Excel. The imported content can be refreshed from the Office environment. Reporting Reporting is another dimension of Smart View usage which leverages the capabilities of EPM and BI data retrievals. Once the data is available within Office, you can create reports as needed based on a combination of data sources. For example, Planning and Financial Management data could be used to compare actual to budget. The ability to compare multiple scenarios, for different periods, etc., enables more complex reports. The power of Office can be used to create Reports in the Office environment, which can be refreshed as needed. PLATFORM SUPPORT
Smart View 11.1.1.0.0 is supported for Office 2003 and 2007, and for Microsoft® Office 2002 on XP.
“When accessing EPM sources, End Users like to see the same type and quality of chart across all Office products.” The new release of Smart View allows users accessing EPM sources from an Office environment to render the same type and quality of charts across Office products -
ARCHITECTURE It is important to understand the architecture in order to effectively deploy Smart View solutions for an enterprise. Smart View is an add-in that allows Microsoft® Office users to access EPM and BI data sources. Smart View accesses EPM data sources, via a middle tier commonly referred to as a provider. There are two categories of providers. 1. Product-based provider: This provider is specific to a given product and is capable of handling interactions with only that product; for example, Financial Management.
Excel, Word or PowerPoint.
2.
Provider Services s: This is a common provider service used to interact with EPM and BI sources. . Provider Services, a middle tire provider, was first released in version 9.3 and combined the abilities of two other middle tier components (Analytic High Availability Services and the Smart View Provider). It requires a web application server (WebLogic, for example) for deployment. Provider Services subsumed all the capabilities of the following: • Analytic High Availability Services •
Smart View Provider
•
XMLA Provider to Oracle Essbase
•
Java API Provider to Oracle Essbase
It provides high-availability, clustering, and load balancing functionality for Java API, Smart View, and XMLA Clients for Essbase.
Deploying Oracle® Hyperion Smart View for Office, Fusion Edition
Page 5
In the future Provider Services will interact with additional EPM products. This will allow a single layer to expose common functionality across the EPM Suite of products.
In the 11.1.1.0.0 release, the scope of Provider Services is expanded to incorporate Smart View client communication functionality for the following: • Planning •
Oracle Business Intelligence Enterprise Edition (Oracle BI EE)
.
A deployment of Smart View could start for one product and then add additional data sources.
.
Provider Services is the enabler for the new features described in the following sections. Products accessed through Provider Services can take advantage of these features. Smart View can accommodate both types of data sources; hence data from Planning and from Financial Management can coexist in the same workbook for example. DATA SOURCE MANAGER Smart View Release 11.1.1.0.0 accommodates products designed to be used with Provider Services as well as products with individual product providers. For the data sources that are accessed via Provider Services, users need to know only one central URL, which is defined centrally by the administrator. This eliminates the need for users to define connections individually. From the administration perspective this is useful as well. If a data source location changes physical location to another server, the administrator has to modify the connection definition only once. This modification is transparent to users.
The connections are organized logically by product areas, and users can pick the connection of their choice easily from a tree control. Smart Slices, discussed in the next section, are associated with a given data source and are available to users. The Data Source Manager can also be used to interact with other EPM sources, opening Planning Forms for example.
Deploying Oracle® Hyperion Smart View for Office, Fusion Edition
Page 6
Starting with 11.1.1.0.0, Smart Slice modeling is available for products interacting using the Provider Services. These are Planning, Essbase and OBI EE. .
.
Some data sources (e.g. Reporting & Analysis) maintain their own native providers. User defined connections for these sources will be honored and continue to coexist with the connections defined centrally and accessed via the Provider Service. Note: In a release beyond 11.1.1.0.0, the goal is to include Financial Management as a data source accessed via Provider Service. Enterprise and Reporting & Analysis however will continue to have individual providers.
Smart Slices are pre-cursors to Query building which are essential for Report Design.
.
SMART SLICE A Smart Slice is a perspective of a data source containing a set of dimension members that can be reused.
As analytic and financial databases grow in size (in respect to both dimensionality and scope of data), it is important to provide users with a better set of tools to focus in on the data and type of analysis they need. In the 11.1.1.0.0 release Smart View provides the ability for admin users to model supported data sources through the Smart Slice modeling interface. This lets admin users determine the specific dimensionality and preferences to make available to end users who desire access to a specific data perspective when working with a data source. Users can pick from a pre-defined list of Smart Slices as a start instead of having to navigate to the data point of interest. Admin users can centrally define data views in the form of Smart Slices that are relevant for large number of users. The Smart Slice modeling interface allows admin users to perform the following actions: • Filter an existing data source to provide more concise, user-friendly access o
•
For example, an admin user could take a 12 dimensional model and anchor 9 of those dimensions at a specific slice in the dimension. The resulting ad-hoc model and experience would be filtered based on those anchored dimensions and only the remaining 3 dimensions will be shown during analysis.
Specify default point of view for data sources
Deploying Oracle® Hyperion Smart View for Office, Fusion Edition
Page 7
•
Specify default alias table and other connection preferences
•
Save grids as reporting objects off of a Smart Slice model for easy drag and drop reuse by end users. The same data is now available across Office Word and PowerPoint.
DATA INTEGRATION & REPORTING
It is important to understand the architecture in order to effectively deploy Smart View. As Office integration continues to evolve what in many cases customers are demanding the ability to create highly formatted, structured reports in Word, or dash-board like content in PowerPoint and Excel. Smart View will provide these capabilities in a Report Designer User Interface (UI), which allows data to be brought in from multiple data sources created as Smart Slices or by use of functions. This UI encompasses three phases: 1. Report layout 2. Query design 3. Formatting output Cascade allows data to be displayed for a particular member from a chosen dimension on a single Worksheet. The cascade operation can be invoked for both ad hoc operations as well as for formatted reports.
The Report Designer provides the following abilities: • Multi-source reporting • Report cascade • Charts and other controls Combined Data Display
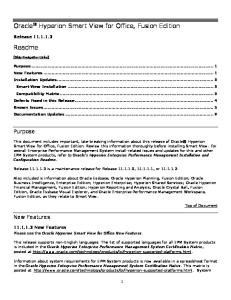
With Smart Slice capabilities Smart View provides users the ability to display multidata source on a single grid. For example, take the following grid: .
The top portion of this grid is Essbase data; the bottom portion of the grid is Planning data. The final output of the Report Designer is not limited to two sections. The output can encapsulate multiple query sections as well as chart output (chart types supported by Microsoft® Office Web Components). Shown below is another example of combining data from multiple EPM sources.
Deploying Oracle® Hyperion Smart View for Office, Fusion Edition
Page 8
Independent query sections
Report Designers can choose to use one or more of the controls to be displayed on a Report or Dashboard.
Report Controls
In order to better support the reporting needs, the Smart View Report Designer leverages Microsoft® Office Web Components to provide the user with a set of objects for use in the report layout. Slider controls can be used for controlling multiple charts and tables from the same data source. Shown below are two outputs created using Smart View in Excel and PowerPoint.
Reporting controls that are available with Release 11.1.1.0.0 include Tables, Charts, Function Grids and Sliders.
.
Note: The charts rendered across the Office suite have the similar look and feel. Cascade
In addition to other capabilities, the Report Designer provides cascaded output of reports in Excel. This will enable end users to create a report in Excel and cascade it to separate sheets based on members of a dimension not included as part of the report. CONCLUSION
Historically speaking, many Excel-based add-ins were available to access EPM Suite of products. Smart View provides a convergence of these technologies into a single client with which Office users can leverage EPM data.
Deploying Oracle® Hyperion Smart View for Office, Fusion Edition
Page 9
Smart View allows for application access (HFM, Planning for example), ad hoc analysis queries (Oracle® Business Intelligence Enterprise Edition, Essbase, Planning, etc.) and existing Reporting & Analysis content import. Smart View is not just an Excel add-in; instead it is an Office add-in with functionality in: •
Excel
•
Word
•
PowerPoint
•
Outlook (if Word is your e-mail editor)
The ability to copy and paste data points across Microsoft® Office (Excel, Word, PowerPoint) provides an easy mechanism for moving relevant data points from one application to another. Smart View makes EPM and BI data (Oracle® Business Intelligence Enterprise Edition) available via Microsoft® Office in a useful manner. Providing information within the productivity applications where users spend most of the day allows everyone in an enterprise to do their jobs better.
Deploying Oracle® Hyperion Smart View for Office, Fusion Edition
Page 10
Oracle Hyperion Smart View for Office Fusion Edition January 2009 Author: Shubhomoy Bhattacharya Oracle Corporation World Headquarters 500 Oracle Parkway Redwood Shores, CA 94065 U.S.A. Worldwide Inquiries: Phone: +1.650.506.7000 Fax: +1.650.506.7200 oracle.com Copyright © 2009, Oracle and/or its affiliates. All rights reserved. This document is provided for information purposes only and the contents hereof are subject to change without notice. This document is not warranted to be error-free, nor subject to any other warranties or conditions, whether expressed orally or implied in law, including implied warranties and conditions of merchantability or fitness for a particular purpose. We specifically disclaim any liability with respect to this document and no contractual obligations are formed either directly or indirectly by this document. This document may not be reproduced or transmitted in any form or by any means, electronic or mechanical, for any purpose, without our prior written permission. Oracle is a registered trademark of Oracle Corporation and/or its affiliates. Other names may be trademarks of their respective owners. 0408