International Journal of Applied Environmental Sciences ISSN 0973-6077 Volume 11, Number 1 (2016), pp. 325-349 © Research India Publications http://www.ripublication.com
De-carbonizing the Nigerian Housing Sector: The Role of Life Cycle CO2 Assessment I. C. Ezema, A. P. Opoko and A. A. Oluwatayo Department of Architecture, Covenant University, Ota, Nigeria
ABSTRACT Carbon in the form of carbon dioxide (CO2) is the most important chemical compound in the climate change process as it is the main causative agent of global warming and climate change. International efforts aimed at arresting climate change are all directed at carbon elimination or reduction. Buildings especially residential buildings have been found to contribute substantially to climate change through the carbon emitted to the environment in the process of building procurement and use. This paper aims at tracking the CO2 content of the various activities and processes involved in building procurement and use in a Nigerian context with a view to indentifying the target areas for decarbonization. This is done by applying the life cycle CO2 assessment (LCCO2 A) approach to a typical urban residential apartment building in Lagos, Nigeria’s most populous and urbanized city. In this respect, the ICE database and the activity based method were used to estimate the embodied and operational CO2 emissions associated with the case building. The study found that the embodied and operational emissions were significant when compared with baseline scenarios in other countries. Hence the paper concluded that de-carbonization strategies should be targeted at both the embodied and operational carbon emissions of buildings. The best result will be achieved if the de-carbonization efforts are combined with natural and active carbon sinks that exist in the study context. Keywords: CO2 emissions, de-carbonization, Lagos-Nigeria, life cycle assessment, residential buildings.
INTRODUCTION The period between 2015 and 2050 may be termed a period of transition to zero carbon emissions for buildings and the built environment following the consensus reached by countries that attended COP 21 (UN Climate Change Conference) in Paris,
326
I. C. Ezema, A. P. Opoko and A. A. Oluwatayo
France in 2015. The importance of buildings in climate change mitigation efforts was underscored by dedicating a day as a special day for buildings at the conference. Incidentally, in 2014 at the International Union of Architects (IUA) Conference in Durban, South Africa, the architecture profession under the aegis of the IUA collectively adopted 2050 as target year to achieve zero carbon emissions from buildings. The IUA resolution was preceded by the pioneering efforts of a nongovernmental and no-profit organization, “Architecture 2030 Challenge” which was founded in 2002 to elicit action towards achieving sustainable and zero-carbon buildings. Carbon dioxide, the most important greenhouse gas (GHG), is the main substance responsible for global warming and hence climate change. Climate change mitigation strategy in residential buildings is aimed at elimination or reduction of carbon emissions. Carbon emissions in buildings are mainly dependent on the type and quantity of energy consumed by buildings in the process of their construction and use. Buildings in general and residential buildings in particular account for a large proportion of both energy use and carbon emissions to the environment through building operation and procurement. It has been estimated that about 40% of global energy use, 60% of global electricity use and 30% of global GHG emissions are linked to buildings (Gupta, 2014). In real terms, buildings contribute about 8.1Gt of carbon dioxide to the environment annually (Jennings et al., 2011). In the European Union (EU), for example, buildings account for about 50% of all extracted material resources (European Commission, 2014). It has also been estimated that improved procedures and processes in the building sector can achieve up to 50% reduction in the use of extracted materials, 42% reduction in energy use and 35% reduction in GHG emissions (Herczeg et al., 2014). Some examples across the globe will help to situate the energy consumption and GHG emissions scenario of buildings. In 2013, emissions from UK buildings were 37% of total UK greenhouse gas emissions and 65% of total building emissions were traced to residential buildings where direct (Scope 1) and indirect (Scope 2) emissions were almost at par (CCC, 2014). Similarly in the USA, it was estimated that buildings accounted for about 40% of total CO2 emissions in 2010 (USDOE, 2012). In Australia, the most carbon intense OECD country, building-related energy consumption accounted for about 24% of total GHG emissions (DCCEE, 2009). The scenario is not different in emerging economies. In South Africa, operation of nonresidential and residential buildings account for about 23% (10% non-residential and 13% residential) of total GHG emissions and given the growth trend of new buildings, if prevalent practices are maintained, the emissions level may double by 2050 (UNEP SBCI, 2009a). In Brazil, residential emissions accounted for 69% while commercial and public buildings accounted for 19% and 12% respectively of all building related CO2 emissions (Melo, et al., 2013). Similarly, in India, residential and commercial buildings accounted for about 7% of total GHG emissions (INCCA, 2010). Incidentally, buildings are also believed to offer the best opportunity for significant and cost-effective GHG emissions reduction (UNEP SBCI, 2009b). As a result, carbon mitigation targets for buildings have been established in many geographical jurisdictions. While for developed countries, the target of mitigation is the existing
De-carbonizing the Nigerian Housing Sector
327
building stock, new buildings are more important in rapidly growing countries (Jennings et al., 2011). Nigeria’s GHG emissions data indicate that agriculture, land use change and forestry as well as fugitive emissions account for the bulk of carbon emissions to the environment (Dayo et al., 2009; WRI, 2011). The relatively high level of fugitive emissions is attributed to the oil and gas industry (Anastassia et al., 2009). In relative terms, Nigeria’s contribution to global GHG emissions is low when compared with that of industrialized countries. However, when emissions are measured per unit of gross domestic product (GDP), it stands at about twice the world average (Cervigni et al., 2013). Hence, if the carbon intensity of the Nigerian economy remains at the latest measured levels, carbon emissions will grow astronomically when GDP increases in line with the growth projections of the economy. Hence, in the Intended Nationally Determined Contribution submitted to COP 21, an unconditional commitment to reduce carbon emissions by 20% in 2030 was made with the option of achieving 45% reduction if external support is received (FGN, 2015). In addition, the building and construction sector in Nigeria is very active. With population growth expected to be in the range of 2. 5%, about 1.5million new homes would be required annually between 2012 and 2025 (Hogarth et al, 2015). Already, due to inability to address housing demands promptly, housing deficit has accumulated and in the region of about 17.5million (Okonjo-Iweala, 2014). Bridging the deficit will involve increased carbon emissions. If 1.5 million new housing units are added annually for ten years, it will amount to 15 million new housing units by the year 2025. It is therefore important to understand the carbon emissions profile of existing buildings as a prelude to the adoption of mitigation targets bearing in mind the future housing scenario in the reference year 2030. Hence baseline CO2 emissions scenarios in buildings need to be established in order to place the Nigerian perspective in the context of other studies as well as to facilitate benchmarking and subsequently carbon mitigation targets. Hence, this study focuses on carbon emissions from the perspective of building procurement (embodied emissions) and operation (operational emissions). In this respect, a typical urban residential typology from the stable of public housing in Lagos, Nigeria’s most populous urban area is used as case for indepth study. The life cycle CO2 assessment framework was adopted for the study with the ICE database and activity based method as the main methods.
LITERATURE REVIEW Carbon emissions reduction is at the centre of climate change mitigation efforts. A study of the trends in CO2 emissions between 2010 and 2015 indicate a general tendency towards declining growth rate with 2014 recording the lowest growth rate since 1998 (Olivier et al., 2015). In absolute terms, total emissions stood at 35.7 billion tonnes at the end of 2014 as against 34 billion tonnes in 2011 with the largest emitters being China, USA, India, the Russian Federation and the EU countries (Olivier et al., 2015). Altogether, the four countries and the EU account for about twothirds of total CO2 emissions. However, in per capita terms according to 2011 figures, the largest emitters are Australia, USA, Saudi Arabia, Canada and the Russian
328
I. C. Ezema, A. P. Opoko and A. A. Oluwatayo
Federation (Olivier et al., 2012). Similarly, emissions per unit of GDP in 2011 indicated that the highest emitters were Ukraine, China, Russian Federation, Saudi Arabia and South Africa (Olivier et al., 2012). Also, while emissions in industrialized countries especially OECD countries are on the decline, it is on the increase in China, India and other economically emerging countries, a phenomenon that is associated with increasing per capita income (Yeo et al., 2015). At national levels, mitigation efforts tend to be multi-layered with most efforts concentrated on critical sectors. The critical sectors could vary from one country to another but they generally include energy generation, manufacturing, transportation, building and construction as well as land use changes, agriculture and fugitive emissions. The focus of carbon emissions mitigation in the present paper is the building sector. Carbon Emissions, Measurement and Mitigation Carbon emissions from buildings according to UNEP SBCI (2010) are classified into three. Scope 1 emissions are direct emissions that result from buildings and they include stationery combustion emissions resulting from burning of fuels to produce electricity or heat. This category of emissions is from owned and controlled sources. Scope 2 emissions are indirect emissions resulting from the generation of purchased electricity used in the buildings. Scope 2 emissions are not owned and cannot be controlled at the building level. Scope 3 emissions refer to upstream and downstream emissions related to pre-use and after-use phases of buildings including emissions associated with building materials and building-related transportation (WBCSD, 2004). Scope 3 emissions are all indirect emissions not included in Scope 2 that occur in the value chain of buildings. Typically they relate substantially to the embodied phase of buildings while Scope 1 and Scope 2 emissions relate to the operational phase of buildings. Scope 1 emissions associated with direct fuel combustion can be measured by using the activity based method which estimates the direct fuel used and multiplies same by emission factors of the particular fuel. Custom fuel emission factors estimated on a country-by-country basis are recommended by the IPCC (2006) but where custom values are not available, the IPCC default values are used. For indirect (Scope 2) emissions associated with purchased electricity which is dependent on the electricity mix, electricity specific emission factors are applied to the delivered electricity consumed. Custom emission factor exist for some countries but many other countries rely on IEA data. An approach relevant to the study area recommends the use of electricity-specific emission factors as developed by Brander et al. (2011) based on IEA data. Scope 3 emissions are associated with building procurement and associated processes including transportation, which in the context of this paper constitute the embodied carbon content. In this respect the life cycle CO2 assessment approach using ICE carbon emissions coefficients for building materials are deployed while activity based method is used for direct and indirect fuel use linked to building materials and construction methods. In general, carbon emissions mitigation strategies address both the demand and supply sides. At the micro, building level, opportunities exist for demand related reduction in carbon emissions through building design, materials specification, building
De-carbonizing the Nigerian Housing Sector
329
construction and low carbon building use. Greater opportunities for carbon mitigation are found in the electricity generation and distribution sector (Shukla et al, 2015) as well as in manufacturing, especially of building materials (Hogarth et al, 2015), transportation of same and in land use practices. With respect to buildings, the carbon reduction strategies target emissions from building materials and construction methods and emissions from building operation (Hogarth et al., 2015). Specifically, low carbon strategies in building and construction will focus on less use of carbon intensive building materials and reduced operational energy consumption in buildings through energy efficient design strategies, use of energy efficient appliances and resort to renewable energy especially solar energy (Hogarth et al, 2015). Hence carbon emission along the whole value chain of a building is important in order to identify target areas for mitigation. This can be achieved using the life cycle assessment framework Life Cycle Carbon Emission Studies Emissions from buildings emanate from building procurement as well as from household energy use for cooking, lighting, cooling and/or heating and for other household energy-consuming appliances. Households are believed to play an important role in climate change mitigation efforts as they emit GHGs through household activities (Adeoti and Osho, 2012). In this respect, the whole value chain of the building from procurement to deconstruction is considered. A number of empirical studies on carbon emissions emanating from energy consumption and resource use at building level exist in literature. The methodological framework is usually the life cycle assessment (LCA) approach as outlined by ISO (2006) and its simplified variants LCEA referred to as the streamlined life cycle energy assessment (Graedel et al., 2005) and LCCO2A also known as life cycle CO2 assessment (Atmaca and Atmaca, 2015). One of the earliest empirical works in this regard was carried out in Sweden by Adalberth (1997) and it concentrated on energy use during a building life cycle not just energy use in building operation. Even though carbon emissions were not specifically considered, the energy profile of the studied building gave an indication of the carbon emissions given the relationship between energy use and carbon emissions in buildings. A plethora of other studies had followed but those considered here were studies carried out in various geographical contexts and published between 2010 and 2015. Atmaca and Atmaca (2015) studied two typical residential building types in the Gaziantep region of Turkey using a life span of 50 years. One of the buildings is a high rise (13 floors) apartment block while the other is a low rise residential block on three floors. Both buildings were constructed with reinforced concrete but the concrete strength of the high rise is higher than that of the low rise. The study found that for the high rise block, total carbon emissions intensity was 5222kgCO2/m2 which was further disaggregated to operational carbon intensity of 4485kgCO2/m2 and construction (embodied) phase intensity of 737kgCO2/m2. Also, for the low rise building, total carbon intensity was estimated at 6485kgCO2/m2 made up of 6032kgCO2/m2 for operational intensity and 453kgCO2/m2 for the embodied phase.
330
I. C. Ezema, A. P. Opoko and A. A. Oluwatayo
Steel and concrete dominate the embodied carbon content of the buildings while the use of coal and natural gas for heating the buildings dominate the operational impact. However, it can be observed that the low rise building was more carbon intense than the high rise building due the use of coal for heating the low rise building as against the use of natural gas in the high rise building. In a study conducted in China, Li et al (2013) estimated residential building life cycle carbon emission to be 1807.31 tonnes. Hence, carbon intensity based on a building area of 1460m2 was calculated to be 1238kgCO2/m2 by present study. Further disaggregation showed that operational carbon emissions amounted to 1193.47 tonnes (66%) while embodied carbon emission stood at about 613. 84kgCO2/m2 (34%). The embodied carbon emissions were dominated by construction materials such as cement, steel reinforcement, concrete and bricks. A closer examination of the embodied carbon impact shows that materials contributed 84. 5% while transportation, site construction and end-of-life phase jointly contributed 15.5%. Also, operational emission of 1193.47 tonnes could be further disaggregated into electricity emissions of 452.37 tonnes (37.9%) and natural gas consumption emission of 741.10 tonnes (62. 1%). In an earlier comparative study in China, the carbon emissions intensity of masonry-concrete and steel-concrete structures were found to be 3296kg/m2 and 3158kg/m2 (You et al., 2011). Also, 85-90% of the intensity was due the operational phase while 7-11% was ascribed to materials and 3% due to construction processes. Embodied carbon was the subject of study in a Bangladesh example (Alam and Ahmad, 2013). Two residential buildings, one constructed in stone and the other in bricks were studied. It was found that the carbon emissions intensity of the stone building at the materials and construction phase was 498. 9 tonnes while the brick building emitted 639.59 tonnes for building area of about 502m2. Hence the carbon intensity of materials and construction phase is in the region of 994kg/m2 for the stone building and 1274kg/m2 for brick building. An Egyptian study also compared the embodied carbon intensity of vernacular and modern buildings and concluded that vernacular buildings through the use of materials sourced from the building context, can achieve up to 60% reduction in embodied carbon emissions in relation to modern buildings (Ali et al., 2013). An Indonesian study with Bandung as context used the hybrid analysis to estimate life cycle energy and CO2 emissions of residential buildings (Surahman and Kubota, 2013). The study found that life cycle CO2 emissions follow the trend of life cycle energy as operational emissions dominate embodied emissions by up to 6 to 9 times. Specifically total life cycle carbon emissions were estimated to be 32.8tCO2e, 91.6tCO2e and 282.6tCO2e for simple, medium and luxury houses respectively with embodied carbon constituting 10-14% while operational carbon constituted 86-90% of total life cycle carbon emissions. Given an average floor area of 57m2, 127m2 and 300m2 for the simple, medium and luxury buildings, the carbon emissions intensities can be estimated to be 575kgCO2e/m2, 721kgCO2e/m2 and 942kgCO2e/m2 respectively. Life cycle energy assessment studies of Indian buildings exist in literature and generally indicate that carbon emissions follow the trend of energy consumption. Jain
De-carbonizing the Nigerian Housing Sector
331
and Salgue (2010) indicated that use of certain building envelope materials can affect not only the embodied energy but also contribute to increased operational energy. Even though African countries may be regarded as late comers to carbon emissions studies, African examples of life cycle carbon assessment are on the increase. Abanda et al (2014) investigated cradle-to-gate embodied energy and CO2 emissions in mudbrick and cement-block houses in Cameroun using ICE database and found the CO2 intensities to be 228kgCO2/m2 and 397kgCO2/m2 respectively. Similarly, Dumani and Ampofo-Anti (2015) evaluated cradle-to-gate energy and GHG emissions of concrete and steel re-bars which are two main building materials in South Africa. The study used European life cycle inventory data adapted to South African energy scenario and found that concrete especially the cement content and steel re-bars contributed substantially to GHG emissions. Also Mpakati-Gama et al (2015) used process data to estimate the embodied energy and carbon profile of urban housing in Malawi and associated a substantial part of the carbon intensity to cement use and inefficient brick firing processes. However, the African studies appear to concentrate on embodied emissions. Given the dominance of operational impact is similar studies, there is the need to extend the study to cover the whole value chain of residential buildings and this was done using the Nigerian context.
THE STUDY CONTEXT The study area is Lagos, the most urbanized city in Nigeria and one of the fastest growing mega cities in the world. Lagos accounts for about 70 per cent of industrial investments, 90 per cent of foreign trade flows, 50 per cent of port revenue, 60 per cent of energy consumption and over 30 per cent of Nigeria’s gross domestic product (GDP) (LASG, 2012). Lagos, a coastal city covers a gross area of about 3, 577 km2, a sizeable proportion of which is made up of wetlands, thus making it the smallest in terms of land area of all the states in the Federal Republic of Nigeria (Jeje, 2013). The official 2006 population census in Nigerian put the population of Lagos at just over 8 million people and UN Habitat has projected a population of over 15 million by 2025 (UN Habitat, 2008). However, more recent projections for the population of Lagos put it at over 23 million by the end of 2015 (Lagos Bureau of Statistics, 2013). The real estate sector in Lagos is very vibrant given the city’s economic status, population and rate of urbanisation. In response to the housing need, there is a strong social housing content represented by Federal and State government housing provision agencies. At the State level, the Lagos State Development and Property Corporation (LSDPC) established under Edict No. 1 1972 to provide affordable housing to low and medium income earners stands out. However, the real estate sector is dominated by private sector most of whom are small players. Public housing managed on behalf of the state government by the LSDPC was selected for the study as it represented the most dominant in the study area. The Nigerian Housing Sector The Nigerian housing sector is bedeviled by a myriad of challenges which are compounded by the rapid rate of urbanization. In order to address the challenges,
332
I. C. Ezema, A. P. Opoko and A. A. Oluwatayo
there have been multi-layered approaches encompassing government at national and state levels, corporate organisations and individuals. From the era of direct government provision of housing to the era of public-private partnership, housing policy in Nigeria has come a long way. Notwithstanding, Nigeria’s housing shortfall is estimated to be about 17million housing units and bridging the deficit would require not only huge funds but also enormous material and energy resources. Many studies on the Nigerian housing situation has tended to focus on strategies for housing provision, availability, affordability, characteristics and performance using different performance indicators as well as housing satisfaction. The aspects of housing research that has direct bearing on the present study include building performance evaluation, building materials utilisation and energy performance of buildings. In the area of building performance evaluation, Ilesanmi (2010), Jiboye (2010) as well as Ibem et al. (2013) employed user satisfaction surveys to evaluate building performance of public housing. Ilesanmi (2012) used expert evaluation of the physical characteristics and arrived at the conclusion that majority of the housing units surveyed were of poor quality both at the micro and macro levels. Furthermore, in the area of building materials utilisation, the use of alternative materials especially the need for local building materials has dominated research efforts because of their easy availability as well as low cost and eco-friendliness (Adedeji, 2011; Arayela and Taiwo, 2010). In addition, energy performance of buildings in terms of indoor thermal performance informed the works of Adunola and Ajibola (2012) as well as the work of Olaniyan (2012). Similarly, operational energy of buildings is central in the works of Ogbonna et al. (2008) as well as the work of Irimiya et al. (2013). In the area of life cycle environmental impact of buildings and building materials, Ede et al. (2014) carried out a comparative environmental impact of concrete and steel using the Athena Impact Estimator and concluded that timber structures are more eco-friendly than concrete structures. However, the assessment was limited to the building components level as the Athena Impact Estimator does not include operational energy simulation. In terms of innovation in the procurement process of housing, the literature shows that conventional methods and processes dominate in spite of increasing opportunities for innovations towards sustainability in the building procurement process. From the foregoing, it is evident that previous studies have made only tangential reference to environmental sustainability as a whole and building LCEA in particular. Against the background that the housing sector globally and in Nigeria consumes huge resources in the form of energy and materials and also emits harmful substances to the environment, the next section deals with energy, emissions and the Nigerian environment. Energy and Carbon Emissions in Nigeria Nigeria has a rich reservoir of renewable and non-renewable energy resources even though the energy sector remains largely under-developed to the disadvantage of economic development. For example, Nigeria has the sixth largest crude oil reserve, over 5, 000 billion cubic metres of natural gas, over 14, 000MW hydropower capacity as well as high solar radiation. Ironically, the per capita electricity consumption of
De-carbonizing the Nigerian Housing Sector
333
100kWh is very low and cannot engender genuine development (Federal Ministry of Power and Steel, 2006). Total installed capacity for grid electricity was estimated at 10, 396MW out of which 6, 056MW was available as at 2013 with the mix tilted to thermal electricity (81per cent) while the rest is attributed to hydropower sources (KPMG, 2013). The available capacity has further dwindled due to poor governance mechanism in the energy sector which resulted in obsolescence and poor maintenance of energy installations. As a result, grid electricity is available only to about half of the Nigerian population and actual generation and distribution are further limited by inadequate and inefficient infrastructure (Eleri et al., 2012; Sambo et al., 2012). Lagos, the study area, due to its cosmopolitan nature has the best access rate to grid electricity in Nigeria as national statistics show that as at 2009, only about 6% of households did not have access to grid electricity in the study area (NBS, 2010). However, supply of grid electricity is characterised by frequent outages with the consequent economic losses. There is therefore recourse to alternative electricity through the use of fossil fuel powered private electricity generators. Otegbulu (2011) and Mbamali et al. (2012) in separate studies in Lagos, Southwest Nigeria and Kaduna, Northern Nigeria respectively found high rate of electricity generator ownership and use. High rate of CO2 emissions has also been associated with the use of private electricity generators with emissions from generators considered to be higher than emissions associated with grid electricity supply (Ogunleye, 2013). In addition to attendant pollution from the generators, a sizeable percentage of household income is spent on fuelling the generators. Nigeria’s energy outlook can be better understood within the context of the country’s development agenda. The current national development plan came into effect in 2010 and it is a ten year plan culminating in 2020 and christened Vision 20: 2020. Vision 20:2020 articulates Nigeria’s economic development agenda for the period in question and it aims at making Nigeria one of the top twenty economies in the world by the year 2020. The rapid economic development envisaged by Vision 20:2020 will entail rapid infrastructural expansion in the areas of power, transport, oil and gas, housing and water resources with the attendant energy and emissions implications. At the international policy level, Nigeria is a signatory to the United Nations Framework Convention on Climate Change (UNFCCC) and the Kyoto Protocol on reduction of GHG emissions. However, given the limited progress achieved in the energy sector, institutional arrangements for effective implementation of low carbon development and clean development mechanism are considered weak (Eleri et al., 2013). From the foregoing, it can be inferred that the Nigerian energy sector is characterised by low and inefficient supply situation despite the abundant resources available. The carbon intensity of usable energy in Nigeria is also high relative to the GDP. If current energy and carbon intensities are maintained in a scenario of rapidly increasing GDP, the overall environmental impact of energy consumption and associated GHG emissions would be adverse. This is particularly true in the built environment which is expanding through continuous urbanisation and associated infrastructural development..
334
I. C. Ezema, A. P. Opoko and A. A. Oluwatayo
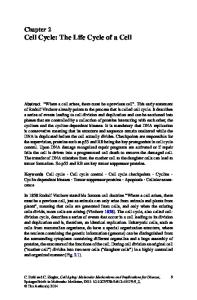
METHODOLOGY Research Design Survey research design was used together with the LCA framework for the study. The research population was the public housing units established by Lagos State Development and Property Corporation (LSDPC) between 1981 and 2005 for low and medium income earners located in medium-rise multi-family residential blocks in residential estates. At the time of the study, there were 31 such estates from where a sample of nine estates was taken randomly. The nine estates comprised 10, 182 housing units which constituted the study population. Taking each estate as a stratum of the population, a sample size of 1, 075 housing units was drawn systematically and used for questionnaire administration for the study. Altogether, 775 validly completed questionnaires were retrieved and used for the analysis. The questionnaire elicited data on general characteristics of the housing units as well as on ownership and use of energy consuming appliances and actual energy consumption. However, buildingspecific inventory data for embodied carbon estimation such as types and quantities of building materials and components as well as construction processes and inputs employed were obtained through observation, interviews and from secondary sources. The building-specific data were obtained by selecting a case from the array of residential typologies identified in the study. The buildings studied were prototypes and a case typical of the predominant typology was selected for embodied energy analysis. Consequently, a block of six apartments on three floors with gross floor area of 720m2 was selected and further described in Section 4.2 below. Description of Case Building The prototype used for the study was completed within the LSDPC Estate, Isolo in 2013 by a joint venture partner to LSDPC. As conceived and built, the prototype is as shown in typical floor plan (Figure 1) and further described in Table 1. The total gross floor area of the whole residential block is approximately 720m2. Also, the average headroom is 2. 85m. The structural system used was a reinforced concrete frame made up of reinforced concrete pad foundation, reinforced concrete columns, floor beams, slabs, staircases and roof beams. The external envelope material and the internal partition material were sand-cement blocks rendered on both faces with sandcement mortar. The roof structure was treated hardwood timber while the roof covering was long span aluminium roofing sheets. The ceiling material was PVC tongue-and-groove ceiling tiles on treated hardwood timber noggins. The entrance doors were locally fabricated steel doors while the internal doors were hardwood panel doors. The windows were made of extruded aluminium profiles and glass panels. The kitchen and toilet walls as well as all floors were finished with ceramic wall and floor tiles. All windows were fitted with steel anti-burglary bars. The sanitary fittings were of ceramic material except in the kitchen where stainless fittings were used. The pipes for the sanitary fittings were made of PVC materials. The wardrobes were made of plywood with hardwood framing. The electrical wires were insulated copper wires.
De-carbonizing the Nigerian Housing Sector
335
Figure 1: Typical Floor Plan of Building
Table 1: Checklist of Building Materials and Components Building Stage Substructure
Frame, Floors and Walls
Roof Structure and Covering
Component Material Pad Foundation Reinforced concrete Strip Foundation Concrete Wall in 225mm hollow sand-cement Foundation blocks filled with light concrete Filling to level Lateritic soil Hardcore Broken Concrete/Stone Ground floor Slab Concrete with BRC mesh Columns Reinforced Concrete Beams Reinforced Concrete Suspended Slabs Reinforced concrete Staircases Reinforced Concrete External walls 225mm hollow blocks Main Internal 225mm hollow blocks walls Partition walls 150mm hollow blocks Wall plate 75 x 100mm Hardwood Tie Beam 50 x 150mm ,, Rafters/struts 50 x 100mm ,, Purlins 50 x 75mm ,, Noggins 50 x 50 mm ,, Fascia Board 25 x 250mm ,, Roof Covering Long span aluminium sheets
336 Finishes
I. C. Ezema, A. P. Opoko and A. A. Oluwatayo Ceiling PVC Tiles Internal walls Rendering / Emulsion paint External walls Rendering /Emulsion paint Slabs Soffits Rendering/ Emulsion paint Internal Walls of Glazed ceramic tiles wet areas Floor Finishes Vitrified ceramic tiles
Doors/Windows/Fixtures/Fittings External Doors Internal Doors Windows Anti-burglary Bars
Locally Steel Doors Hardwood Panel doors Aluminium/glass casement 20x20mm hollow steel pipe
The results obtained from the survey and inventory stages were used in conjunction with the Inventory of Carbon and Energy (ICE) database and the activity based method to estimate the embodied and operational carbon emissions of the case building. The quantities of materials obtained from a standard bill of quantities were denominated in units of measure compatible with the ICE inventory. The quantities were also arranged according to construction milestones namely: substructure, frame and walls, suspended floors and staircases, roof structure and covering, finishes, fixtures and fittings as well as building services in order to indicate the relative carbon emissions of each milestone. The CO2 emissions traceable to the embodied phase of the buildings were calculated by applying the CO2 emission factor. This was achieved by using the embodied carbon emission coefficients of the Inventory of Carbon and Energy of the University of Bath as developed by Hammond and Jones (2008). However, the ICE carbon emissions coefficients cover cradle-to-gate emissions only. Emissions associated with materials transportation and mobile equipments were estimated using emission factors for mobile fuel combustion (IPCC, 2006). Where stationary equipments were used, emission factors for stationary combustion were used. For materials and components whose emission coefficients were not included in the ICE database, available emission factors from literature were used (see Elijosiute et al., 2012). Hence, embodied carbon emission of material was calculated using the formula: (1) CEM = QM x ECC Where CEM = carbon emission of material, QM = quantity of material and ECC = embodied carbon coefficient. Operational carbon emissions were estimated by applying the operational carbon estimation protocols as developed by IPCC (2006), DEFRA (2009) and World Resources Institute (2012) as well as the common carbon metrics developed by
De-carbonizing the Nigerian Housing Sector
337
UNEP-SBCI (2010) with base data from the International Energy Agency (IEA). Specifically, carbon emissions from grid electricity component of operational energy were estimated using the electricity-specific emission factors developed from IEA data sets by Brander et al. (2011). Operational emissions traceable to direct fuel combustion were estimated by using the analysis of fuel input as against the continuous emissions monitoring system (CEMS). In the analysis of fuel input method, the activity data measured by quantity of fuel consumed is multiplied by the stationary emission coefficient for the particular fuel type. Given the non-availability of emission factors for common fuels specific to Nigeria, default emission factors from IPCC were used. Hence, carbon emission for direct fuel combustion was calculated using the formula: CEF = A x EC (2) Where CEF = carbon emission from direct fuel consumption, A = activity data (litres of fuel), EC = emission coefficient (kgCO2/litre of fuel). Also, emission from grid electricity was calculated using the formula: CEGE = GE x ESEF
(3)
Where CEGE = carbon emission for grid electricity, GE = electricity consumption and ESEF = electricity specific emission factor.
RESULTS Operational Carbon Emissions As earlier observed, the components of primary operational energy consumption in the study area included grid electricity and direct fuel use in the form of LPG, diesel, petrol and kerosene. Hence operational carbon emissions can be discussed under indirect grid emissions and direct emissions. Grid emissions refer to emissions associated with grid electricity consumption while direct emissions refer to emissions associated with direct fuel consumption within the households. Grid Electricity Emissions In this study, the total annual grid electricity consumption per household was found to be 1200kWh. By multiplying the estimated annual electricity consumption per household of 1200kWh by the electricity specific carbon emission factor of 0.43963136kgCO2/kWh (Brander et al., 2011), the total carbon emission per household per annum amounted to 528kgCO2. Hence total carbon emission associated with grid electricity used by the reference building at the operational phase was calculated as 3,168 kg of CO2 per annum and 158,400 kg of CO2 for the 50 year life span of the building. From the foregoing, approximately 0.44kg of CO2 is emitted to
338
I. C. Ezema, A. P. Opoko and A. A. Oluwatayo
the environment for each kWh of grid electricity consumed in the study area. With anticipated increase in electricity generation and consumption in the study area due to ongoing power sector reform, the carbon emissions will rise correspondingly. Given that electricity is largely generated by thermal combustion of fossil fuel in the study area, grid electricity will continue to play an important role in atmospheric carbon emissions. Emissions from Direct Fuel Consumption Emissions from direct fuel consumption are classified as Scope 1 or direct emissions by the IPCC. The protocol for estimating carbon emissions from stationery combustion sources apply in this case. In estimating carbon emissions, the analysis of fuel input method was adopted in this study. Emission of carbon from fuel combustion depends on carbon content of the fuel which in turn depends on fuel type and grade of fuel. The carbon content of fuels can be determined through chemical analysis usually carried out by the fuel supplier. In the absence of context-specific chemical analysis of fuels used in the study area, default emission factors from IPCC (2006) were used. According the resultant CO2 emissions are as shown in Table 2. Table 2: CO2 Emissions from Direct Fuel Consumption Fuel Total Annual Primary Energy *CO2 Emission CO2 Emissions % Type Direct Fuel use Content (MJ) Factor (kg/MJ) (kg) LPG 162. 5kg 7, 686 0. 0631 485 12.7 Petrol 884litres 28, 907 0. 0693 2,003 52.6 Kerosene 520litres 18, 325 0. 0719 1,318 34.6 Total 3,806 100 *Emission factor computed from IPCC (2006) default factors originally in kg/TJ on NHV basis
From Table 2, it can be observed that total CO2 emission from direct fuel consumption in the operation of each household is 3, 806kg per annum. In addition, the largest contribution of 2,003kg or 52. 6% was made by petrol combustion. Similarly, the contribution of kerosene combustion was 1,318kg which accounted for 34.6% of total direct fuel combustion emissions. The least contribution of 485kg or 12.7% was made by LPG. When the total direct emission of 3, 806kg is added to the indirect emission of 528kg from purchased grid electricity, the total annual CO2 emission from the operational activities of a residential unit in the study amounted to 4, 334kgCO2/year or approximately 4.3 tons of CO2 per annum. The result tend to support the earlier submission of Ogunleye (2013) to the effect that grid (indirect) emissions lagged behind other emissions emanating from the energy consumption of households in Nigeria. With specific reference to the predominant typology in the study (Type L1), with six apartments, the total CO2 emission per block per annum is 26,004kg or 26 tonnes. The operational carbon intensity was therefore estimated at
De-carbonizing the Nigerian Housing Sector
339
36.12kgCO2/m2 per annum. Hence in the 50-year life span of the reference building, total carbon emission is put at about 1,300,200kg CO2. Embodied Carbon Emissions Cradle-to-gate embodied emissions were estimated using the ICE database. Transportation emissions were measured by applying the IPCC protocol on mobile emissions. Site construction emissions were estimated from combustion emissions of energy-consuming site construction equipment. Cradle-to-Gate Emissions Cradle-to-gate carbon emissions from building materials were estimated using the ICE database inventory. The quantities of basic building materials used in the construction of the prototype building earlier estimated were multiplied by the embodied carbon coefficients of the materials as contained in the ICE database. Carbon emissions coefficients that were not available in the ICE database were obtained from other sources as indicated in Table 3 which shows the summary of the cradle-to-gate embodied carbon computations. Altogether, the reference building through its materials of construction emits about 238,588.98kg or approximately 239 tonnes of CO2 to the environment. Table 3: Cradle to Gate Embodied CO2 Emissions Building Component Substructure Frame and Upper Floors External and Internal Walls Roof Structure and Covering Doors and Windows Fittings and Fixtures Wall Finishes Floor Finishes Ceiling Finishes Plumbing Installations Electrical Installations Painting TOTAL
Embodied CO2 (kg) 42,231.09 66,539.80 32,463.84 8,381.18 8,313.46 7,174.92 23,861.66 23,036.39 2,636.39 5,498.67 11,314.67 7,136.89 238,588.96
Percentage 17.7 27.9 13.6 3.5 3.5 3.0 10.0 9.7 1.1 2.3 4.7 3.0 100
From Table 3 it is obvious that the embodied carbon emissions follow the same pattern as the embodied energy. Hence the building frame and upper floors contributed most (27. 89%) to the carbon emissions of the reference building followed by substructure and walls with 1.70% and 13.61% respectively. The building superstructure contributed approximately 63% of the whole carbon emissions while the remaining 37% was contributed by finishes, fixtures and services. Wall and floor finishes contributed approximately 20% of the 37% for finishes, fixtures and services.
340
I. C. Ezema, A. P. Opoko and A. A. Oluwatayo
Hence, in proposing carbon mitigation strategies in the study area, the building superstructure, wall and floor finishes should be the obvious targets. Transportation Emissions Transportation emission was estimated from the direct fuel consumption associated with material transportation from gate to the site. Transportation of building materials and components in the study area was by diesel-powered vehicles. In an earlier study of same building focusing on embodied energy (Ezema et al., 2015), it was found that 2, 788 litres of diesel were consumed by vehicles transporting 1396 tonnes of building materials to site. Using the activity based method where carbon emission from mobile combustion is calculated as the product of fuel consumption and the fuel emission conversion factor, and applying the emission conversion factor of 2.7kg of CO2 per litre of diesel as given by the World Resources Institute (WRI, 2012), the CO2 emissions from material transportation was estimated to be 7,527. 60kg CO2 with the detailed calculation shown below: Total quantity of diesel used for transportation = 2788 litres Emission factor for mobile combustion of diesel = 2. 7kg/litre Total emissions = 2788 x 2. 7 = 7527. 6kg Site Construction Emissions The emissions from site construction were estimated by applying the activity based method to site grid electricity consumption and direct fuel consumption traceable to site construction equipment. The electricity specific emission factor of 0.43963136 was applied to grid electricity consumption, while the IPCC default factors as indicated in Table 2 were applied to direct fuel consumption values. Based on this, the CO2 emissions associated with site construction were calculated and the result is presented in Table 4. Table 4: Site Construction Emissions Type of Energy or Fuel Grid Electricity Petrol Diesel Lubricants TOTAL
Quantity 450 kWh 900 litres 300 litres 24 litres
Primary Energy Equivalent (MJ) 4,585. 00 29,430. 00 10,782. 00 941. 04 45,738. 04
CO2 Emissions (kg)
%
197.83 2, 039.50 798.95 68.98 3,105.26
6.4 65.7 25.7 2.2 100
From the table, the total carbon emission associated with site construction was estimated at 3, 105. 26kg. Out of the total site construction emissions, petrol and diesel combustion accounted for 65.7% and 25.7% respectively, while grid electricity emissions accounted for 6. 4%. Incidentally, the petrol and diesel combustion were associated with on-site electricity generation through the use of generators. If the lubricants used for the site equipments are taken into consideration, about 94% of site construction emissions came from non-grid sources.
De-carbonizing the Nigerian Housing Sector
341
Maintenance (Recurring) Emissions Emissions from building maintenance were estimated by adding emissions associated with the materials for maintenance to the emissions associated with transporting the materials. Cradle-to-gate emissions associated with materials were already estimated in Table 3. Also, for materials transportation, a total of approximately 2788 litres of diesel was used to transport 1396 tonnes of building materials. Hence, on a proportional basis, approximately 2 litres of diesel would be needed to transport a tonne of building material. Using the above ratio, the volume of diesel needed to transport maintenance materials was estimated and then multiplied by 2. 7 which is the unit weight of CO2 in a litre of diesel under mobile combustion scenario as earlier stated. The result as presented in Table 5 shows that the total recurring CO2 emission from the reference building is 174, 862.01kg which comprise of 172, 834.31kg from the material content and 2027.70kg from the transportation content. Table 5: Recurring Embodied Carbon Emissions Building Component
Initial Embodied Carbon (kgCO2)
Substructure 42, 231. 09 Frame and 66, 539-80 Upper Floors External and 32, 463. 84 Internal Walls Roof Structure 8, 381. 18 and Covering Doors and 8, 313. 46 Windows Fittings and 7, 174. 92 Fixtures Wall Finishes 23, 861. 66 Floor Finishes 23, 036. 39 Ceiling 2, 636. 39 Finishes Plumbing 5, 498. 67 Installations Electrical 11, 314. 67 Installations Painting 7, 136. TOTAL a NA: Not applicable
Number of Replacement
Transportation Emissions for the Replacement (kgCO2)
none none
a
none
a
a
NA NA NA
Recurring Embodied Carbon Emissions (kgCO2) a NA a NA a
NA
1
45. 90
8, 427. 08
1
45. 90
8, 359. 36
2
91. 80
14, 441. 64
2 2 1
912. 60 783. 00 54. 00
48, 635. 92 46, 855. 78 2, 690. 39
1
10. 80
5, 509. 47
1
8. 10
11, 322. 77
4
75. 60 2, 027. 70
28, 619. 60 174, 862. 01
342
I. C. Ezema, A. P. Opoko and A. A. Oluwatayo
Total Carbon Emissions The summary of operational carbon emissions for the reference building is as shown in Table 6. Total operational carbon emission for a year for the reference building was estimated at 26, 004kg. When estimated for the life span of the building, the total operational carbon emission was found to be around 1,300, 200kg which is equivalent to operational intensity of 1806kgCO2/m2. The grid electricity component of operational carbon was about 12. 18% while the direct fuel combustion component constituted the other 87. 82%. From the foregoing, it is evident that the operational carbon emission in the reference building is dominated by off-grid direct fuel combustion. This is an indication that the grid electricity sector is lagging behind other sources of energy. While direct fuel combustion contributed about 88% of operational carbon emissions, grid electricity contributed only about 12%. Table 6: Summary of Operational Carbon Emissions Type of Operational Energy CO2Emissions/year Carbon Emissions for % (kgCO2) Building life span (kgCO2) Grid Electricity 3, 168 158, 400 12. 2 Direct Fuel Combustion 22, 836 1, 141, 800 87. 8 TOTAL 26, 004 1, 300, 200 100
The summary of embodied carbon emissions is as presented in Table 7. Total embodied carbon emission was estimated to be 424, 083. 23 kg which is equivalent to embodied carbon intensity of 589kgCO2/m2. The major components of embodied emissions were the cradle-to-gate emissions (56. 3%) and the recurring embodied carbon emissions (41. 2%). Transportation and construction emissions were found to be only 2. 5% of total embodied carbon emissions. From the foregoing, it can be seen that materials for both the initial construction and maintenance are the main sources of carbon emissions in residential buildings within the study area. Hence, carbon mitigation strategies should focus on materials of construction and materials for maintenance. In maintenance, the frequency of building component replacement during the life span of the building is critical. Therefore, materials with little or no replacement during the life span of the building are preferred. Table 7: Summary of Embodied Carbon Emissions Phase of Embodied Carbon Cradle-to-gate Transportation Site Construction Recurring Embodied Carbon TOTAL
Quantity (kgCO2) 238, 588. 96 7, 527. 00 3, 105. 26 174, 862. 01 424, 083. 23
% 56. 3 1. 8 0. 7 41. 2 100
De-carbonizing the Nigerian Housing Sector
343
The total life cycle carbon emission for the reference building is 1,724,283.23kg or 1, 724.28 tonnes. Also, the carbon emission intensity of the building is approximately 2, 395kg/m2 or 48kg/m2/year. Carbon emissions from the building sector are determined by the type and quantity of energy consumed in the buildings.
DISCUSSION AND IMPLICATIONS OF FINDINGS The use of different life cycle boundaries usually affects the result of life cycle assessments. The present study used the cradle-to-grave life cycle boundary which is the same adopted in the Chinese study (Li et al., 2013) and the Turkish study (Atmaca and Atmaca, 2015). Comparatively, the present study estimated total life cycle carbon intensity to be 2395kg/m2 as against 1808kg/m2 (Li et al., 2013) and 52226485kg/m2 as estimated by Atmaca and Atmaca (2015). Interestingly, the smaller of the Turkish example is more carbon intense because of the use of coal as operational energy source. The above implies substantial variability of intensities even within the same context with the Chinese building being the least carbon intense while the Turkish examples are the most carbon intense. However, if the boundary conditions are disaggregated broadly into the embodied and operational phases, the findings of the present study are generally in agreement with previous findings. For instance, the estimated embodied intensity of 589kg/m2 in present study is more than the 397kg/m2 estimated in Abanda et al (2014). However, the latter intensity is lower because it did not incorporate transportation, site construction and recurring emissions. Similarly, the Chinese study (Li et al., 2013) got a higher value (614kg/m2) than the present study. This could be ascribed to larger footprint of the Chinese building as well as the primary energy source dominated by inefficient coal. At the operational phase, the Chinese building is also the least carbon intense while the Turkish examples are the most intense. The energy for operation of the Chinese building came mainly from natural gas electricity while direct combustion of petrol dominated domestic energy use in the present study. Carbon intensity depends mainly on the type and quantity of energy used for building operation and to a lesser extent on the energy associated with building procurement. In order to reduce operational carbon emissions at domestic level, the quality and quantity of energy use need to be addressed. On the supply side, this can be done through the use of low carbon energy sources such as renewable energy and more efficient electricity the reduction of energy consumption at household level through building design and specification of energy efficient appliances constitute the demand side. The reduction of embodied carbon through the use of low carbon building materials and efficient construction methods can also be very significant. Energy consumption and carbon emissions benchmarks and reduction targets are not yet operational in Nigeria as efforts appear to be focused on perceived high emitting sectors such as agriculture, land use, forestry as well as the oil and gas industry. However, emissions from the building sector should not be ignored in the match towards low carbon development as the findings of this study indicate that emission from the building sector is increasing alongside rapidly increasing building stock and
344
I. C. Ezema, A. P. Opoko and A. A. Oluwatayo
increasing ownership levels of energy consuming appliances. Carbon mitigation strategies should ideally target energy consumption first
CONCLUSION This paper underscored the importance of the built environment especially residential buildings in the reduction of carbon emissions and climate change mitigation. The life cycle carbon assessment method was used to evaluate a predominant residential building prototype in a Nigerian context in order to place it in the wider research context and as a prelude to identifying aspects of the building life cycle that should be targets of carbon reduction strategies. The study found that the operational and embodied carbon impacts are significant in varying degrees and concluded that carbon mitigation strategies should target operational energy consumption as well as the hidden energy consumed in the manufacture and assembly of building materials and components. The adoption of low carbon energy development strategies such as increasing use of renewable energy and energy efficient practices becomes apposite. In Nigeria, carbon emissions awareness is growing but mitigation targets are still not in existence which makes mitigation efforts rather voluntary. As the world prepares to achieve carbon neutrality in buildings by 2050, there is the need to understand the pattern of carbon emissions from current building stock especially in contexts where such studies are few and far between and this study has contributed towards bridging the gap. Sometimes, however, the engineering approach outlined above may not be adequate. It may be necessary to combine it with the “soft” engineering approach which includes preservation and promotion of natural carbon sinks such as green infrastructure.
REFERENCES [1]
[2]
[3]
[4]
Abanda, F. H., Nkeng, G. E., Tah, J. H. M., Ohandja, E. N. F. and Manjia, M. B. (2014), Embodied Energy and CO2 Analyses of Mud-brick and Cementblock Houses. AIM’s Energy, 2(1), 18-40. Adedeji, Y. M. D. (2011), Sustainable Housing in Developing Nations: The Use of Agro-Waste Composite Panels for Walls, The Built & Human Environment Review, 4(2011), 36-43. Adeoti, O. & Osho, S. O. (2012), Opportunities to reduce greenhouse gas emissions from households in Nigeria, Mitigation and Adaptation Strategies for Global Change, 17(2), 133-152 Adunola, A. O and Ajibola, K (2012), Thermal Comfort Considerations and Space Use within Residential Buildings in Ibadan, Nigeria. Proceedings, 7th Windsor Conference on the Changing Context of Comfort in an unpredictable World, Windsor, UK, 12-15 April, Retrieved from: http://nceub. org. uk on 13/07/2014.
De-carbonizing the Nigerian Housing Sector [5]
[6]
[7] [8]
[9]
[10]
[11]
[12]
[13] [14]
[15]
[16]
[17]
345
Alam, M. S. and Ahmad, S. I. (2013), Analysis of the life cycle environmental impact of residential building in Bangladesh, International Journal of Technology Enhancements and Emerging Engineering, 2(1), 1 – 4. Ali, A. A. M., Hagishima, A., Abdel-Kader, M. and Hammad, H. (2013), Vernacular and Modern Buildings: Estimating the CO2 Emissions from the building materials in Egypt, Building Simulation Conference, Cairo, Egypt, 23-24 June. Anastassia, M., Fredrick, O., and Malcolm, W. (2009), The Future of Carbon Capture and Storage (CCS) in Nigeria, Science World Journal, 4(3): 1-6. Arayela, O. and Taiwo, A. A. (2010), Stabilized Laterite Bricks as an Appropriate Walling Material Technology for Increasing Housing Stock in Some Selected African Countries, Proceedings of XXXVII IAHS World Housing Congress, October 26-28, Santacher, Spain. Atmaca, A. and Atmaca, N. (2015), Life cycle energy (LCEA) and carbon dioxide emissions (LCCO2A) assessment of two residential buildings in Gaziantep, Turkey, Energy and Buildings, 102, 417-431 Brander, M., Sood, A., Wylie, C., Haughton, A. & Lovell, J. (2011), Electricity-Specific Emission Factors for Grid Electricity, Technical Paper, Econometrica. http://www. econometrica. com/assets/Electricity-specificemission-factors-for-grid-electricity. pdf. on 16/01/2016. Cervigni, R., Rogers, J. A. and Henrion, M. (Eds. ) (2013), Low-carbon Development Opportunities for Nigeria, Directions in Development, Washington DC: The World Bank. Retrieved from: http://doi:10. 1596/978-08213-9925-5 on 13/09/2014. Committee on Climate Change (2014), Meeting Carbon Budgets: 2014 Progress Report to Parliament, https://www. theccc. org. uk/wp. content/uploads/2014/07/CCC-Progress-Report-2014_web_2. pdf. on 16/01/2016. Dayo, B., Gilau, A. and Samec, M. (2009), Nigeria’s Perspective on Climate Change Mitigation, ICEED Working Paper, September, 2009, Abuja, Nigeria. DCCEE (2009), Australia National Greenhouse Accounts: National Inventory by Economic Sectors, Department of Climate Change and Energy Efficiency, Commonwealth of Australia. DEFRA (Department for Environment Food and Rural Affairs) (2009), Guidance on how to measure and report your greenhouse gases emissions, DEFRA in collaboration with Department of Energy and Climate Change. Retrieved from: http://www. defra. gov. uk/environment/business/reporting/index. htm. on 23/09/2013 Dumani, N. and Ampofo-Anti, N. L. (2015), Cradle to Gate Energy and Greenhouse Gas Emissions for South African Concrete and Rebar, Proceedings, 5th CIB International Conference on Smart and Sustainable Built Environment, University of Pretoria, Pretoria, Soth Africa, 9-11 December Ede, A. N., Adebayo, S. O., Ugwu, E. I. and Emenike, C. P. (2014), Life Cycle Assessment of Environmental Impacts Using Concrete or Timber to
346
[18]
[19]
[20]
[21]
[22]
[23]
[24]
[25]
[26]
[27]
[28]
[29]
I. C. Ezema, A. P. Opoko and A. A. Oluwatayo construct a Duplex Residential Building, Journal of Mechanical and Civil Engineering, 11(2), 62-72. Eleri, E. O., Ugwu, O. and Onuvae, P. (2012), Expanding Access to Pro-Poor Energy Services in Nigeria, International Centre for Energy Environment and Development. Eleri, E. O., Onuvae, P. and Ugwu, O. (2013), Low-carbon Energy Development in Nigeria: Challenges and Opportunities, International Institute for Environment and Development (IIED), London, UK. Elijosiute, E., Balciukeviciute, J. and Denafas, G. (2012), Life Cycle Assessment of Compact Fluorescent and Incandescent Lamps: Comparative Analysis, Environmental Research Engineering and Management, 3(61), 6572. European Commission (2014), Communication from the Commission to the European Parliament, The Council, The European Economic and Social Committee of the Regions on Resource Efficiency Opportunities in the Building sector. ec. europa. eu/environment/eussd/pdf/SustainableBuildingCommunication. pdf. on 25/01/2016. Ezema, I. C., Olotuah, A. O. and Fagbenle, O. I. (2015), Estimating embodied energy in residential buildings in a Nigerian context, International Journal of Applied Engineering Research, 10(24), 44140-44149. Federal Ministry of Power and Steel (2006), Renewable Electricity Policy Guidelines, International Centre for Energy, Environment and Development, Abuja, Nigeria. FGN, (2015), Nigeria’s Intended Nationally Determined Contribution, www4. unfccc.int/submissions/INDC/PublishedDocuments/Nigeria/1/ApprovedNigeri a’Sindc_271115. pdf. on 17/01/2016. Graedel, T. E., Lanzano, T., Pott, W. & Araujo, R. J. (2005), Multiscale Life Cycle Assessment, Working Paper No. 6, Yale School of Forestry & Environmental Studies Gupta, R. (2014), Towards Low Carbon Buildings: International Perspectives on Metrics, Policies and Practices, Joint GCID/SDN/SPA Lecture, Public Lecture Series, University of Glasgow. www. gla. ac. uk/media/media_311572_en. pdf. on 16/01/2016. Hammond, G. and Jones, C., Inventory of Carbon and Energy (ICE), Version 2. 0, SERT, Department of Mechanical Engineering, University of Bath, UK, 2011. Herczeg, M., McKinnon, D., Milos, L., Bakas, T., Klaassens, E., Svatikova, K. and Widergerg, O. (2014), Resource Efficiency in the Building Sector: Final Report to DG Environment EU, ECORYS, Nederlands. www. ec. europa. eu/environmental/eussd/pdf/ResourceEfficiencyin the building sector. pdf. Hogarth, J. R., Haywood, C. and Whitley, S. (2015), Low carbon development in sub-Saharan Africa: 20 cross-sector transitions, Oversea Development Institute, London
De-carbonizing the Nigerian Housing Sector [30]
[31]
[32]
[33] [34] [35] [36]
[37]
[38]
[39]
[40]
[41]
[42]
[43]
347
Ibem, E. O., Opoko, A. P; Adeboye, A. B. & Amole, D., (2013) Performance Evaluation of Residential Buildings in Public Housing Estates in Ogun State, Nigeria: Users' Satisfaction Perspective, Frontiers of Architectural Research, 2 (2013), 175-190. Ilesanmi, A. O (2010), Post-occupancy evaluation and residents’ satisfaction with public housing in Lagos, Nigeria. Journal of Building Appraisal, 6(2), 153-169 Ilesanmi, A. O. (2012), Housing, Neighbourhood Quality and Quality of life in Public Housing in Lagos, Nigeria. International Journal of Housing Studies, 36(4), 231-240. INCCA (2010), India: Greenhouse Gas Emissions 2007, INCCA and Ministry of Environment and Forests International Organization for Standardization (ISO) (2006), Life Cycle Assessment (ISO 14040). ISO Geneva, Switzerland. IPCC (2006), Stationery Combustion, Guidelines for National Greenhouse Gas Inventories, Chapter 2, Volume 2, IPCC, Geneva, Switzerland. Irimiya, Y., Humphrey, I. A and Aondover, I. I (2013), Assessment of energy use pattern in residential buildings of Kano and Kaduna, Northern Nigeria. American Journal of Engineering Research (AJER), 02(10), 271-275. Jain, J. S., and Salgude, R. R., (2010), Comparison of Carbon Emission & Embodied Energy between Brickwork & Waffle wall method for Industrial Building, International Journal of Innovative and Emerging Research in Engineering, 2(6), 1-10 Jeje, B. (2013), Green Buildings and Low energy houses as adaptation tools for climate change in Lagos State, Lead paper, 5th Lagos State Climate Change Summit, 13-15 March, 2013, Lagos, Nigeria. Jennings, M., Hirst, N. and Gambhir, A. (2011), Reduction of Carbon Dioxide Emissions in the Global Building Sector to 2050, Report GR3, Grantham Institute for Climate Change, Imperial College London. https://www. imperial. ac. uk/media/imperial-college/grantham-institute/public/publications/institutereports-and-analytical-notes/Reduction-of-carbon-dioxide-emissions-in-theglobal-building-sector-to-2050-GR-3. pdf. on 23/01/2016. Jiboye, A. D (2010). The correlates of public housing satisfaction in Lagos, Nigeria: Feedback for residential improvement, Frontiers of Architectural Research, 1: 236-243 KPMG (2013), A Guide to the Nigerian Power Sector, KPMG Advisory Services, Nigeria. Retrieved from: http://www. kpmg. com/African/en/IssuesAndInsights/Articles on 25/05/2014. Lagos Bureau of Statistics (2013), Digest of Statistics 2013, Lagos Bureau of Statistics, Ministry of Economic Planning and Budget, Lagos State Government Lagos State Government (2012), Lagos State Investor Handbook: A Guide to Business and Investment in Lagos State. Retrieved from: www. lagosstate. gov. ng on 11/10/2014.
348
I. C. Ezema, A. P. Opoko and A. A. Oluwatayo
[44]
Li, D. Z., Chen, H. X., Hui, E. C. M., Zhang, J. B. and Li, Q. M. (2013), A methodology for estimating the life-cycle carbon efficiency of a residential building, Building and Environment, 59, 448-455. Mbamali, I., Stanley, A. M. and Zubairu, I. K. (2012), Environmental, Health and Social Hazards of Fossil Fuel Electricity Generators: A Users’ Assessment in Kaduna, Nigeria, American International Journal of Contemporary Research, 2(9), 231-245. Melo, C. A., Jannuzzi, G. M. and Tripodi, A. F. (2013), Evaluating public policy mechanisms for climate change mitigation in Brazilian buildings sector, Energy Policy, 61, 1200-1211. Mpakati-Gama, E. C., Brown, A. and Sloan, B. (2015), Embodied energy and carbon analysis of urban residential buildings in Malawi, International Journal of Construction Management, 2015 http://dx. doi. org/10. 1080/15623599. 2015. 1110274 National Bureau of Statistics NBC (2010), Annual Abstracts of Statistics 2010, Federal Republic of Nigeria. Retrieved from: www. nigeriastat. gov. ng. on 31/08/2013 Okonjo-Iweala, N., Unleashing the Housing Sector in Nigeria and in Africa, Keynote Paper, 6th Global Housing Finance Conference, World Bank HQ, Washington DC, USA, 2014. Ogbonna, A. C., Onazi, O. and Dabtong, J. S. (2008) Domestic Energy Consumption Patterns in a Sub-Sahara African City: The Study of Jos-Nigeria, Journal of Environmental Sciences and Resource Management, 3: 48-63. Ogunleye, J. (2013), Promoting Low Carbon Development Strategies-The Nigerian Experience, Paper Presented at the 5th African Carbon Forum, Abdijan, Ivory Coast, 3-5 July. Retrievedfrom:www. africacarbonforum. com/2013/docs/Presentations/D3/RT7/RT7_JamesOgunleye_CabonLimitsNig eria. pdf on 12/12/13. Olaniyan, S. A. (2012), Optimizing thermal comfort for tropical residential designs in Nigeria: How significant are walling fabrics. Proceedings of 2nd Conference on People and Buildings, London Metropolitan University, 18th September. Network for Comfort and Energy use in Buildings. Retrieved from: http://www. nceub. org. uk on 28/07/2014. Olivier, J. G. J, Janssens-Maenhout, G., Muntean, M. and Peters, J. A. H. W. (2015), Trends in Global CO2 Emissions: 2015 Report. The Hague: PBL Netherlands Environmental Assessment Agency; Ispra: European Commission Joint Research Centre. Olivier, J. G. J., Janssens-Maenhout, G. and Peters, J. A. H. W. (2012), Trends in Global CO2 Emissions: 2012 Report. The Hague: PBL Netherlands Environmental Assessment Agency; Ispra: European Commission Joint Research Centre. Otegbulu, A. C. (2011), Economics of Green Design and Environmental Sustainability, Journal of Sustainable Development, 4: 240-248
[45]
[46]
[47]
[48]
[49]
[50]
[51]
[52]
[53]
[54]
[55]
De-carbonizing the Nigerian Housing Sector [56]
[57]
[58] [59]
[60]
[61]
[62]
[63]
[64]
[65] [66]
[67]
[68]
349
Ramesh, T., Prakash, R. and Shukla, K. K. (2013), Life Cycle Energy Analysis of a Multifamily Residential House: A case study in Indian Context, Open Journal of Energy Efficiency, 2: 34-41. Sambo, A. S., Garba, B., Zama, I. H. and Gaji, M. M. (2012), Electricity Generation and the Present Challenges in the Nigerian Power Sector, Journal of Energy and Power Engineering, 6(7), 1050-1059. Shukla, P. R., Dhar, S., Pathak, M., Mahadevia, D. and Garg, A. (2015), Pathways to deep decarbonization in India, SDSN-IDDRI. Surahman, U. and Kubota, T. (2013), Life Cycle Energy and CO2 Emissions of Residential Buildings in Bandung, Indonesia, Advanced Materials Research, 689, 54-59. UNEP SBCI (2009a), Greenhouse Gas Emission Baselines and Reduction Potentials in South Africa: A Discussion Document, UNEP SBCI in collaboration with CIDB. http://www. unep. org/sbci/pdfs/SBCI-SAreport. pdf. on 17/01/2016. UNEP SBCI (2009b), Building and Climate Change: Summary for DecisionMakers, UNEP, Paris. www. unep. org/sbci/pdfs/SBCI-BCCSummary, pdf. On 23/01/2016. UNEPSBCI (2010), Common Carbon Metric for Measuring Energy Use and Reporting Greenhouse Gas Emissions from Building Operations, UNEP. www. unep. org/sbci/pdfs/UNEPSBCICarbonMetric. pdf. on 16/01/2016. USDOE (2012), Buildings Energy Data Book: Environmental Data, US Department of Energy, http://buildingsdatabook. eren. doe. gov/TableView. aspx?table=1. 4. 1 on 29/01/2016 WBCSD (2004), The Greenhouse Gas Protocol: A Corporate Accounting and Reporting Standard, Revised Edition, World Resources Institute. www. wri. org/sites/default/files/pdf/ghg_protocol_2004. pdf. on 16/01/2016. World Resources Institute (WRI) (2011), Climate Analysis Indicators Tool (CAIT), Volume 8, DC, USA. World Resources Institute, Washington World Resources Institute (WRI) (2012), Green House Gases Calculation Tools for Stationery Emission Sources. World Resources Institute, Washington DC, USA. http://www. ghgprotocol. org/templates/GHG5/layout. asp?type=p&Menuld=OTAx on 22/08/2014. Yeo, Y., Shim, D., Lee, J. and Altmann, J. (2015), Driving Forces of CO2 Emissions in Emerging Countries: LMDI Decomposition Analysis on China and India’s Residential Sector, Sustainability, 7, 16108-16129. You, F., Hu, D., Zhang, H., Guo, Z. Zhao, Y., Wang, B. and Yuan, Y. (2011), Carbon emissions in the life cycle of urban building systems in China-A case study of residential buildings, Ecological Complexity, 8, 201-212.