Clays and Clay Minerals,
Vol.44, No. 5, 677-685, 1996.
C O M P A R I S O N OF T E C H N I Q U E S FOR D E T E R M I N I N G THE F R A C T A L D I M E N S I O N S OF C L A Y M I N E R A L S KALUMBU MALEKANI, 1 JAMES A . RICE, 1 AND JAR-SHYONG LIN 2 1 Department of Chemistry and Biochemistry, South Dakota State University, Brookings, South Dakota 57007 2 Center for Small-Angle Scattering, Solid-State Division, Oak Ridge National Laboratory, Oak Ridge, Tennessee 37831 Abstract---Small-angle X-ray scattering (SAXS), adsorption and nuclear magnetic resonance (NMR) techniques were used to determine the fractal dimensions (D) of 3 natural reference clays: 1) a kaolinite (KGa-2); 2) a hectorite (SHCa-1), and 3) a Ca-montmorillonite (STx-1). The surfaces of these clays were found to be fractal with D values close to 2.0. This is consistent with the common description of clay mineral surfaces as smooth and planar. Some surface irregularities were observed for hectorite and Camontmorillonite as a result of impurities in the materials. The SAXS method generated comparable D values for KGa-2 and STx-1. These results are supported by scanning electron microscopy (SEM). The SAXS and adsorption methods were found to probe the surface irregularities of the clays while the nuclear magnetic resonance (NMR) technique seems to reflect the mass distribution of certain sites in the material. Since the surface nature of clays is responsible for their reactivity in natural systems, SAXS and adsorption techniques would be the methods of choice for their fractal characterization. Due to its wider applicable characterization size-range, the SAXS method appears to be better suited for the determination of the fractal dimensions of clay minerals. Key Words--Adsorption, Clay, Fractal, NMR, Small-angle x-ray scattering.
INTRODUCTION
erals c o n t r i b u t e significantly to the surface reactivity o f soils in natural s y s t e m s w h e r e they are f o u n d in i n t i m a t e a s s o c i a t i o n w i t h soil organic m a t t e r (Keil et al. 1994; M a y e r 1994; Collins et al. 1995). Thus, it is vital to b e able to q u a n t i t a t i v e l y c h a r a c t e r i z e their surface m o r p h o l o g y to b e t t e r u n d e r s t a n d the i n t e r a c t i o n o f clays w i t h i n o r g a n i c ions a n d various natural, as well as a n t h r o p o g e n i c , organic s u b s t a n c e s in the env i r o n m e n t . O n e w a y o f c h a r a c t e r i z i n g surface morp h o l o g y is b y u s i n g fractal g e o m e t r y . Fractal g e o m e t r y has b e e n u s e d to c h a r a c t e r i z e the surface structure, characteristics a n d irregularities o f solid materials. Fractal d i m e n s i o n s , D, are n u m b e r s u s e d to q u a n t i f y t h e s e properties. A v n i r et al. (1984) r e p o r t e d that surfaces o f m o s t solid s u b s t a n c e s are fractals a n d are c h a r a c t e r i z e d b y n o n i n t e g r a l d i m e n sions w i t h v a l u e s b e t w e e n 2 a n d 3 : 2 < D -< 3. T h e s e fractal d i m e n s i o n s are a m e a s u r e o f the space filling ability o f the s u b s t a n c e (van D a m m e et al. 1986). T h e l a r g e r the D value, the m o r e irregular a n d space filling the surface is, a n d a s u b s t a n c e w i t h D -- 2 h a s a s m o o t h a n d p l a n a r surface m o r p h o l o g y . A f u n d a m e n t a l characteristic o f fractal g e o m e t r y is that fractal s u b s t a n c e s are self-similar. T h e s h a p e o f the surface irregularities o f these s u b s t a n c e s is invariant o v e r a certain r a n g e o f scale t r a n s f o r m a t i o n ( v a n D a m m e a n d Fripiat 1985). A n i n c r e a s e in the r e s o l v i n g p o w e r u s e d in the e x a m i n a t i o n o f the surface reveals s m a l l e r details m o r p h o l o g i c a l l y similar to larger details p r e v i o u s l y o b s e r v e d . R e g a r d l e s s o f the m e t h o d u s e d to m e a s u r e the fractal d i m e n s i o n , fractality is detected b y p e r f o r m i n g a r e s o l u t i o n analysis, for e x a m -
M a n y reactions in soils are c o m m o n l y associated w i t h the surface c h e m i c a l properties o f clay minerals. T h e s e properties include c a t i o n e x c h a n g e c a p a c i t y (CEC), surface c h a r g e density, surface area a n d surface acidity. F o r instance, the a d s o r p t i o n o f n-bytul-, n-dodecyl- and ethyldimethyl/octacedecenylammon i u m ions b y K - s a t u r a t e d kaolinite, illite a n d m o n t m o r i l l o n i t e h a s b e e n s h o w n to d e p e n d u p o n the C E C o f the clays ( T h e n g 1974). H o w e v e r , surface reactions do n o t d e p e n d o n l y o n the c h e m i c a l properties. T h e g e o m e t r y or m o r p h o l o g y o f the surface also affects its reactivity (Farin a n d A v n i r 1989). T h e surface morp h o l o g y d e t e r m i n e s the extent o f the surface that is accessible to a n y potential adsorbate. S u b s t a n c e s w i t h r o u g h or c o n v o l u t e d surfaces will h a v e restricted accessibility d e p e n d i n g u p o n their pore size a n d the size o f the a d s o r b a t e molecules. S m a l l m o l e c u l e s w o u l d p e n e t r a t e the p o r e s o f the a d s o r b e n t w h e r e a s m a c r o molecules would be excluded from narrow pores ( M a y e r 1994). H o w e v e r , s u b s t a n c e s w i t h fiat or s m o o t h surfaces will h a v e s o r p t i o n sites equally accessible to b o t h s m a l l m o l e c u l e s a n d m a c r o m o l e c u l e s . In fact, m a c r o m o l e c u l e s w o u l d o u t c o m p e t e l o w - m o lecular w e i g h t c o m p o u n d s for free m i n e r a l surfaces due to t h e i r greater p o t e n t i a l r a n g e o f interactions, including b o t h c o u l o m b i c a n d v a n der W a a l ' s interactions ( O c h s et al. 1994). T h e surfaces o f clay m i n e r a l s h a v e usually b e e n described as s m o o t h a n d planar. However, S E M h a s s h o w n that clay m i n e r a l s do n o t a l w a y s h a v e p e r f e c t l y s m o o t h or flat surfaces ( W h i t e et al. 1991). T h e s e m i n Copyright 9 1996, The Clay Minerals Society
677
Malekani, Rice, and Lin
678
Clays and Clay Minerals
Table 1. Some fractal dimension results of selected materials. Method
Material
Measured D
Reference
SAXS
Lahn river sediment
2.75 -+ 0.10
Schmidt 1989
Adsorption
Soil (kaolinite, trace hallosite) Soil (mainly feldspars, quartz & limonite) Al-pillard montmorillonite
2.92 • 0.02 2.29 • 0.06 1.94 • 0.10
Avnir et al. 1984
NMR
Alcogelt Aerogel 1:~ Aerogel 2~: Crystallized silica
2.85 2.30 2.10 2.85
Farin & Avnir 1989 Devreux et al. 1990
t Obtained by gelation of silica solution. :~ Obtained by evacuating solvent of silica solution under hypercritical conditions.
ple, analyzing the change in a measurable property as the resolving p o w e r is varied (Rojanski et al. 1986). Various techniques have been used to characterize the surface m o r p h o l o g y o f solid materials. These include S A X S , adsorption- and N M R - b a s e d methods. S o m e D values obtained by each of the above methods are given for a variety o f solid materials in Table 1. Small-angle X-ray scattering has been the most comm o n l y e m p l o y e d technique. In a S A X S experiment, a b e a m o f m o n o c h r o m a t i c X-rays is directed at the material to be characterized (Schmidt 1989). The intensity (/) o f the scattered X-rays is measured as a function of the scattering angle which is usually expressed as the scattering vector, q. The intensity as a function of q ( l ( q ) ) is related to q by the power-law relationship in Equation 1: l(q) ~ q ~
[1]
The magnitude of the exponent a, which is obtained from the slope of a log-log plot of I ( q ) versus q, is directly related to D. If c~ ~ 3 then the substance is a mass fractal. A mass fractal is a substance whose surface and mass are both characterized by fractal properties. The power-law exponent, ec, corresponds to the mass fractal dimension, Din, and is less than or equal to 3 (Schmidt 1989). If 3 < ec -< 4 then the substance is a surface fractal. A surface fractal is one in which only the surface o f the material exhibits fractal behavior. The surface fractal dimension, D s, is related to by the following: cc = 6 - Ds. The magnitude of a for a surface fractal is within the range 3 < 6 - D~ --< 4. The unit of resolution for the S A X S m e t h o d is q which is dependent on, and related to the scattering angle, 0, by Equation 2: q = 4"rrh -1 sin 0/2
[2]
where: h is the X-ray wavelength. The range of resolutions for which a structure is fractal is determined by the g e o m e t r y of the instrument and is expressed as 1/qm~ x < L < 1/qm~n, where q,~n and qm~x are the minim u m and m a x i m u m values o f q for which power-law scattering is observed (Schmidt 1989).
A v n i r and co-workers (Avnir et al. 1983; Pfeifer and A v n i r 1983; A v n i r et al. 1984) proposed the use of adsorbed molecules for characterizing the fractal dimension of natural surfaces. This m e t h o d is based upon the measurement of m o n o l a y e r coverage, X m, of the sample surface with some adsorbate molecule. The measurement is made either with probe molecules of increasing effective cross sectional area ~r, or by using the same adsorbate m o l e c u l e but varying the size, R, of sample particles. M o n o l a y e r coverage is dependent upon the size of the sample particles or probe molecules. T h e y are related by the power-law: X~, oc (crmlR) o~
[3]
The fractal dimension is obtained from the slope of the log-log plot of Xm versus cr or R. The use of a variety of molecular probes gives information on surface roughness, or irregularity and porosity at molecular scale, whereas using sample particles of different size gives information on surface roughness and porosity at the particle scale. Since the surface reactivity is characterized at the molecular level, we chose to use adsorbate molecules o f varying cross sectional area to v a r y our resolving p o w e r for these experiments. The smaller the m o l e c u l e the higher the resolution, that is, the m o r e details of the surface irregularity that will be observed. The smallest and largest molecular probes constitute the limits o f the resolution scale over which the material is fractal. Recently D e v r e u x et al. (1990) reported an N M R method for measuring the fractal dimension of Si containing materials. This m e t h o d is based on the recovery of nuclear magnetization after saturation of the nuclear spin system of a substance containing a dilute amount of paramagnetic impurities which enhance nuclear relaxation in an N M R experiment. This is accomplished by applying a repetitive train of radio frequency pulses. The magnetization intensity, re(t), is related to t, the time delay used between pulses, by a simple power-law: rn(t) ~ t ~
[4]
Vol. 44, No. 5, 1996
Fractal dimensions of clays
Table 2. Some properties of the clays used in this study (van Olphen and Fripiat 1979).
Clay
Sl~E'r (m2 g-~)
CEC (meq/ 100 g)
Major cation
KGa-2 SHCa-1 STx-1
23.0 57.2 78.3
3.3 43.9 84.4
Na Ca
Fe203 (%) FeO (%)
0.98 0.02 0.65
0.15 0.25 0.15
% Organic matter?
0.90 0.26 0.64
Molecule
Formula
Nitrogen Methane n-butane
N2 CH 4
n-hexane
where: the value of the exponent ct is given by ct =
D/6 (Devreux et al. 1990). A log-log plot of m(t) versus t will be linear over a certain range of t values before reaching a saturation plateau. The value of D is calculated f r o m the slope of the linear portion of this plot. This technique was e m p l o y e d to determine the fractal dimension o f different forms o f silica (Table 1) doped with Cr as an N M R relaxing agent. The resolving p o w e r in the N M R method is the delay time, which is dependent upon and related to r, the distance of the nuclei in the lattice f r o m the impurity responsible for relaxation, by Equation 5 below: t ~ r6
Table 3. Physico-chemical properties of probe molecules (Braker and Mossman 1971). Cross sectional areas (or) are taken from McClellan and Harnsberger (1967).
n-pentane
t Determined by loss on ignition.
[5]
The purpose o f this w o r k was to compare and contrast the fractal dimensions of 3 natural reference clays measured by each o f these 3 techniques to determine whether a systematic difference exists b e t w e e n them. MATERIALS AND METHODS Materials The following reference clay materials were obtained from the Clay Minerals Society: a kaolinite (KGa-2), a hectorite (SHCa-1) and a Ca-montmorillonite (STx-1). These clays have been extensively characterized (van Olphen and Fripiat 1979) and some of their relevant properties are summarized in Table 2. These samples were used without further purification. The surface hydroxyl distributions of these minerals have been characterized in our laboratory by both 295i cross-polarization magic-angle spinning ( C P M A S ) and 1H M a g i c A n g l e Spinning ( M A S ) solid-state N M R (Malekani and R i c e 1995). Silicon-29 C P M A S N M R results showed that the kaolinite surface is dominated by geminal silanol groups [SiO2(OH)2] while surfaces of the hectorite and Ca-montmorillonite are dominated by single silanol [SiO3(OH)] groups. These clays have relatively low paramagnetic Fe contents, which is necessary for nuclear relaxation in the saturation r e c o v e r y N M R experiments (Table 2). Large amounts o f paramagnetic impurities greatly decrease relaxation times and m a k e their measurements v e r y difficult. All 3 clays have essentially no organic matter (Table 2) and therefore, any contribution to surface roughness by organic matter is considered to be negligible.
679
Canl0 C5H12 C6H14
Mol. wt. (g/mol)
% Purity
~r (~2)
28.013 16.043 58.124 72.150 86.177
99+ 99.5 99+ 99+ 99+
16.2 17.8 44.8 49.2 56.2
S A X S Determination The S A X S measurements were p e r f o r m e d on the Oak Ridge National Laboratory 10-m S A X S instr-ument (Wignall et al. 1990), with a sample-to-detector distance of 1.5 m using C u - K a radiation (h = 1.54 ]k) and a 20 x 20 c m 2 position-sensitive area detector with cells approximately 3 m m apart. The source was operated at a voltage of 40 k V and a current of 60 mA. The scattering intensity was stored in a 64 x 64 data array. Corrections were m a d e for instrument background and detector efficiency, via an 55Fe radioactive standard that emits ~/-rays isotropically, on a cell-by-cell basis. The data were radially averaged and converted to an absolute differential cross section by means of pre-calibrated secondary standards (Russell et al. 1988). The scattering data were fitted to a powerlaw (Equation 1) and D obtained as described earlier. Adsorption Determination The surface area measurements were p e r f o r m e d on a Micromeritics A S A P 2000 automatic surface area analyzer using the following probe molecules: nitrogen, methane, n-butane, n-pentane and n-hexane. S o m e physico-chemical properties of these adsorbates are given in Table 3. N-butane, n-pentane and n-hexane were purified by distillation before use. Nitrogen was adsorbed at - 1 9 6 ~ a liquid nitrogen bath, and methane at - 1 8 6 ~ a liquid argon bath. Adsorption of the other probe molecules was carried out in an ice bath (0 ~ A clay sample o f 0.3 to 0.5 g was outgassed under v a c u u m at 105 ~ for 6 to 8 h before measurement, To obtain the m o n o l a y e r capacity, the surface area was calculated using the linear Brunauer, E m m e t t and Teller (BET) plot of the adsorption isotherm at relative pressures (P/Po) o f 0.05 to 0.3 (Gregg and Sing 1982). The fractal dimension was obtained from the slope o f the log-log plot o f surface area, A, versus er as described earlier. N M R Determination Silicon-29 on a Bruker samples was of 5 kHz. A was used to
N M R spectra were obtained at 79.5 M H z A S X - 4 0 0 spectrometer. The M A S of the p e r f o r m e d in Z i O 2 rotors at a frequency train of 30 ~r/2 pulses of 3 Ixs duration saturate the sample. The free-induction
680
Malekani, Rice, and Lin
10000
3000
O000
looo,,,"9 ~ b lOOO
a
%
IO0
100
10
10
~ 10
1
1
1
0.1
0.1
0.1
0.01 0.01
' 0.1
........
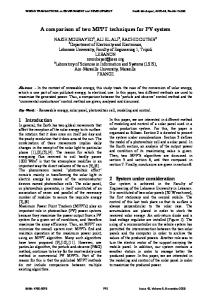
Figure 1.
'.
~
"% 1000
Clays and Clay Minerals
0.01 .
|
.....,I
|
1 q (rim -1)
|
~
.
.
.
.
ill
c1
100
iil,l
........
0,01
i
.......
I
........
i
....
..|..
10
0.01
0.1 1 q (nrn "1)
10
0.01
0.1
1
q (rim -1)
10
SAXS curves for the a) kaolinite (KGa-2); b) hectorite (SHCa-1); and c) Ca-montmorillonite (STx-1).
decay was measured after variable delay-time ranging from 100 ms to 3000 seconds. The value of D is obtained from the slope of log-log plots of re(t) versus t as previously described. Scanning Electron M i c r o s c o p y Scanning electron micrographs were obtained with a Super IIIA (International Scientific Instruments) scanning electron microscope. Samples were prepared by sprinkling the clay material on an A1 sample stub covered with double-sided tape, coated with a conducting A u - P d film and then viewed. X - R a y Diffraction X-ray diffraction (XRD) traces were obtained on a Siemens Analytical X-ray Instruments Inc. diffractometer equipped with a Philips vertical goniometer and graphite monochrometer. The X-ray tube was operated at a voltage of 40 kV and a current of 20 mA. Clay samples were m i x e d with glycol, smeared onto a Metricel VM-1 m e m b r a n e filter and v i e w e d as oriented mounts. RESULTS S A X S Determination The S A X S curves shown in Figures l a - l c illustrate the characteristic behavior of the materials investigated in this study. The plots obey a power-law over an intensity range of approximately 4 orders of magnitude and cover a range of scattering vectors more than an
order of magnitude. The power-law exponents shown in Table 4 all fall in the range 3 < ct < 4, indicating that all 3 clays used in this study are surface fractals. Kaolinite and hectorite are fractals over a length scale of 8 to 100 ,~ (Figures l a and lb) while Ca-montmorillonite (Figure lc) is fractal over a shorter range of 8 to 50 ,~. Kaolinte and Ca-montmorillonite exhibit D values (DsAxs) o f approximately 2.0, indicating a smooth, planar surface. The DsAxs for hectorite is indicative of an irregular and more space filling surface. The S A X S instrument does not " s e e " any roughness on the surface of kaolinite and Ca-montmorillonite. This is not unexpected since, as already pointed out, basal surfaces of clay minerals have long been recognized as smooth. This observation is consistent with the crystal structure of kaolinite and smectite-type clays. The surface irregularity of hectorite could be attributed to impurities within the sample. The hectorite X R D trace in Figure 2b, in addition to the characteristic hectorite peak at 11.2 A, exhibits peaks due to calcite, illite, chlorite and dolomite, with calcite apparently present in a large amount relative to the concentrations of the other impurities. These impurities could add more roughness to the surface of hectorite. The Ca-montmorillonite particles have minute impurities of opal-C (an amorphous crystobalite) that does not seem to affect its surface structure. The fractal dimension is therefore, closer to 2.0. Adsorption Determination The log-log plots of surface versus cross section tr are shown in Figure 3, while the corresponding cor-
Vol. 44, No. 5, 1996
Fractal dimensions of clays
681
r := 0
o~
..= q)
@
.'=_
0
= .~
~.--
,1
IL
._=
~
L~
-~
~
J=
ca
i.
.-.,
u
o)
! C)
E
_=
-
=
y
b
--
O
C '
J'
I
t0
.
.
.
.
I
'
'
20
'
'
I
'
30
'
'
'
I
'
'
'
40
2e Figure 2.
XRD of a) KGa-2; b) SHCa-1; and c) STx-1.
'
I 50
'
'
'
' 60
682
Malekani, Rice, and Lin
Clays and Clay Minerals
2
1.6
t~
N2
1.2
CH 4
C4H10
r~
o
C5H12
0.8
9
KGa-2
9
SHCa-1
9 STx-1 C6H14
0.4 1.2
1.1
1.3
1.4
1.5
1.6
1.7
1.8
log ~ (/~2) Figure 3.
Log-log BET surface area versus cross sectional area tr for a) KGa-2; b) SHCa-1; and c) STx-1.
relation coefficients of the best-fit lines are listed in Table 4. N2 and methane data points fell outside the linear portion of the power-law curve for all 3 materials studied. With the remaining points, all the data could be fitted to a straight line (r2 varies from - 0 . 9 4 7 to -0.998). This indicates that the power-law relationship does not extend down to --4 A, the approximate diameter for N2 and methane molecules. The fractal regime ranges from 6 to 9 ,~, which is very small compared to that of the SAXS method. However, this is typical of resolution scale ranges employed by the adsorption method, since the range is artificially limited by the range of adsorbate cross sectional areas
Table 4. Fractal dimensions of the kaolinite (KGa-2), hectorite (SHCa-1) and the Ca-montmorillonite (STx-1) obtained by each method~t. SAXS Sample
Power-law exponent
KGa-2 SHCa-1 STx-I
4.0 3.2 4.0
Adsorption DSAXS
2.0 2.8 2.0
NMR
(Avnir et al. 1984; Avnir 1986). The adsorption indicate a comparatively large fractal dimension for Ca-montmorillonite while those of kaolinite and hectorite are close to 2.0.
D(DADs) results
N M R Determination Figures 4 a - 4 c show log-log plots of 29Si magnetization saturation recovery of the clays characterized in this study. The D value calculated from the N M R experiments (DNMR) for kaolinite is 2.0 while that of hectorite is 2.3. The relaxation time, t, for STx-1 was so short that the magnetization-time plot levels off very early, making it impossible to determine DNMR from the slope. Collecting more data points with delay times