COAST COMMUNITY COLLEGE DISTRICT ORANGE COUNTY REPORT ON AUDIT OF FINANCIAL STATEMENTS AND SUPPLEMENTARY INFORMATION INCLUDING REPORTS ON COMPLIANCE June 30, 2017
COAST COMMUNITY COLLEGE DISTRICT TABLE OF CONTENTS June 30, 2017
INDEPENDENT AUDITOR’S REPORT MANAGEMENT'S DISCUSSION AND ANALYSIS................................................................ i BASIC FINANCIAL STATEMENTS .........................................................................................1 Statement of Net Position ............................................................................................................2 Statement of Revenues, Expenses and Changes in Net Position .................................................4 Statement of Cash Flows .............................................................................................................5 Statement of Fiduciary Net Position ............................................................................................7 Statement of Changes in Fiduciary Net Position .........................................................................8 Statement of Other Postemployment Benefits Plan Net Position ................................................9 Statement of Changes in Other Postemployment Benefits Plan Net Position ...........................10 NOTES TO THE FINANCIAL STATEMENTS ......................................................................11 REQUIRED SUPPLEMENTARY INFORMATION ..............................................................50 Schedule of Changes in the Net OPEB Liability and Related Ratios ........................................51 Schedule of Postemployment Healthcare Benefits Employer Contribution ..............................52 Schedule of Postemployment Healthcare Benefits Money-Weighted Rate of Return on Plan Assets ................................................................................................................53 Schedule of the District's Proportionate Share of the Net Pension Liability .............................54 Schedule of District Contributions – STRP and CalPERS ........................................................55 Notes to the Required Supplementary Information ...................................................................56 SUPPLEMENTARY INFORMATION .....................................................................................58 History and Organization ...........................................................................................................59 Schedule of Expenditures of Federal Awards ............................................................................60 Schedule of State Financial Assistance - Grants........................................................................62 Schedule of Workload Measures for State General Apportionment Annual (Actual) Attendance ...................................................................................................................63 Reconciliation of Annual Financial and Budget Report with Audited Financial Statements ..................................................................................................................................64 Reconciliation of 50 Percent Law Calculation ..........................................................................66 Proposition 55 Education Protection Account Expenditure Report ..........................................67 Schedule of Financial Trends and Analysis ...............................................................................68 Notes to the Supplementary Information ...................................................................................69
COAST COMMUNITY COLLEGE DISTRICT TABLE OF CONTENTS June 30, 2017 OTHER INDEPENDENT AUDITOR'S REPORTS ................................................................71 Independent Auditor's Report on Internal Control Over Financial Reporting and on Compliance and Other Matters Based on an Audit of Financial Statements Performed in Accordance with Government Auditing Standards .............................................72 Independent Auditor's Report on Compliance for Each Major Federal Program; and Report on Internal Control Over Compliance Required by the Uniform Guidance ....................................................................................................................................74 Independent Auditor's Report on State Compliance ..................................................................77 FINDINGS AND QUESTIONED COSTS ................................................................................79 Schedule of Findings and Questioned Costs – Summary of Auditor Results............................80 Schedule of Findings and Questioned Costs – Related to the Financial Statements ..................................................................................................................................81 Schedule of Findings and Questioned Costs – Related to Federal Awards ...............................84 Schedule of Findings and Questioned Costs – Related to State Awards ...................................85 Status of Prior Year Findings and Questioned Costs .................................................................86 CONTINUING DISCLOSURE INFORMATION ...................................................................93 2015-16 Largest Local Secured Taxpayers (Unaudited) ...........................................................94 Schedule of Budgetary Comparison for the General Fund ........................................................95
INDEPENDENT AUDITOR’S REPORT The Board of Trustees Coast Community College District Costa Mesa, California Report on the Financial Statements We have audited the accompanying financial statements of the Coast Community College District (the District) as of and for the year ended June 30, 2017, and the related notes to the financial statements as listed in the table of contents. Management’s Responsibility for the Financial Statements Management is responsible for the preparation and fair presentation of these financial statements in accordance with accounting principles generally accepted in the United States of America; this includes the design, implementation, and maintenance of internal control relevant to the preparation and fair presentation of financial statements that are free from material misstatement, whether due to fraud or error. Auditor’s Responsibility Our responsibility is to express an opinion on these financial statements based on our audit. We conducted our audit in accordance with auditing standards generally accepted in the United States of America and the standards applicable to financial audits contained in Government Auditing Standards, issued by the Comptroller General of the United States. Those standards require that we plan and perform the audit to obtain reasonable assurance about whether the financial statements are free of material misstatement. An audit involves performing procedures to obtain evidence about the amounts and disclosures in the financial statements. The procedures selected depend on the auditor’s judgment, including the assessment of the risks of material misstatement of the financial statements, whether due to fraud or error. In making those risk assessments, we consider internal control relevant to the entity’s preparation and fair presentation of the financial statements in order to design audit procedures that are appropriate in the circumstances, but not for the purpose of expressing an opinion on the effectiveness of the entity’s internal control. Accordingly, we express no such opinion. An audit also includes evaluating the appropriateness of accounting policies used and the reasonableness of significant accounting estimates made by management, as well as evaluating the overall presentation of the financial statements.
INDEPENDENT AUDITOR’S REPORT The Board of Trustees Coast Community College District Costa Mesa, California We believe that the audit evidence we have obtained is sufficient and appropriate to provide a basis for our audit opinion. Opinion In our opinion, the financial statements listed in the aforementioned table of contents present fairly, in all material respects, the financial position of the District as of June 30, 2017, and the results of its operations, changes in net position and cash flows for the year then ended in accordance with accounting principles generally accepted in the United States of America. Emphasis of a Matter During fiscal year ended June 30, 2017, the District adopted the provisions of Governmental Accounting Standards Board Statement (GASB) No. 74 Financial Reporting for Postemployment Benefit Plans Other Than Pensions Plans, No. 75 Accounting and Financial Reporting for Postemployment Benefits Other than Pensions. As a result of the implementation of these standards, the District reported a restatement for the change in accounting principle (see Note 16). Our auditors’ opinion was not modified with respect to the restatement. Other Matters Required Supplementary Information Accounting principles generally accepted in the United States of America require that management’s discussion and analysis and the required supplementary information schedules as listed in the aforementioned table of contents be presented to supplement the basic financial statements. Such information, although not a part of the basic financial statements, is required by the Governmental Accounting Standards Board, who considers it to be an essential part of financial reporting for placing the basic financial statements in an appropriate operational, economic, or historical context. We have applied certain limited procedures to the required supplementary information in accordance with auditing standards generally accepted in the United States of America, which consisted of inquiries of management about the methods of preparing the information and comparing the information for consistency with management’s responses to our inquiries, the basic financial statements, and other knowledge we obtained during our audit of the basic financial statements. We do not express an opinion or provide any assurance on the information because the limited procedures do not provide us with sufficient evidence to express an opinion or provide any assurance. Other Information Our audit was conducted for the purpose of forming an opinion on the District’s financial statements as a whole. The supplementary schedules, and the continuing disclosure information
INDEPENDENT AUDITOR’S REPORT The Board of Trustees Coast Community College District Costa Mesa, California are presented for purposes of additional analysis and are not a required part of the basic financial statements. The schedule of expenditures of federal awards is presented for purposes of additional analysis as required by Title 2 U.S. Code of Federal Regulations Part 200, Uniform Administrative Requirements, Cost Principles, and Audit Requirements for Federal Awards (Uniform Guidance), and is also not a required part of the basic financial statements. The supplementary section, including the schedule of expenditures of federal awards, is the responsibility of management and was derived from and relates directly to the underlying accounting and other records used to prepare the basic financial statements. Such information has been subjected to the auditing procedures applied in the audit of the basic financial statements and certain additional procedures, including comparing and reconciling such information directly to the underlying accounting and other records used to prepare the basic financial statements or to the basic financial statements themselves, and other additional procedures in accordance with auditing standards generally accepted in the United States of America. In our opinion, the supplementary section, including the schedule of expenditures of federal awards, is fairly stated in all material respects in relation to the basic financial statements as a whole. The continuing disclosure information has not been subjected to the auditing procedures applied in the audit of the basic financial statements and, accordingly, we do not express an opinion or provide any assurance on it. Other Reporting Required by Government Auditing Standards In accordance with Government Auditing Standards, we have also issued our report dated November 30, 2017 on our consideration of the District's internal control over financial reporting and on our tests of its compliance with certain provisions of laws, regulations, contracts and grant agreements and other matters. The purpose of that report is solely to describe the scope of our testing of internal control over financial reporting and compliance and the results of that testing, and not to provide an opinion on the effectiveness of the District’s internal control over financial reporting or on compliance. That report is an integral part of an audit performed in accordance with Government Auditing Standards in considering the District’s internal control over financial reporting and compliance.
CliftonLarsonAllen LLP Glendora, California November 30, 2017
COAST COMMUNITY COLLEGE DISTRICT MANAGEMENT’S DISCUSSION AND ANALYSIS Fiscal Year Ending June 30, 2017 INTRODUCTION The following discussion and analysis provides an overview of the financial position and activities of the Coast Community College District (the “District”) for the year ended June 30, 2017. This discussion has been prepared by management, and should be read in conjunction with the financial statements and notes thereto which follow this section. The District is reporting according to the standards of Governmental Accounting Standards Board Statements (GASB) No. 34 and 35 using the Business Type Activity (BTA) model. The California Community College Chancellor’s Office, through its Fiscal Accountability Standards Committee, recommended that all community college districts use the reporting standards under the BTA model. The District includes three comprehensive community colleges. The mission of the District is to respond to the educational needs of an ever-changing community and to provide programs and services that reflect academic excellence. The District’s three colleges promote open access and celebrate the diversity of its students and staff, as well as the community. Coastline Community College, Golden West College, and Orange Coast College offer associate degrees, vocational certificates and transfer education, as well as developmental instruction and a broad array of specialized training. Specific activities in the colleges and the continuing education programs are directed toward economic development within the community. The annual report includes three basic financial statements that provide information on the District as a whole:
The Statement of Net Position The Statement of Revenues, Expenses, and Changes in Net Position The Statement of Cash Flows
Each of these statements will be reviewed and significant events discussed. The previous year’s financial information is also provided for comparison. Financial and Enrollment Highlights Although the District ended the year with a strong fund balance, it represented an approximate $7million-dollar decline from the previous year. The ability to maintain a prudent reserve has continued to provide cash flow stability for the District without external borrowing. Health and welfare benefit costs continue to rise and are being monitored. Additional funds were set aside to fund the future retiree benefits liability. While Coast was a founding member of the CCLC retiree health benefit trust, based on a recommendation from the Retirement Board, the Board of Trustees took action to bifurcate the retiree health benefit trust between Keenan and the CCLC programs. At June 30, 2017, between the two programs, $71.6 million is held in an irrevocable trust to meet i
COAST COMMUNITY COLLEGE DISTRICT MANAGEMENT’S DISCUSSION AND ANALYSIS Fiscal Year Ending June 30, 2017 the District’s liability of approximately $103.2 million Although the new Governmental Accounting Standards Board (GASB) requirements no longer use the Annual Required Contribution (ARC) as a measure, this in no way changes the District’s contractual obligations and we will continue to budget both pay-as-you-go costs as well as an amount to mitigate the unfunded liability in the next 15-20 years. The District runs the Banner financial software which is integrated with the human resources and student systems. The District uses the position budgeting feature to build the budgets and allows on-line budget transfers for faster, more accurate processing. The Banner financial software is also used for the student system. The student financials feed into the Banner financial system which uses an accrual method of accounting. The District is moving forward implementing Financial Aid management and reporting into the Banner system. In November 2002, the District’s citizens passed Measure C, a general obligation bond for facilities. Measure C was fully expended and closed out as of June 30, 2013. On November 6, 2012, the District voters approved and authorized the issuance and sale of $698 million principal amount of Measure M general obligation bonds of the District. During the fiscal year ending June 30, 2017, three series of Measure M bonds were issued including 2016C in the amount of $30 million, 2017D in the amount of $280 million, and 2017E in the amount of $20 million. Because of the magnitude of the proposed 2017D & E issuances, early in calendar year 2017, Coast sought a bond rating review from Moody’s and Standard & Poor’s (S&P). Moody’s maintained an “Aa1” rating reflecting the District's very large and growing coastal California tax base that is among the largest of Moody’s-rated community college districts. The rating also includes the district’s strong financial position that benefits from healthy liquidity available outside of General Fund operations. S&P Global Ratings raised its long-term rating and underlying rating (SPUR) to 'AA+' from ‘AA.” This action reflected the district's strong local economy situated in Orange County, the district's very strong general fund reserves, the flexibility of community college districts in general to manage their enrollment and programs in response to funding levels, and the district's low to moderate debt burden.
ii
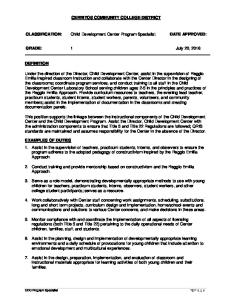
COAST COMMUNITY COLLEGE DISTRICT MANAGEMENT’S DISCUSSION AND ANALYSIS Fiscal Year Ending June 30, 2017 The 2016-17 FY Adopted Budget was based on the revenue associated with serving 32,623 resident Full-Time Equivalent Students (FTES). However, at the P-1 Enrollment report in January 2017, earnings were nearly 2,000 FTES below base. This softening in enrollment continued through P-2 in April when enrollments were reported more than 2,200 FTES below base, and again with the annual enrollment report in July when enrollment was reported more than 2,300, or 7.15%, below base. The District reported actual FTES earnings for this year, triggering Stabilization but ensuring base revenue would be received for the 2016-17 FY. The District is on track to report at least base FTES at the close of the 2017-18 FY. The chart below reflects actual earned FTE’s for each year, irrespective of Borrowing or Stabilization. Annual Enrollment Full-Time Equivalent Students (FTES) 35,000 30,000
32,370
32,335
30,679
29,862
29,983
25,000 20,000 15,000 10,000 5,000 241
250
245
289
309
‐ 2012‐13
2013‐14
2014‐15 Credit
Noncredit
iii
2015‐16
2016‐17
COAST COMMUNITY COLLEGE DISTRICT MANAGEMENT’S DISCUSSION AND ANALYSIS Fiscal Year Ending June 30, 2017 Statement of Net Position The Statement of Net Position includes all assets and liabilities using the accrual basis of accounting, which is similar to the accounting used by most private-sector institutions. Net position, the difference between total assets and deferred outflows of resources, and total liabilities and deferred inflows of resources, are one way to measure the financial health of the District. (in thousands) 2017
2016
Change
ASSETS
Current assets Cash and cash equivalents Investments Account receivables Notes receivable - current portion Inventories Prepaid expenses Total current assets
$
121,365 12,363
-9% 253%
19,968 750 59 39 175,294
21,196 750 57 649 156,380
-6% 0% 4% -94% 12%
416,823 2,654 12,188
127,555 2,851 12,937
227% -7% -6%
512,117
18,454 459,625
-100% 11%
943,782
621,422
52%
1,119,076
777,802
44%
26,623 51,304 77,927
28,645 25,053 53,698
105% 45%
Current liabilities Non-current liabilities
82,573 1,149,937
85,603 741,871
-4% 55%
TOTAL LIABILITIES
1,232,510
827,474
49%
Non-current assets Restricted cash and cash equivalents Restricted student loans receivable, net Notes receivable Other post-employment benefit asset Capital assets, net of depreciation Total non-current assets TOTAL ASSETS
110,840 43,638
$
DEFERRED OUTFLOW OF RESOURCES
Deferred charge on refunding Deferred outflows - pension TOTAL DEFERRED OUTFLOWS OF RESOURCES
-7%
LIABILITIES
DEFERRED INFLOWS OF RESOURCES
Deferred inflows - pension TOTAL DEFERRED OUTFLOWS OF RESOURCES
12,282
19,020
-35%
12,282
19,020
-35%
46,243
33,735
37%
45,675 (139,707)
39,578 (88,307)
15% 58%
(14,994)
-219%
NET POSITION
Invested in capital assets, net of related debt Restricted Unrestricted $
TOTAL NET POSITION
iv
(47,789)
$
COAST COMMUNITY COLLEGE DISTRICT MANAGEMENT’S DISCUSSION AND ANALYSIS Fiscal Year Ending June 30, 2017
Cash and cash equivalents consist mainly of cash held in the county treasury ($507.7 million) and ancillary funds maintained at local banks. Cash increased from the prior year due primarily to the issuance of three Measure M bond series: (1) 2016C in the amount of $30 million, (2) 2017D in the amount of $280 million and, (3) 2017E in the amount of $20 million. At June 30, 2017, the building fund had a cash balance of approximately $369 million.
Accounts Receivable decreased due to a receipt of $1.6 million receivable of a one-time construction settlement.
In the current fiscal year, Governmental Accounting Standards Board (GASB) statements 74 and 75 were implemented. As a result of this implementation, the Other PostEmployment Benefits (OPEB) changed from an asset balance to a recognition of $31.5 million in liability. The District has a funding plan to mitigate the unfunded actuarial accrued liability in the next 15 to 20 years.
The total assets showed an increase of, mostly due to the issuance of three Measure M bonds in the amount of $330 million and the establishment of the Pension Trust $2.5 million. The total liabilities showed an increase of 49%. This is due to the recording of the new GO Bond payables, OPEB and pension liabilities.
Governmental Accounting Standards Board (GASB) statements 67 and 68 established a definition of a pension plan that reflects the primary activities associated with the pension arrangement, determining pensions, accumulating and managing assets dedicated for pensions, and paying benefits to plan members. The District's outstanding pension liability for both STRS and PERS is $209.7 million as of FY 2016-17.
Net position showed it decreased by 219% from the prior year. Total operating expenses increased by $12 million, or 4%, while total operating revenues increased by $8.3 million or 5%.
The net Other post-employment benefits (OPEB) liability decreased from $116 million at the close of the 2015-16 FY, to $103 million at the close of the 2016-17 FY. This change was driven largely by changes in the retirement program for new hires hired on or after January 1, 2018, and the introduction of a new health plan for post-age 70 retirees.
v
COAST COMMUNITY COLLEGE DISTRICT MANAGEMENT’S DISCUSSION AND ANALYSIS Fiscal Year Ending June 30, 2017
Net Assets June 30, 2017 100% 50% 0% ‐50%
Invested in Capital Properties
Unrestricted
‐100%
vi
Restricted
COAST COMMUNITY COLLEGE DISTRICT MANAGEMENT’S DISCUSSION AND ANALYSIS Fiscal Year Ending June 30, 2017 Statement of Revenues, Expenses and Changes in Net Position The Statement of Revenues, Expenses, and Changes in Net Position presents the operating results of the District, as well as the non-operating revenues and expenses. State general apportionment, while budgeted for operations, is considered non-operating revenues by generally accepted accounting principles. (in thousands) 2017
2016
$ 38,262 119,240 3,527
$ 32,448 117,006 3,248
161,029
152,702
9% 5%
223,535
210,385
6%
41,278 56,592
42,495 60,167
-3% -6%
3,572 21,745
3,954 17,609
-10% 23%
346,722
334,610
4%
(185,693)
(181,908)
2%
40,108 120,884
48,510 114,654
-17% 5%
11,281
25,801
-56%
619 (13,093)
505 (17,951) (10)
23% -27%
159,799
171,509
Other revenues, expenses, gains or losses State apportionments, capital Local property taxes and revenues, capital Investment income, capital Total other revenues, expenses, gains or losses
1,229 40,648 3,024 44,901
3,728 38,132 1,220 43,080
148% 4%
Change in net position
19,007
32,681
-42%
(14,994) (51,802) $ (47,789)
(47,675)
-69% 100%
$ (14,994)
-219%
Operating Revenues Net tuition and fees Grants and contracts, non-capital Auxiliary sales and charges Total operating revenues Operating Expenses Salaries and benefits Supplies, materials and other operating expenses and services Financial aid Utilities Depreciation Total operating expenses Operating loss Non-operating revenues (expenses) State apportionments, non-capital Local property taxes State taxes and other revenues Investment income, non-capital Interest expense Loss on disposal of capital assets Total non-operating revenues (expenses)
Net position, beginning of year Cumulative effect of change in accounting principles Net position, end of year
vii
Change 18% 2%
0% -7%
0% 7%
COAST COMMUNITY COLLEGE DISTRICT MANAGEMENT’S DISCUSSION AND ANALYSIS Fiscal Year Ending June 30, 2017
Net tuition and fees consists of enrollment fees ($41.5 million), non-resident tuition ($12.0 million), and other fees ($6.6 million) less scholarships, discounts and allowances ($21.9 million). Regular enrollment fees ($46 per unit) are set by the State for all community colleges reflecting no change from the prior year.
Revenue from grants and contracts is composed of federal grants ($52.2 million), state grants ($41 million), and local contracts ($25.9 million). The increase in federal funding is due mainly to the increase in federal financial aid provided for students and is also reflected in the increased financial aid operating expenses. The increase in state revenue is primarily due to increased allocations in various student success and support programs.
The annual 320 enrollment report for 2016-17 reflected 30,292.35 resident Full Time Equivalent Students (FTES), or approximately 7.15% below our base FTES of 32,623.80. Apportionment based revenue for the 2016-17 FY was uninterrupted as the District received Stabilization funding for the difference of 2,331.45 FTES between the actual reported FTES and base. The District has continued its efforts geared toward maximizing enrollment and service to students and the community, and Coast will report at least based FTES for the year ending June 30, 2018.
Depreciation expenses increased due to the construction in progress and projects completed in this fiscal year.
Salaries and benefits expenses increased $8.2 million or 6% due mainly to hiring of 25 new full-time faculty, implementation of the classification and compensation study, and the increasing pension and health benefit cost.
Robust property tax receipt, along with the EPA funding, has resulted in a smaller proportion of state apportionment in our total computational apportionment revenue. SB 361 states that for each district the State shall subtract from the computed revenue apportionment a district's local property tax revenue and 98% of the enrollment fees collected by the district.
viii
COAST COMMUNITY COLLEGE DISTRICT MANAGEMENT’S DISCUSSION AND ANALYSIS Fiscal Year Ending June 30, 2017
Revenues As of June 30, 2017 Grants & Contracts, noncapital 31%
Other Revenue 5%
Local Property Taxes 32% Tuition & Fees 10% Capital Revenue 11%
State Apportionment, noncapital 11%
Expenses As of June 30, 2017 Interest Expense 4%
Supplies, Material, & Other Operating Expenses 12%
Financial Aid 16%
Depreciation 6%
Salaries & Benefits 62%
ix
COAST COMMUNITY COLLEGE DISTRICT MANAGEMENT’S DISCUSSION AND ANALYSIS Fiscal Year Ending June 30, 2017 Statement of Cash Flows The Statement of Cash Flows provides information about cash receipts and cash payments during the fiscal year. This statement also helps users assess the District’s ability to generate net cash flows, its ability to meet its obligations as they come due, and its need for external financing. (in thousands) 2017 2016
Change
Cash Provided By (Used in) Operating activities Noncapital financing activities Capital and related financing activities Investing activities Net change in cash and cash equivalents
$
Cash balance, beginning of year Cash balance, end of year
$
(167,623) 174,605 273,643 (1,881)
$
(156,378) 187,812 (43,035) (1,675)
-7% -7% 736% 12% -2200%
278,744
(13,276)
248,919
262,195
-5%
248,919
112%
527,663
$
The primary cash receipts from operating activities consist of grants, contracts, tuition and fees; while, the outlays include payment of wages, benefits, supplies, services, contracts, scholarships and financial aid.
General apportionment is the main source of noncapital financing activities and consists of state apportionment, local property taxes, and student fees.
Cash provided by and used for capital and related financing activities reflects local capital outlay resources.
Cash from investing activities is interest and gains on investments.
The overall cash balance has increased from prior year because of the proceeds received from the new bonds issuance, base augmentation, one-time mandate reimbursement funding,
x
COAST COMMUNITY COLLEGE DISTRICT MANAGEMENT’S DISCUSSION AND ANALYSIS Fiscal Year Ending June 30, 2017 District’s Fiduciary Responsibility The District is the trustee, or fiduciary, for certain amounts held on behalf of students, clubs and donors for student loans and scholarships. The District’s fiduciary activities are reported in separate Statements of Fiduciary Net Position and Changes in Fiduciary Net Position. These activities are excluded from the District’s other financial statements because the District cannot use these assets to finance operations. The District is responsible for ensuring that the assets reported in these funds are used for their intended purposes. Capital Asset and Debt Administration Capital Assets As of June 30, 2017, the District had over $512 million invested in net capital assets. Total capital assets of $823 million consist of land, buildings and building improvements, vehicles, data processing equipment and other office equipment; these assets have accumulated depreciation of $311 million. New additions for construction and equipment of $61.0 million occurred during 2016-17, and depreciation expense of $21.7 million was recorded for the fiscal year. Construction in progress of $16.7 million was completed and placed into service as buildings and site improvements. Note 5 to the financial statements provides additional information on capital assets. A summary of capital assets net of depreciation is presented below. Balance June 30, 2017 Land Buildings and site improvements Equipment Construction in progress
$ 24,141,969 677,747,797 46,659,314 74,807,149
Totals at historical cost
823,356,229
Less accumulated depreciation for: Buildings and site improvements Equipment Total accumulated depreciation
(276,032,252) (35,206,715) (311,238,967)
Governmental capital assets, net
$ 512,117,262
xi
COAST COMMUNITY COLLEGE DISTRICT MANAGEMENT’S DISCUSSION AND ANALYSIS Fiscal Year Ending June 30, 2017 Debt At June 30, 2017, the District had $923.8 million in debt for the General Obligation bonds. The payments for general obligation bond debt are funded through property tax assessments. Notes 6 and 9 to the financial statements provide additional information on long-term liabilities. Economic Factors That May Affect the Future State Economy On January 10, 2017, the Governor released his budget proposal for the 2017-18 fiscal year. In three of the past four years, actual revenue collections exceeded the Administration’s forecasts by a substantial amount. However, even after the state lowered its revenue forecast for 2016-17, revenues are coming in below even the lowered estimates. As a result, the Governor has lowered revenue projections even more substantially. The theme for the Budget proposal is a broad recognition of the increased risk in the out years. The Governor referred to the fact that California has the most progressive tax structure and, therefore, the most unreliable revenues, in the nation. California’s heavy reliance on the Personal Income Tax (PIT), and in particular the top 1% of taxpayers, gives us tremendous revenue volatility, both up and down. For California Community Colleges (CCCs), the Budget Proposal provides approximately $400 million in additional funding. When netted against unabsorbed growth funding and increasing property taxes across the system, the proposed augmentations actually result in a decrease of $27.1 million in general state apportionments. No one-time discretionary funds are proposed. In the past, these resources have been counted toward paying down outstanding state mandate claims. The Governor’s 2017-18 State Budget proposal provides a 10.87% share of Proposition 98 funding, lower than the traditional 10.93%. The CCCs would be receiving about $45 million more if the system were funded at the 10.93% level. However, it is important to recognize that community college apportionments are not threatened with a deferral like K-12 district apportionments. The May Revision presents the last statutory opportunity for the Governor to shape his economic proposal before legislative budget committees complete their work and move into Conference committee. The May Revise was released on May 11, 2017, and during the release, the Governor took the opportunity to emphasize his theme of fiscal prudence. It presents a moderately more optimistic picture than did the January Proposal. The assumptions underpinning the May Revise reflect economic insecurity based on a mild drop in state revenue coupled with uncertainty at the federal level.
xii
COAST COMMUNITY COLLEGE DISTRICT MANAGEMENT’S DISCUSSION AND ANALYSIS Fiscal Year Ending June 30, 2017 On June 27, 2017, the 2017-18 FY State Budget Bill was signed into law by Governor Brown. It includes a total investment in Proposition 98 of $74.5 billion, an increase of $2.6 billion over last year’s Budget Act level. Some of the new features of the California Community College (CCC) budget include $150 million in one-time funding for community colleges to develop and implement “Guided Pathway” Programs, $25 million for a new CCC Completion Grant Program to provide grants of up to $2,000 to community college students who meet specified criteria, $10 million to provide all colleges with access to the Online Education Initiative’s learning management system, and an increase of $6 million in one-time funding to facilitate the development of an integrated library system for the community colleges. The 2017-18 FY CCCD Budget
Estimated State Revenue reflected a 1.56% COLA, no growth and a $141 per FTES Unrestricted Lottery Revenue allocation. Available Statewide Growth/Access funding is identified at 1.0% but the District does not budget these funds until the year following the one in which they were earned.
Statewide Categorical program funding for the 2017-18 FY stands at nearly $978.9 million, providing a significant increase in programmatic funding. The total categorical funding for Coast is nearly $52.7 million.
For the 2017-18 FY, following Board Policy 6200, the Adopted Budget reflects a General Reserve of 5% and a Reserve for Contingency of 5%, for a total of $21.5 million, or 10% of the prior year unrestricted general fund expense.
Salaries and benefits continue to comprise the largest portion of the District’s expenses. Historically, Coast’s budgeting norms do not include estimates of part-time faculty, overload, or short-term employees. When looking only at contract positions for 2017-18, 73.2% of the unrestricted funds are budgeted for salaries and benefits.
Volatility continues in our Health and welfare benefit programs. The budget for benefits in the 2017-18 FY is $17,900 Per Employee Per Year (PEPY) as compared with prior year actual of $15,706 PEPY.
The employer contributions for the PERS will increase from 13.89% to 15.531% of payroll, or 1.641% increase. The STRS employer rate will increase by 1.85%, from 12.58% to 14.43%. These increases in pension contributions commenced with the fiscal year beginning July 1, 2017. For the current fiscal year, the combined increase of these pension system match requirements are estimated at $2.5million.
xiii
COAST COMMUNITY COLLEGE DISTRICT MANAGEMENT’S DISCUSSION AND ANALYSIS Fiscal Year Ending June 30, 2017 Significant Future Events California continues to rely heavily on the Personal Income Tax (PIT) for education funding creating a significant degree of funding volatility. Further, the current economic recovery is among the longest in the post-war period and history suggests the state is ripe for a downturn. Adding to budgetary uncertainty are events at the federal level. While offering no specifics, the Governor noted that if the American Health Care Act (“Trumpcare”), or a similar bill were to become law, it would cost California billions of dollars. Staff will continue tracking events at the federal level in an effort to better understand the potential impact to California and local college districts. Although budgetary modeling does not indicate the District will grow, the 2017-18 Advance Principal Apportionment Report reflects a growth cap of 1.17% for the District. System-wide, Growth (Access) is funded at 1.0% for the 2017-18 FY. Not unlike the District’s retiree health benefit plan, both the California State Teachers Retirement System (STRS) and the California Public Employee Retirement System (PERS) have significant unfunded liabilities. This phenomenon reflects a mismatch between the pension plan’s estimated obligations and its assets. In theory, these plans should be prefunded, meaning regular contributions for each employee are made into the retirement fund during the course of that employee’s career. However, because of underfunding in prior years, employer costs for retirement benefits for both STRS and PERS are projected to nearly double over the next several years. Projections for Coast is at an additional $16.9 million in on-going costs by 2020-21 FY. The most recent actuarial study was completed for OPEB liability as of June 30, 2017. The District has budgeted sufficient funds to meet the annual required contribution for fiscal year 2017-18. The Governmental Accounting Standards Board (GASB). Statement No. 67, Financial Reporting for Pension Plans and Statement No. 68, Accounting and Financial Reporting for Pensions—an amendment of Statement No. 27, establish a definition of a pension plan that reflects the primary activities associated with the pension arrangement - determining pensions, accumulating and managing assets dedicated for pensions, and paying benefits to plan members. Districts’ financial reports must begin to show the full effect of pension liabilities. The PERS program involves an employer and an employee contribution. In contrast, the STRS program includes both an employer and an employee contribution, along with a state contribution. In practice, most Local Education Agencies (LEA’s) did not recognize the states “on-behalf” contributions to CalSTRS, primarily based on 1996 guidance from the California Department of Education. More recently, GASB 68 now requires districts to recognize the “on-behalf” contribution by the state by debiting pension contribution expenditures and crediting revenues. For Coast, this amount is estimated at $3.9 million.
xiv
COAST COMMUNITY COLLEGE DISTRICT MANAGEMENT’S DISCUSSION AND ANALYSIS Fiscal Year Ending June 30, 2017 Looking ahead to the 2018-19 FY, tax reform at the federal level is a definite wild card. No one knows the final result, but by January we should have a much better read. California’s high dependency on affluent taxpayers could be dramatically affected by federal tax reform and resultant changes in economic activity. Further, recasting the minimum guarantee under Proposition 98 would likely provide opportunities for Governor Brown to put the finishing touches on his vision of reshaping California’s education systems to both reduce the achievement gap and provide a greater measure of social justice. In conclusion, the 2018-19 FY Budget will be the final chapter in Governor Brown’s life-long commitment to California. Contacting the District’s Financial Management This financial report is designed to provide our citizens, taxpayers, students, and investors and creditors with a general overview of the District's finances and to show the District's accountability for the money it receives. If you have questions about this report or need any additional financial information, contact the Office of Fiscal Affairs at Coast Community College District, 1370 Adams Avenue, Costa Mesa, California 92626, or e-mail Daniela Thompson at
[email protected].
xv
BASIC FINANCIAL STATEMENTS
-1-
COAST COMMUNITY COLLEGE DISTRICT STATEMENT OF NET POSITION June 30, 2017
Primary Government Assets Current assets: Cash and cash equivalents Investments Accounts receivable, net Deferred tax asset Pledges receivable, net Beneficial interest in charitable gift annuity Inventories Notes receivable- current portion Prepaid expenses and other current assets Total Current Assets
$
110,840,112 43,638,008 19,967,951
Non-Current Assets: Restricted cash and cash equivalents Restricted student loans receivable, net Contribution receivable from split-interest agreements Notes receivable Capital assets, net of accumulated depreciation Total Non-Current Assets
Component Units
$
5,846,862 27,772,642 132,176 21,800 271,550 7,209
59,803 750,000 39,371
75,707
175,295,245
34,127,946
416,823,033 2,653,878
Total Assets
12,187,500 512,117,262
479,361 41,481 8,006,444
943,781,673
8,527,286
1,119,076,918
42,655,232
26,623,438 51,303,554 77,926,992
-
Deferred Outflows of Resources Deferred charge on refunding Deferred outflows- pension Total Deferred Outflows of Resources
$ 1,197,003,910
Total Assets and Deferred Outflows of Resources
See accompanying notes to the financial statements.
-2-
$
42,655,232
COAST COMMUNITY COLLEGE DISTRICT STATEMENT OF NET POSITION June 30, 2017 Primary Government Liabilities Current Liabilities: Accounts payable Accrued liabilities Unearned revenue Amounts held in trust Long-term liabilities-current portion Current Liabilities
$
21,841,525 9,320,240 25,511,272 232,305 25,667,938
Component Units
$
82,573,280
Non-Current Liabilities Compensated absences Notes payable Postemployment healthcare liabilities Net pension liabilities General obligation bonds payable
505,924 8,390 736,629
1,250,943
6,043,567 3,285,000 31,549,563 209,753,325 899,305,723
Non-Current Liabilities
1,149,937,178
Total Liabilities
1,232,510,458
1,250,943
Deferred Inflows of Resources Deferred inflows- pension
12,282,042
Total Deferred Inflows of Resources
12,282,042
Net Position Net investment in capital assets Permanently restricted Temporarily restricted Restricted for: Capital projects Debt service Scholarship and loans Unrestricted Common stock Retained earnings Total Net Position
-
46,243,259 7,517,979 30,931,374 30,551,535 12,253,300 2,869,828 (139,706,512)
2,377,811 158 576,967 41,404,289
(47,788,590)
Total Liabilities, Deferred Inflows of Resources and Net Position
$ 1,197,003,910
See accompanying notes to the financial statements.
-3-
$
42,655,232
COAST COMMUNITY COLLEGE DISTRICT STATEMENT OF REVENUES, EXPENSES AND CHANGES IN NET POSITION For the Fiscal Year Ended June 30, 2017
Primary Government Operating Revenues Tuition and fees (gross) Less: Scholarship discounts and allowances Net tuition and fees Grants and contracts, non-capital: Federal State Local Sales
$
Component Units
60,232,611 $ (21,971,189) 38,261,422 52,234,278 41,021,073 25,984,695 3,526,830
-
17,956,601
Total Operating Revenues
161,028,298
17,956,601
Operating Expenses Salaries Employee benefits Supplies, materials, and other operating expenses and services Financial aid Utilities Depreciation
154,282,143 69,252,887 41,277,656 56,592,053 3,571,650 21,745,349
1,513,111 346,544 10,320,206
Total Operating Expenses
346,721,738
14,037,293
Operating Income (Loss)
(185,693,440)
3,919,308
Non-Operating Revenues (Expenses) State apportionments, non-capital Local property taxes States taxes and other revenue Interest and investment income, non-capital Interest expense
40,107,985 120,884,154 11,280,936 619,161 (13,093,169)
Total Non-Operating Revenues (Expenses)
159,799,067
1,579,038
(Loss) Income/Gain Before Other Revenues, Expenses, Gains and Losses
(25,894,373)
5,498,346
Other Revenues, Expenses, Gains and Losses Local property taxes and revenues, capital State apportionments, capital Interest and investment income, capital Total Other Revenues, Expenses, Gains and Losses
40,647,991 1,229,156 3,024,319 44,901,466
-
Changes in Net Position
19,007,093
5,498,346
Net Position, Beginning of Year Cumulative effect of change in accounting principles (see Note 16)
(14,994,040) (51,801,643)
35,905,943 -
Net Position, Beginning of Year After Restatement
(66,795,683)
35,905,943
(47,788,590) $
41,404,289
$
Net Position, End of Year
See accompanying notes to the financial statements.
-4-
1,857,432
4,900 1,574,138
COAST COMMUNITY COLLEGE DISTRICT STATEMENT OF CASH FLOWS For the Fiscal Year Ended June 30, 2017 Primary Government Cash Flows From Operating Activities Tuition and fees Federal grants and contracts State grants and contracts Local grants and contracts Sales Auxiliary enterprise sales and charges Administrative fees and interest Donations VLFAA Settlement Payments to suppliers Payments to/on-behalf of employees Payments to/on-behalf of students Other (payments) receipts
$
Component Units
36,747,757 $ 51,105,985 42,543,791 24,583,080 3,526,830 5,998,732 1,867,144 4,757,673 (9,739,052) (34,979,259) (222,775,170) (56,926,563) (1,710,069) (167,622,670)
Net cash provided (used) by operating activities Cash Flows From Non-Capital Financing Activities State apportionments and receipts Property taxes State tax and other revenues Principal collections on loans receivable Principal collections on notes receivable
41,054,681 120,884,154 11,719,073 196,953 750,000 174,604,861
Net cash provided (used) by non-capital financing activities Cash Flows From Capital and Related Financing Activities Interest on capital investments Property taxes for capital purposes Local revenue, grants and gifts for capital purposes Net purchase and sale of capital assets Proceeds from long-term debt Purchase investments from proceeds from long-term debt Principal paid on long-term debt Interest paid on long-term debt
1,521,563 40,647,991 4,253,475 (64,434,333) 360,306,946 (28,775,156) (23,351,814) (16,526,345) 273,642,327
Net cash provided (used) by capital and financing activities Cash Flows from Investing Activities Purchase of investments Interest on investments Net cash provided (used) by investing activities
(8,879,395) (59,891) (1,711,268) 3,300 1,976,295
-
(49,311)
(49,311)
(2,500,000) 619,161
(3,300,116) 129,822
(1,880,839)
(3,170,294)
Net Change in Cash and Cash Equivalents
278,743,679
(1,243,310)
Cash Balance - Beginning of Year
248,919,466
7,090,172
527,663,145 $
5,846,862
$
Cash Balance - End of Year
See accompanying notes to the financial statements.
-5-
COAST COMMUNITY COLLEGE DISTRICT STATEMENT OF CASH FLOWS For the Fiscal Year Ended June 30, 2017 RECONCILIATION OF OPERATING INCOME (LOSS) TO NET CASH PROVIDED (USED) BY OPERATING ACTIVITIES Primary Government
Operating income (loss) Net non-cash contributions Realized and unrealized gains on investments, net Loss on sale of fixed asset Change in value of split-interest agreement
Component units
$ (185,693,440) $
Adjustments to reconcile operating income (loss) to net cash provided (used) by operating activities: Depreciation expense Changes in assets and liabilities: Receivables, net Pledge receivable Contribution receivable from split-interest agreements Inventory Prepaid expense Postemployment healthcare asset Deferred outflows- pension Accounts payable and accrued liabilities Unearned revenue Compensated absences Amounts held in trust for others Estimated liability for open claims and IBNR's Deferred inflows of pension plan investments Net postemployement healthcare liability Net pension liability
21,745,349 (207,783)
(2,680) 609,592 18,453,746 (26,250,741) (7,001,536) 8,846 668,433 7,221 21,784 (6,738,080) (20,252,080) 37,008,699 $ (167,622,670) $
Net cash provided (used) by operating activities Noncash transaction: Capital purchase with $3,610,000 loan. Breakdown of ending cash balance: Cash and cash equivalents Restricted cash and cash equivalents Total
$ $
110,840,112 416,823,033 527,663,145
See accompanying notes to the financial statements.
-6-
3,919,308 (2,564,140) (1,628,894) (50,425) (1,153)
1,857,432 (98,720) 27,247 147,505 57,868
218,779 91,488
1,976,295
COAST COMMUNITY COLLEGE DISTRICT STATEMENT OF FIDUCIARY NET POSITION June 30, 2017
Ancillary Funds Assets Cash and cash equivalents Accounts receivable: Miscellaneous
$
Other current assets Total Assets
3,279,185
Associated Student Body Funds
$
12,852,866
937,711 20,000 4,236,896
390,430 105,060 13,348,356
-
546,521
Deferred Outflows of Resources Deferred outflows - pension
546,521
Total Deferred Outflows of Resources Total Assets and Deferred Outflows of Resources
$
4,236,896
$
13,894,877
$
848,077 3,388,819 4,236,896
$
1,128,529 3,503,734 4,632,263
Liabilities Current Liabilities Accounts payable Funds held in trust Total Current Liabilities Non-Current Liabilities Net pension liability Total Non-Current Liabilities Total Liabilities
4,236,896
1,913,441 1,913,441 6,545,704
-
126,576 126,576
-
7,222,597
Deferred Inflows of Resources Deferred inflows - pension costs Total Deferred Inflows of Resources Net Position
7,222,597
Unrestricted Total Net Position Total Liabilities, Deferred Inflows of Resources and Net Position
$
4,236,896
See accompanying notes to the financial statements.
-7-
$
13,894,877
COAST COMMUNITY COLLEGE DISTRICT STATEMENT OF CHANGES IN FIDUCIARY NET POSITION For the Fiscal Year Ended June 30, 2017
Associated Student Body Funds Additions Sales, net of purchases Interest and investment income Student representation fee Other local revenues
$
1,209,451 1,437 1,789,859 393,384 3,394,131
Total Additions Deductions Classified salaries Employee benefits Services and other operating expenses Capital outlay
283,875 2,159,112 23,185
Total Deductions
3,116,476
650,304
Change in net position
277,655
Net Position, Beginning of Year $
Net Position- End of Year
See accompanying notes to the financial statements.
-8-
6,944,942 7,222,597
COAST COMMUNITY COLLEGE DISTRICT STATEMENT OF OTHER POSTEMPLOYMENT BENEFITS PLAN NET POSITION June 30, 2017
Retiree (OPEB) Trust Assets Investments
$
71,617,326
Total Assets
$
71,617,326
Net Position Held in Trust for Other Postemployment Benefits
$
71,617,326
See accompanying notes to the financial statements.
-9-
COAST COMMUNITY COLLEGE DISTRICT STATEMENT OF CHANGES IN OTHER POSTEMPLOYMENT BENEFITS PLAN NET POSITION For the Fiscal Year Ended June 30, 2017
Retiree (OPEB) Trust Additions Employer contributions Dividends and interest
$
Total Additions Deductions Benefit payments Administrative expenses
6,533,048 6,030,540 12,563,588
Total Deductions
6,533,048 106,841 6,639,889
Net changes in net position
5,923,699
Net Position Held in Trust for Other Postemployment Benefits, Beginning of Year Net Position Held in Trust for Other Postemployment Benefits, End of Year
See accompanying notes to the financial statements.
-10-
65,693,627
$
71,617,326
COAST COMMUNITY COLLEGE DISTRICT NOTES TO THE FINANCIAL STATEMENTS For the Fiscal Year Ended June 30, 2017 NOTE 1: SUMMARY OF SIGNIFICANT ACCOUNTING POLICIES Reporting Entity The District is the level of government primarily accountable for activities related to public education. The governing authority consists of elected officials who, together, constitute the Board of Trustees. The District considered its financial and operational relationships with potential component units under the reporting entity definition of the Governmental Accounting Standards Board (GASB). The basic, but not the only, criterion for including another organization in the District’s reporting entity for financial reports is the ability of the District’s elected officials to exercise oversight responsibility over such agencies. Oversight responsibility implies that one entity is dependent on another and a financial benefit or burden relationship is present and that the dependent unit should be reported as part of the other. Oversight responsibility is derived from the District’s power and includes, but is not limited to: financial interdependency; selection of governing authority; designation of management; ability to significantly influence operations; and accountability for fiscal matters. Due to the nature and significance of their relationship with the District, including ongoing financial support of the District or its other component units, certain organizations warrant inclusion as part of the financial reporting entity. A legally separate, tax-exempt organization should be reported as a component unit of the District if all of the following criteria are met:
The economic resources received or held by the separate organization are entirely or almost entirely for the direct benefit of the District, its component units, or its constituents. The District, or its component units, is entitled to, or has the ability to otherwise access, a majority of the economic resources received or held by the separate organization. The economic resources received or held by an individual organization that the District, or its component units, is entitled to, or has the ability to otherwise access, are significant to the District.
Based upon the application of the criteria listed above, the following potential component units have been included in the District’s reporting entity: Coast Community College District Foundation, Coastline College Foundation, Golden West College Foundation, Orange Coast College Foundation and Coast Community College District Enterprise Corporation: Each Foundation is a separate not-for-profit corporation formed to promote and assist the educational programs of the District. The Enterprise Corporation is a separate for-profit corporation and operates the swap meet at Golden West and Orange Coast Colleges. The Board of Directors are elected independent of any District’s Board Trustee’s appointments. The Board of Directors are responsible for approving -11-
COAST COMMUNITY COLLEGE DISTRICT NOTES TO THE FINANCIAL STATEMENTS For the Fiscal Year Ended June 30, 2017 NOTE 1: SUMMARY OF SIGNIFICANT ACCOUNTING POLICIES their own budgets and accounting and finance related activities; however, the District’s governing board has fiscal responsibility over each Foundation and the Enterprise Corporation. The financial activities of the Foundations and the Enterprise Corporation have been discretely presented. Their separate financial statements may be obtained through the District. Retiree Health Benefit OPEB Trust (the Trust): The Trust is an irrevocable governmental trust pursuant to Section 115 of the Internal Revenue Code for the purpose of funding certain post-employment benefits other than pensions. The Trust is administered by the Retiree Health Benefit Funding Program Joint Powers Agency (the JPA) as directed by the investment alternative choice selected by the District. The District retains the responsibility to oversee the management of the Trust, including the requirement that investments and assets held within the Trust continually adhere to the requirements of the California Government Code Section 53600.5 which specifies that the trustee’s primary role is to preserve capital, then maintain investment liquidity and thirdly, to protect investment yield. As such, the District acts as the fiduciary of the Trust. The Trust has been discretely presented; separate financial statements are not prepared for the Trust. Pension Stabilization Trust (the PST): The PST was established to help California public entities stabilize the funding of their pension benefit liabilities be creating a secure vehicle to hold assets pending their contribution to a pension plan in satisfaction of their funding obligation. The PST is an irrevocable governmental trust intended to qualify as a trust arrangement that is tax exempt under applicable guidance and procedures under Section 115 of the Internal Revenue Code. The PST is administered by Benefit Trust Company as directed by the Board of Authority; the District appoints one member. The District is the sole beneficiary of the PST; the fund does not meet the definition of a fiduciary activity, thus, it is reported as a blended component unit. Separate financial statements are not prepared for the PST. Financial Statement Presentation The accompanying financial statements have been prepared in conformity with generally accepted accounting principles as prescribed by GASB. The financial statement presentation provides a comprehensive, entity-wide perspective of the District’s financial activities. The entity-wide perspective replaces the fund-group perspective previously required. Fiduciary activities, with the exception of the Student Financial Aid Fund and the Retiree Benefits Fund, are excluded from the basic financial statements. Basis of Accounting Basis of accounting refers to when revenues and expenditures or expenses are recognized in the accounts and reported in the financial statements. Basis of accounting relates to the timing of measurement made, regardless of the measurement focus applied.
-12-
COAST COMMUNITY COLLEGE DISTRICT NOTES TO THE FINANCIAL STATEMENTS For the Fiscal Year Ended June 30, 2017 NOTE 1: SUMMARY OF SIGNIFICANT ACCOUNTING POLICIES For financial reporting purposes, the District is considered a special-purpose government engaged in business-type activities. Accordingly, the District’s basic financial statements have been presented using the economic resources measurement focus and the accrual basis of accounting. Under the accrual basis, revenues are recognized when earned, and expenses are recorded when an obligation has been incurred. All significant intra-agency transactions have been eliminated. The statements of plan net position and changes in plan net position of the Retiree Health Benefit OPEB Trust are prepared using the accrual basis of accounting. Employer contributions to the plan are recognized when due and the employer has made a formal commitment to provide the contributions. Benefits and refunds are recognized when due and payable in accordance with the terms of the plan. For internal accounting purposes, the budgetary and financial accounts of the District have been recorded and maintained in accordance with the Chancellor’s Office of the California Community College’s Budget and Accounting Manual. To ensure compliance with the California Education Code, the financial resources of the District are divided into separate funds for which separate accounts are maintained for recording cash, other resources and all related liabilities, obligations and equities. By state law, the District's Board of Trustees must approve a budget no later than September 15. A public hearing must be conducted to receive comments prior to adoption. The District's Board of Trustees satisfied these requirements. Budgets for all governmental funds were adopted on a basis consistent with generally accepted accounting principles (GAAP). These budgets are revised by the District's Board of Trustees during the year to give consideration to unanticipated income and expenditures. Formal budgetary integration was employed as a management control device during the year for all budgeted funds. Expenditures cannot legally exceed appropriations by major object account. Cash and Cash Equivalents The District’s cash and cash equivalents, are considered to be cash on hand, demand deposits and short-term investments with original maturities of three months or less from the date of acquisition. Cash in the County Treasury is recorded at cost, which approximates fair value, in accordance with the requirements of GASB.
-13-
COAST COMMUNITY COLLEGE DISTRICT NOTES TO THE FINANCIAL STATEMENTS For the Fiscal Year Ended June 30, 2017 NOTE 1: SUMMARY OF SIGNIFICANT ACCOUNTING POLICIES Investments Investments in the Other Post-Employment Benefits Plan are reported at fair value, which is determined by the most recent bid and asking price as obtained from dealers that make markets in such securities. Accounts Receivables Accounts receivable consists primarily of amounts due from the Federal, state and local governments, or private sources, in connection with reimbursement of allowable expenditures made pursuant to the District’s grant and contracts. Material receivables are considered fully collectible. The District recognized for budgetary and financial reporting purposes any amount of state appropriations deferred from the current fiscal year and appropriated from the subsequent fiscal year for payment of current year costs as a receivable in the current year. Bad debts are accounted for by the direct write-off method for student receivables, which is not materially different from the allowance method. Inventories Inventories are presented at the lower of cost or market on an average basis and are expensed when used. Inventory consists of items held for resale in the food service and sailing center operations and expendable instructional, custodial, health and other supplies held for consumption. Prepaid Expenses Payments made to vendors for goods or services that will benefit periods beyond June 30, 2017, are recorded as prepaid items using the consumption method. A current asset for the prepaid amount is recorded at the time of the purchase and an expenditure/expense is reported in the year in which goods or services are consumed. Restricted Cash and Cash Equivalents Restricted cash and cash equivalents are those amounts designated for acquisition or construction of non-current assets or that are segregated for the liquidation of long-term debt. Restricted Student Loans Receivable, Net Student loans receivable consist of loan advances to students awarded under the student financial aid programs the District administers for Federal agencies. Student loans receivable are recorded
-14-
COAST COMMUNITY COLLEGE DISTRICT NOTES TO THE FINANCIAL STATEMENTS For the Fiscal Year Ended June 30, 2017 NOTE 1: SUMMARY OF SIGNIFICANT ACCOUNTING POLICIES net of cancelled principal. The receivables are held in trust for the awarding Federal agency. Capital Assets Capital assets are recorded at cost at the date of acquisition. Donated capital assets are recorded at their estimated fair value at the date of donation. For equipment, the District’s capitalization policy includes all items with a unit cost of $5,000 or more and an estimated useful life of greater than one year. Buildings valued at $5,000 or more as well as renovations to buildings, infrastructure, and land improvements that significantly increase the value or extend the useful life of the structure are capitalized. Interest costs are capitalized as part of the historical cost of acquiring certain assets. To qualify for interest capitalization, assets must require a period of time before they are ready for their intended purpose. In determining the amount to be capitalized, interest costs are offset by interest earned on proceeds of the District’s tax exempt debt restricted to the acquisition of qualifying assets. The cost of normal maintenance and repairs that does not add to the value of the asset or materially extend the asset's life is recorded as an operating expense in the year in which the expense was incurred. Depreciation is computed using the straight-line method with a half-year convention over the estimated useful lives of the assets, generally 50 years for buildings, 20 years for building, 10 years for land improvements, 8 years for equipment and vehicles and 3 years for technology. Deferred Outflows of Resources Deferred outflows of resources represent a consumption of net position that applies to a future period and thus, will not be recognized as an outflow of resources (expense/expenditure) until then. These amounts are reported in the government-wide statement of net position. Deferred Charge on Refunding: A deferred charge on refunding results from the difference in the carrying value of refunded debt and its reacquisition price. This amount is deferred and amortized over the shorter of the life of the refunded or refunding debt. Deferred Outflows – Pensions: The deferred outflows of resources related to pensions resulted from District contributions to employee pension plans subsequent to the measurement date of the actuarial valuations for the pension plans, the effect of changes in proportion, and the difference between expected and actual experience. The deferred outflows – pensions will be deferred and amortized as detailed in Note 11 to the financial statements.
-15-
COAST COMMUNITY COLLEGE DISTRICT NOTES TO THE FINANCIAL STATEMENTS For the Fiscal Year Ended June 30, 2017 NOTE 1: SUMMARY OF SIGNIFICANT ACCOUNTING POLICIES Accounts Payable and Accrued Liabilities Accounts payable consists of amounts due to vendors for goods and services received prior to June 30. Accrued liabilities consist of salaries and benefits payable. Unearned Revenue Cash received for Federal and state special projects, and programs is recognized as revenue to the extent that qualified expenditures have been incurred. Unearned revenue is recorded to the extent cash received on specific projects and programs exceeds qualified expenditures. Unearned revenue also includes summer enrollment fees received but not earned. Compensated Absences Accumulated unpaid employee vacation benefits are recognized as a liability in the statement of net position when incurred. The District has accrued a liability for the amounts attributable to load banking hours within accrued liabilities. Load banking hours consist of hours worked by instructors in excess of a fulltime load for which they may carryover for future paid time off. Sick leave benefits are accumulated without limit for each employee. The employees do not gain a vested right to accumulated sick leave; therefore, accumulated employee sick leave benefits are not recognized as a liability of the District. The District's policy is to record sick leave as an operating expense in the period taken; however, unused sick leave is added to the creditable service period for calculation of retirement benefits when the employee retires. Net Pension Liability For purposes of measuring the net pension liability and deferred outflows/inflows of resources related to pensions, and pension expense, information about the fiduciary net position of the California State Teachers’ Retirement System (CalSTRS) and the California Public Employees’ Retirement System (CalPERS) plan for schools (Plans) and additions to/deductions from the Plans’ fiduciary net position have been determined on the same basis as they are reported by CalSTRS and CalPERS. For this purpose, benefit payments (including refunds of employee contributions) are recognized when due and payable in accordance with the benefit terms. Member contributions are recognized in the period in which they are earned. Investments are reported at fair value.
-16-
COAST COMMUNITY COLLEGE DISTRICT NOTES TO THE FINANCIAL STATEMENTS For the Fiscal Year Ended June 30, 2017 NOTE 1: SUMMARY OF SIGNIFICANT ACCOUNTING POLICIES Deferred Inflows of Resources Deferred inflows of resources represent an acquisition of net assets by the District that is applicable to a future reporting period. The deferred inflows of resources related to pensions results from the difference between the estimated and actual return on pension plan investments, the effect of changes in proportion and changes in assumptions, and the difference between expected and actual experience. These amounts are deferred and amortized as detailed in Note 11 to the financial statements. Net Position Net Investment in Capital Assets: This represents the District’s total investment in capital assets, net of outstanding debt obligations related to those capital assets. To the extent debt has been incurred but not yet expended for capital assets, such amounts are not included as a component of net investment in capital assets. Restricted Net Position – Expendable: Restricted expendable net position includes resources in which the District is legally or contractually obligated to spend resources in accordance with restrictions imposed by external third parties or by enabling legislation adopted by the District. The District first applies restricted resources when an expense is incurred for purposes for which both restricted and unrestricted net position is available. Restricted Net Position – Nonexpendable: Nonexpendable restricted net position consists of endowment and similar type funds in which donors or other outside sources have stipulated, as a condition of the gift instrument, that the principal is to be maintained inviolate and in perpetuity, and invested for the purpose of producing present and future income, which may either be expended or added to principal. The District had no restricted net position – nonexpendable. Unrestricted Net Position: Unrestricted net position represents resources available to be used for transactions relating to the general operations of the District, and may be used at the discretion of the governing board, as designated, to meet current expenses for specific future purposes. State Apportionments Certain current year apportionments from the state are based upon various financial and statistical information of the previous year. Any prior year corrections due to the recalculation in February of 2017 will be recorded in the year computed by the State.
-17-
COAST COMMUNITY COLLEGE DISTRICT NOTES TO THE FINANCIAL STATEMENTS For the Fiscal Year Ended June 30, 2017 NOTE 1: SUMMARY OF SIGNIFICANT ACCOUNTING POLICIES Property Taxes Secured property taxes attach as an enforceable lien on property as of January 1. Taxes are payable in two installments on November 1 and February 1 and become delinquent on December 10 and April 10, respectively. Unsecured property taxes are payable in one installment on or before August 31. Real and personal property tax revenues are reported in the same manner in which the County auditor records and reports actual property tax receipts to the Department of Education. This is generally on a cash basis. A receivable has not been accrued in these financial statements because it is not material. Property taxes for debt service purposes cannot be estimated and have therefore not been accrued in the basic financial statements. Classification of Revenues The District has classified its revenues as either operating or nonoperating revenues according to the following criteria: Operating Revenues: Operating revenues include activities that have the characteristics of exchange transactions, such as student fees, net of scholarship discounts and allowances, and Federal and most state and local grants and contracts. Nonoperating Revenues: Nonoperating revenues include activities that have the characteristics of nonexchange transactions, such as State apportionments, taxes, and other revenue sources that are defined as nonoperating revenues by GASB. Scholarship Discounts and Allowances Student tuition and fee revenues, and certain other revenues from students, are reported net of scholarship discounts and allowances in the statement of revenues, expenses, and changes in net assets. Scholarship discounts and allowances are the difference between the stated charge for goods and services provided by the District, and the amount that is paid by students and/or third parties making payments on the students’ behalf. Certain governmental grants, such as Pell grants, and other Federal, state or nongovernmental programs, are recorded as operating revenues in the District’s financial statements. To the extent that revenues from such programs are used to satisfy tuition and fees and other student charges, the District has recorded a scholarship discount and allowance. Estimates The preparation of the financial statements in conformity with generally accepted accounting
-18-
COAST COMMUNITY COLLEGE DISTRICT NOTES TO THE FINANCIAL STATEMENTS For the Fiscal Year Ended June 30, 2017 NOTE 1: SUMMARY OF SIGNIFICANT ACCOUNTING POLICIES principles requires management to make estimates and assumptions that affect the amounts reported in the financial statements and accompanying notes. Actual results may differ from those estimates. NOTE 2: DEPOSITS AND INVESTMENTS Deposits Custodial Credit Risk Custodial credit risk is the risk that in the event of a bank failure, the District’s deposits may not be returned to it. The District does not have a deposit policy for custodial risk. As of June 30, 2017, $35,759,152 of the District’s bank balance of $36,131,985 was exposed to credit risk as uninsured and collateral held by pledging bank’s trust department not in the District’s name. Cash in County In accordance with The Budget and Accounting Manual, the District maintains substantially all of its cash in the Orange County Treasury as part of the common investment pool. The District is considered an involuntary participant in the investment pool. These pooled funds are carried at amortized cost which approximates fair value. Fair value of the pooled investments at June 30, 2017 is measured at 99.70% of amortized cost. The District’s investments in the fund are considered to be highly liquid and reflected in the financial statements as cash and cash equivalents in the statement of net position. The County is authorized to deposit cash and invest excess funds by California Government Code Sections 53534, 53601, 53635 and 53648. The county is restricted to invest in time deposits, U.S. government securities, state registered warrants, notes or bonds, State Treasurer’s investment pool, bankers’ acceptances, commercial paper, negotiable certificates of deposit, and repurchase or reverse repurchase agreements. The funds maintained by the County are either secured by federal depository insurance or are collateralized. The county investment pool is not required to be rated. Interest earned is deposited quarterly into participating funds. Any investment losses are proportionately shared by all funds in the pool. The county investment pool is not registered as an investment company with the Securities and Exchange Commission (SEC) nor is it an SEC Rule 2a7-like pool. California Government Code statutes and the County Board of Supervisors set forth the various investment policies that the Country Treasurer follow. The method used to determine the value of the participant’s equity withdrawn is based on the book value, which is amortized cost, of the participant’s percentage participation on the date of such withdrawals.
-19-
COAST COMMUNITY COLLEGE DISTRICT NOTES TO THE FINANCIAL STATEMENTS For the Fiscal Year Ended June 30, 2017 NOTE 2: DEPOSITS AND INVESTMENTS The pool sponsor’s annual financial report may be obtained from the Auditor-Controller County of Orange, 12 Civic Center Plaza, Room 200, Santa Ana, CA 92702. Investments Policies Under provisions of California Government Code Sections 16430, 53601 and 53602, the District may invest in the following types of investments:
State of California Local Agency Investment Fund (LAIF) County Treasurer’s Investment Pools U.S. Treasury notes, bonds, bills or certificates of indebtedness Fully insured or collateralized certificates of deposit Fully insured and collateralized credit union accounts
The District did not violate any provisions of the California Government Code or District Board policy during the year ended June 30, 2017. Investments and investments with fiscal agent at June 30, 2017 are presented herein: Maturities Fair Value
(in Years) Less Than 1 1 to 5 6 to 10 More Than 10
$
Total
$
U.S. Treasury
Federal Agency
Bonds
Bonds
1,644,559 $ 10,301,515 8,765,604 22,926,330
1,644,559 $ 6,302,470 5,949,804 15,597,362
43,638,008
29,494,195
$
$
Corporate Bonds $ 3,999,045
2,815,800 7,328,968 10,144,768
$
3,999,045
Investment Valuation Investments are measured at fair value on a recurring basis. Recurring fair value measurements are those that GASB require or permit in the statement of net position at the end of each reporting period. Fair value measurements are categorized based on the valuation inputs used to measure an asset’s fair value: Level 1 inputs are quoted prices in active markets for identical assets; Level 2 inputs are significant other observable inputs; Level 3 inputs are significant unobservable inputs. Investment fair value measurements at June 30, 2017 are presented herein:
-20-
COAST COMMUNITY COLLEGE DISTRICT NOTES TO THE FINANCIAL STATEMENTS For the Fiscal Year Ended June 30, 2017 NOTE 2: DEPOSITS AND INVESTMENTS Standard & Investment - Level 1 Inputs U.S. Treasury Bonds Federal Agency Bonds Corporate Bonds:
Fair Value $ 29,494,195 10,144,768 3,999,045
Total
$
Poor's Rating AA+ AA+ AA+
43,638,008
Investments categorized as Level 1 are valued based on prices quoted in active markets for those securities. Interest Rate Risk Interest rate risk is the risk that changes in interest rates will adversely affect the fair value of an investment. Generally, the longer the maturity of an investment the greater the sensitivity of its fair value to changes in market interest rates. Board Policy 6320 Investments includes as the primary objectives 1) Safety: Preservation of principal is the foremost objective of the District; 2) Liquidity: The District’s portfolio will remain sufficiently liquid to enable the District to meet its liquidity needs, and 3) Yield: The District’s portfolio will be designed to obtain a market rate of return through economic cycles consistent with the constraints imposed by its safety objective and cash flow considerations. Board Policy 6320 does not specify limits on investment maturities as a means of managing exposure to fair value losses arising from increasing interest rates; however, the District has operated within parameters of the “Permitted Investments” as specified in the Measure M 2013 and 2016 Official Statements and the Board Resolution No. 13.06 authorizing the election. These parameters set up the outer boundaries of what the bond proceeds can be invested in. The District has since developed an investment strategy for those proceeds. Information about the exposure of the District’s investments to this risk is provided above. Effective January 1, 2017, AB2738 prohibits the proceeds from the sale of bonds from being withdrawn for investment outside the county treasury. Credit Risk Credit risk is the risk that an issuer of an investment will not fulfill its obligations. This is measured by assignment of a rating by a nationally recognized rating organization. U.S. government securities or obligations explicitly guaranteed by the U.S. government are not considered to have credit risk exposure. The District has operated within parameters of the “Permitted Investments” as specified in the Measure M 2013 and 2016 Official Statements and the Board Resolution No. 13.06 authorizing the election. These parameters set up the outer boundaries of what the bond proceeds can be invested in. The District has since developed an investment strategy for those proceeds. Information about the exposure of the District’s investments to this risk is provided herein.
-21-
COAST COMMUNITY COLLEGE DISTRICT NOTES TO THE FINANCIAL STATEMENTS For the Fiscal Year Ended June 30, 2017 NOTE 2: DEPOSITS AND INVESTMENTS Concentration of Credit Risk Concentration of credit risk is the risk of a loss attributed to the magnitude of a government’s investment in a single issuer. The District places no limit on the amount that may be invested in any one issuer. In accordance with governmental accounting standards, the District is exposed to concentration of credit risk whenever an investment in any one issuer exceeds 5%. Investments guaranteed by the U.S. government and investments in mutual funds and external investment pools are excluded from this requirement. NOTE 3: ACCOUNTS RECEIVABLE Accounts receivable as of June 30, 2017 consists of the following: Accounts Receivable
June 30, 2017
Federal and state Tuition and fees Student loans receivable, net Miscellaneous Total accounts receivable
$
$
1,817,228 9,724,914 2,653,878 8,425,809 22,621,829
NOTE 4: NOTE RECEIVABLE The District entered into a note receivable in the amount of $20,000,000 for the sale of KOCE and the KOCE-TV operating license on March 17, 2004. The payments are to be made to the District over 26 years. The District received $750,000 during this fiscal year and is expecting to receive $750,000 in the next fiscal year. The balance of the notes receivable as of June 30, 2017, is $12,937,500. NOTE 5: CAPITAL ASSETS AND DEPRECIATION – SCHEDULE OF CHANGES A summary of changes in capital assets for the year ended June 30, 2017 is shown herein.
-22-
COAST COMMUNITY COLLEGE DISTRICT NOTES TO THE FINANCIAL STATEMENTS For the Fiscal Year Ended June 30, 2017 NOTE 5: CAPITAL ASSETS AND DEPRECIATION – SCHEDULE OF CHANGES Balance
Balance
July 1, 2016 Capital assets not being depreciated: Land Construction in progress
$
Total capital assets being depreciated
June 30, 2017
Retirements
24,141,969 $ 30,449,783
61,054,363
(16,696,997)
24,141,969 74,807,149
54,591,752
61,054,363
(16,696,997)
98,949,118
655,462,873 39,109,497
22,284,924 7,594,603
(44,786)
677,747,797 46,659,314
(44,786)
724,407,111
Total capital assets not being depreciated Capital assets being depreciated: Buildings and improvements Equipment and vehicles
Additions $
$
694,572,370
29,879,527
Less accumulated depreciation for: Buildings and improvements Equipment and vehicles
(255,842,552) (33,695,852)
(20,189,700) (1,555,649)
44,786
(276,032,252) (35,206,715)
Total accumulated depreciation
(289,538,404)
(21,745,349)
44,786
(311,238,967)
405,033,966
8,134,178
Depreciable assets, net Governmental activities capital assets, net
$
459,625,718 $
-
69,188,541 $
413,168,144
(16,696,997) $
512,117,262
For the year ended June 30, 2017, amount of interest capitalized was $8,919,580. Interest earned on proceeds of the District’s tax exempt debt used to offset capitalized interest was $1,470,904. NOTE 6: LONG-TERM DEBT – SCHEDULE OF CHANGES A schedule of changes in long-term debt for the year ended June 30, 2017 is shown herein. Balance
Amount Due
June 30, 2017
in One Year
Balance July 1, 2016
Governmental Capital leases Compensated absences Note payable
$
268,295 $ 6,116,591 3,765,000
Additions
Reductions $
176,814 $
668,433 155,000
General obligation bonds: Bonds payable Accreted interest Bonds premium
498,864,504 38,503,246 45,701,998
330,000,000 6,990,333 30,306,946
23,020,000
Total general obligation bonds
583,069,748
367,297,279
Postemployment healthcare liabilities Net pension liability
172,744,626
31,549,563 37,008,699
Total
$ 765,964,260 $ 436,523,974
Additions
Net pension liability
$
1,548,363 $
365,078 $
Total
$
1,548,363 $
365,078 $
-23-
91,481 741,457 325,000
24,510,000
3,531,304
805,844,504 45,493,579 72,477,640
26,551,304
923,815,723
24,510,000
31,549,563 209,753,325 26,728,118 $ 1,175,605,116 $25,667,938 Balance
Amount Due
June 30, 2017
in One Year
Balance July 1, 2016
Fiduciary
91,481 $ 6,785,024 3,610,000
Reductions
$
1,913,441 $
-
1,913,441 $
-
COAST COMMUNITY COLLEGE DISTRICT NOTES TO THE FINANCIAL STATEMENTS For the Fiscal Year Ended June 30, 2017 NOTE 6: LONG-TERM DEBT – SCHEDULE OF CHANGES Liabilities for compensated absences and the net pension liability are liquidated by the governmental funds in which related salaries and benefits are recorded. Capital leases are liquidated by the General Fund, while the general obligation bond liabilities are liquidated through property tax collections as administered by the County Controller’s office through the Bond Interest and Redemption Fund. NOTE 7: LEASES Capital Leases The District has entered into a lease agreement to implement an energy conservation photovoltaic power system totaling $1,485,600. Future minimum lease payments are shown herein. Year Ending June 30,
Principal
2018 Total
$ $
91,481 $ 91,481 $
Interest 2,113 $ 2,113 $
Total 93,594 93,594
The current year payment for this lease is approximately $187,000. The District will receive no sublease rental revenues nor pay any contingent rentals for this agreement. Operating Leases The District has entered into various operating leases for land, buildings, vehicles, and equipment with lease terms in excess of one year. None of these agreements contain purchase options. Future minimum lease payments under these agreements are shown herein. Year Ending June 30, 2018 2019 2020 2021 2022 Total
Lease Payment $ 393,299 245,896 134,230 97,047 53,419 $ 923,891
Current year expenditures for operating leases is approximately $420,000. The District will receive no sublease rental revenues nor pay any contingent rentals for these properties.
-24-
COAST COMMUNITY COLLEGE DISTRICT NOTES TO THE FINANCIAL STATEMENTS For the Fiscal Year Ended June 30, 2017 NOTE 8: NOTE PAYABLE On March 24, 2016, the District entered into a note payable in the amount of $3,765,000 at an interest rate of 3.75% to purchase the property on Newhope Street in the city of Fountain Valley, California. The payments are to be made over 10 years as presented herein. Year Ending June 30,
Principal
Interest
Total
2018 2019 2020 2021 2022 2023-2027
$
325,000 $ 335,000 350,000 360,000 375,000 1,865,000
73,339 $ 138,281 126,281 113,812 100,875 292,969
398,339 473,281 476,281 473,812 475,875 2,157,969
Total
$
3,610,000 $
845,557 $
4,455,557
NOTE 9: GENERAL OBLIGATION BONDS Measure C On November 5, 2002, $370,000,000 in general obligation bonds were authorized by an election (Measure C) held within the District. The bonds were authorized (i) to finance the construction, acquisition, and modernization of certain property and District facilities and (ii) to provide a portion of the monies needed to prepay certain lease and debt obligations of the District, and (iii) to pay the related costs of bonds issuance. Between 2003 and 2006, the District issued bonds, Series A, B, and C, totaling $370,000,000. In 2005, the District issued 2005 refunding bonds totaling $74,893,867 to advance refund portions of the District’s Series 2003A bonds. Measure M On November 6, 2012, $698,000,000 in general obligation bonds were authorized by an election (Measure M) held within the District. The bonds were authorized to (i) finance the construction, acquisition, and modernization of certain property and District facilities, (ii) to finance an endowment for voter-approved technology upgrades, (iii) to provide a portion of the monies needed to prepay certain lease and debt obligations of the District, and (iv) to pay the related costs of bonds issuance. On May 29, 2013, the District issued bonds, Series A, Series B, Tax-Exempt Refunding Series A, and Tax Refunding Series B totaling $315,740,000. In 2015, the District issued Refunding Bonds totaling $162,855,806 to advance refund Series C from Measure C.
-25-
COAST COMMUNITY COLLEGE DISTRICT NOTES TO THE FINANCIAL STATEMENTS For the Fiscal Year Ended June 30, 2017 NOTE 9: GENERAL OBLIGATION BONDS The balance of the bonds refunded was $28,645,281 less than the amount paid into the escrow account. This amount is recorded as a deferred charge on the statement of net position and amortized to interest expense over the life of the new debt. Amortization of $2,012,843 was recognized during the year ended June 30, 2017. On August 31, 2016, the District issued bonds, Series C totaling $30,000,000, to (i) finance an endowment for voter-approved technology upgrades and (ii) to pay the cost of using the bonds. On March 29, 2017, the District issued bonds, Series D and Series E, totaling $300,000,000. Series D bonds are being issued to (i) finance the acquisition, construction, modernization and equipping of the District sites and facilities, and (ii) pay the costs of issuing the bonds. Series E bonds are being issued to (i) finance voter-approved technology upgrades, and (ii) pay the costs of issuing the Series E bonds. The outstanding general obligation bonded debt of the District at June 30, 2017 is shown herein. General Obligation Bonds Measure C: Series A 2005 Refunding Accreted Interest Series B Accreted Interest
Date of
Date of
Interest
Amount of
Outstanding
Issue
Maturity
Rate %
Original Issue
June 30, 2017
4/17/2003 3/10/2005
8/1/2016 8/1/2022
2.50-5.50 3.00-5.25
6/28/2006
8/1/2030
3.63-5.00
Total Measure C Measure M: Series A Series B Refunding Series A Refunding Series B 2015 Refunding Accreted Interest Series C Series D Series E
$
110,000,000 $ 74,893,867 149,859,831
2,618,867 8,287,540 48,859,831 35,522,345
334,753,698
95,288,583
5/29/2013 5/29/2013 5/29/2013 5/29/2013 10/29/2015
8/1/2038 8/1/2018 8/1/2024 8/1/2020 8/1/2036
1.50-5.00 0.45-1.64 2.00-5.00 0.35-2.27 2.00-5.00
190,000,000 10,000,000 80,265,000 35,475,000 162,855,806
8/31/2016 3/29/2017 3/29/2017
8/1/2023 8/1/2042 8/1/2019
0.80-1.98 4.00-5.00 1.43-1.69
30,000,000 280,000,000 20,000,000
154,480,000 4,055,000 78,725,000 25,970,000 161,135,806 1,683,694 30,000,000 280,000,000 20,000,000
808,595,806
756,049,500
$ 1,143,349,504 $
851,338,083
Total Measure M Total
-26-
COAST COMMUNITY COLLEGE DISTRICT NOTES TO THE FINANCIAL STATEMENTS For the Fiscal Year Ended June 30, 2017 NOTE 9: GENERAL OBLIGATION BONDS Payments-Measure C The annual requirements to amortize Measure C bonds payable, outstanding as of June 30, 2017, are as shown herein. Series A The last principal payment of $595,000 was made on August 1, 2016. 2005 Refunding Bonds Principal
Year Ending June 30, 2018 2019
$
2020 2021 2022 2023
Interest
425,933 1,159,595 1,033,339
Total
$
Total
$
$
2,540,000 7,770,000 7,779,999
2,114,067 6,610,405 6,746,660
2,618,867 $
-
15,471,132 $
18,089,999
Series B Year Ending June 30, 2018 2019 2020 2021 2022 2023-2027 2028-2031 Total
Accreted Interest
Principal $
$
Current Interest $
19,422,018 31,897,982 60,952,187 29,437,813 $ 48,859,831 $ 92,850,169 $
Total $
51,320,000 90,390,000 - $ 141,710,000
Payments-Measure M The annual requirements to amortize Measure M bonds payable, outstanding as of June 30, 2017, are as shown herein.
-27-
COAST COMMUNITY COLLEGE DISTRICT NOTES TO THE FINANCIAL STATEMENTS For the Fiscal Year Ended June 30, 2017 NOTE 9: GENERAL OBLIGATION BONDS Series A Year Ending June 30,
Principal
Interest
Total
2018 2019 2020 2021 2022 2023-2027 2028-2032 2033-2037 2038-2039
$
1,185,000 $ 825,000 1,920,000 2,335,000 2,745,000 20,845,000 36,695,000 57,400,000 30,530,000
6,711,625 $ 6,681,475 6,630,700 6,545,600 6,444,000 29,971,775 23,407,025 13,690,150 1,404,950
7,896,625 7,506,475 8,550,700 8,880,600 9,189,000 50,816,775 60,102,025 71,090,150 31,934,950
Total
$ 154,480,000 $
101,487,300 $
255,967,300
Series B Principal
Year Ending June 30, 2018 2019 Total
$ $
2,015,000 $ 2,040,000 4,055,000 $
Interest 46,896 $ 16,708 63,604 $
Total 2,061,896 2,056,708 4,118,604
Tax-Exempt Refunding Series A Principal
Year Ending June 30,
Interest
Total
2018 2019 2020 2021 2022 2023-2025
$
4,090,000 $ 5,115,000 6,225,000 7,470,000 8,845,000 46,980,000
3,762,400 $ 3,578,300 3,320,375 2,978,000 2,570,125 3,886,500
7,852,400 8,693,300 9,545,375 10,448,000 11,415,125 50,866,500
Total
$ 78,725,000 $
20,095,700 $
98,820,700
Taxable Refunding Series B Year Ending June 30,
Principal
Interest
Total
2018 2019 2020 2021
$
6,925,000 $ 7,030,000 7,140,000 4,875,000
412,320 $ 308,416 180,654 55,234
7,337,320 7,338,416 7,320,654 4,930,234
Total
$ 25,970,000 $
956,624 $
26,926,624
-28-
COAST COMMUNITY COLLEGE DISTRICT NOTES TO THE FINANCIAL STATEMENTS For the Fiscal Year Ended June 30, 2017 NOTE 9: GENERAL OBLIGATION BONDS 2015 Refunding Bonds Year Ending June 30, 2018 2019 2020 2021 2022 2023-2027 2028-2032 2033-2037 Total
Accreted Interest
Principal $
$
Current Interest $
61,675,000 99,460,806 65,224,194 $ 161,135,806 $ 65,224,194 $
5,177,950 $ 5,177,950
Total 5,177,950 5,177,950
5,177,950 5,177,950 5,177,950 5,177,950 5,177,950 5,177,950 25,889,750 25,889,750 21,292,875 82,967,875 1,775,100 166,460,100 74,847,475 $ 301,207,475
Series C Year Ending June 30,
Principal
2018 2019 2020 2021 2022 2023-2024 Total
Interest
$ 10,295,000 $ 2,610,000 3,060,000 3,220,000 3,400,000 7,415,000 $ 30,000,000 $
336,166 $ 283,316 254,084 214,465 165,698 144,969 1,398,698 $
Total 10,631,166 2,893,316 3,314,084 3,434,465 3,565,698 7,559,969 31,398,698
Series D Year Ending June 30, 2018 2019 2020 2021 2022 2023-2027 2028-2032 2033-2037 2038-2042 2043 Total
Principal $
$ 1,750,000
19,085,000 32,615,000 87,070,000 116,480,000 23,000,000 $ 280,000,000 $
-29-
Interest Total 10,830,894 $ 10,830,894 12,911,000 12,911,000 12,876,000 14,626,000 12,841,000 12,841,000 12,841,000 12,841,000 62,878,125 81,963,125 55,508,375 88,123,375 42,211,000 129,281,000 16,792,000 133,272,000 460,000 23,460,000 240,149,394 $ 520,149,394
COAST COMMUNITY COLLEGE DISTRICT NOTES TO THE FINANCIAL STATEMENTS For the Fiscal Year Ended June 30, 2017 NOTE 9: GENERAL OBLIGATION BONDS Series E Principal
Year Ending June 30, 2018 2019 2020
$
$ 9,650,000 10,350,000
$ 20,000,000 $
Total
Interest 262,352 $ 243,982 87,613
Total 262,352 9,893,982 10,437,613
593,947 $
20,593,947
NOTE 10: POST EMPLOYMENT HEALTHCARE BENEFITS Plan Description and Eligibility The District administers a single-employer defined benefit healthcare plan. The District provides medical, dental and vision insurance coverage, as prescribed in the various employee union contracts, to retirees meeting plan eligibility requirements. The District reports the financial activity of the plan as a trust fund in these financial statements and no separate financial statement is prepared. Eligible employees retiring from the District may become eligible for these benefits when the requirements are met. For employees participating in CalSTRS and CalPERS, the eligibility requirement is a minimum age of 55 and a minimum ten years of service with the District. Additional age and service criteria may be required. Number of Participant Type: Inactive participants currently receiving benefits Inactive participants entitled to but not yet receiving benefit payments Active employees
Participants 749 1,315 2,064
Total
Funding Policy The contribution requirements are established and may be amended by the District. All contributions are discretionary and an actuarial determined contribution was not calculated. The District contributes 100 percent of the cost of current year premiums for eligible retired plan members and their spouses up to age 70 and $4,000 maximum per year beyond age 70 until death. For fiscal year ended June 30, 2017, the District contributed $6,533,048 to the plan. Net OPEB Liability (Asset) The following table shows the components of the net OPEB liability (asset) of the District:
-30-
COAST COMMUNITY COLLEGE DISTRICT NOTES TO THE FINANCIAL STATEMENTS For the Fiscal Year Ended June 30, 2017 NOTE 10: POST EMPLOYMENT HEALTHCARE BENEFITS Balance Total OPEB liability Plan fiduciary net position
June 30, 2017 $ 103,166,889 71,617,326
District's net OPEB liability (asset)
$
31,549,563
Investments The Plan has assets with two trustees; the Retiree Health Benefit Funding Program Joint Powers Agency (the JPA) held in the Retiree Health Benefit OPEB Trust (the Trust), and Benefit Trust Company held in the Futuris Public Entity Investment Trust (Futuris). These accounts collectively comprise the Plan assets. The Plan’s policy for allocation of invested assets is established and may be amended by each Retirement Board of Authority through a majority vote. It is the policy of both Boards to pursue an investment strategy that reduces risk through the prudent diversification of the portfolio across a broad selection of specific asset classes. Assets held in the Plan are limited to those within the terms of the trust agreement and the participation agreement, any applicable plan documents and in accordance with California Code Section 53620 through 53622. The investment policy has a long-term focus. It discourages both major shifts of asset class allocations over a short time span and, except for liquidity purposes, the use of cash equivalents. There is no established net rate of return or asset allocation policy. The JPA or Futuris did not violate any provisions of the investment policy during the fiscal year ended June 30, 2017. The District participates with other colleges in the Balanced Fund Master Trust held by Union Bank as trustee for the JPA. The Balanced Fund is comprised of various mutual funds and the District owns a pro-rata interest in the pool. In a Master Trust, the market value of the pool is converted to units valued at $1.00 per unit and the District’s individual statement reflects the units that they own in the pool. Master Trusts are unitized to the dollar and thus, the market and cost are the same. Income earnings, gains, losses and expense are allocated pro rata to all colleges participating in the Master Trust. At June 30, 2017, all Plan investments were in either master trusts or mutual funds. The Plan held no investments in any one organization that represented 5% or more of fiduciary net position. For the year ended June 30, 2017, the annual money-weighted rate of return on investments, net of investment expense, was not available.
-31-
COAST COMMUNITY COLLEGE DISTRICT NOTES TO THE FINANCIAL STATEMENTS For the Fiscal Year Ended June 30, 2017 NOTE 10: POST EMPLOYMENT HEALTHCARE BENEFITS Investment Valuation Investments are measured at fair value on a recurring basis. Recurring fair value measurements are those that GASB require or permit in the statement of net position at the end of each reporting period. Fair value measurements are categorized based on the valuation inputs used to measure an asset’s fair value: Level 1 inputs are quoted prices in active markets for identical assets; Level 2 inputs are significant other observable inputs; Level 3 inputs are significant unobservable inputs. The mutual funds held in the Master Trust are priced using a net asset value (NAV). The mutual funds may include several different underlying investments, including equities, bonds, real estate, and global securities. The NAV price is derived from the value of these investments, accrued income, anticipated cash flows (maturities), management fees, and other fund expenses. Certain investments within the fund may be deemed unobservable and not considered to be in an active market. The Plan’s investments’ fair value measurements at June 30, 2017 are presented herein. Fair Value Measurements Using
Investment Master Trust Mutual Fund - Fixed income Mutual Fund - Domestic equity Mutual Fund - International equity Mutual Fund - Real estate Total
$
$
Costs Level 1 Inputs Level 2 Inputs Level 3 Inputs 36,499,807 $ - $ - $ 36,499,807 17,565,999 17,563,900 9,292,889 9,257,143 5,796,791 5,757,357 2,461,840 2,459,749 71,617,326 $ 35,038,149 $ - $ 36,499,807
Actuarial Methods and Assumptions The District’s total OPEB liability and the net OPEB liability were measured using an actuarial valuation as of June 30, 2017. The total OPEB liability was determined by an actuarial valuation as of June 30, 2017, using the following actuarial assumptions, applied to all periods included in the measurement, unless otherwise specified herein.
-32-
COAST COMMUNITY COLLEGE DISTRICT NOTES TO THE FINANCIAL STATEMENTS For the Fiscal Year Ended June 30, 2017 NOTE 10: POST EMPLOYMENT HEALTHCARE BENEFITS Actuarial Methods and Assumptions Valuation date Measurement date Inflation Salary increases Investment rate of return Healthcare trend rate
June 30, 2017 June 30, 2017 2.75% 2.75% 6% 4%
Mortality rates were based on the rates used by CalPERS Active Mortality for Miscellaneous Employees 2014 tables and the 2009 rates used by STRS for the pension valuations. The long-term expected rate of return on Plan investments was determined using a buildingblock method in which best-estimate ranges of expected future real rates of return (expected returns, net of OPEB plan investment expense and inflation) are developed for each major asset class. These ranges are combined to produce the long-term expected rate of return by weighting the expected future real rates of return by the target asset allocation percentage and by adding expected inflation. The best estimates of arithmetic real rates of return for each major asset class included in the target asset allocation as of June 30, 2017 (see the discussion of the Plan’s investment policy) are shown herein. Long-term Asset Class - Community College League of California US large cap US small cap Long-term corporate bonds Short-term government fixed
Asset Allocation 60% 15% 20% 5%
Expected Real Rate of Return 7.80% 7.80% 5.30% 3.25% Long-term Expected Real Rate
Asset Allocation 50% 50%
Asset Class - Futuris US Domestic stock Long-term corporate bonds
of Return 7.80% 5.30%
The discount rate used to measure the total OPEB liability was 6.0 percent. The valuation used historic 30 year real rates of return for each asset class along with assumed long-term inflation assumptions to set the discount rate. The Plan’s fiduciary net position was projected to be available to make all projected future benefit payments of current Plan members. Therefore, the long-term expected rate of return on Plan investments was applied to all periods of projected benefit payments to determine the total OPEB liability. Since the most recent GASB 45 valuation, the following changes have been made: -33-
COAST COMMUNITY COLLEGE DISTRICT NOTES TO THE FINANCIAL STATEMENTS For the Fiscal Year Ended June 30, 2017 NOTE 10: POST EMPLOYMENT HEALTHCARE BENEFITS
The discount rate and expected rate of return on assets was changed from 6.8% to 6.0%
Changes in the Net OPEB Liability (Asset) Increase (Decrease) Total OPEB Liability (a) Balances at June 30, 2016
$
Changes for the year: Service cost Interest Employer contributions Net investment income
$
65,693,627
Net OPEB Liability (a) - (b) $
4,772,670 5,885,743
Net changes $
(6,533,048)
(6,533,048) (106,841)
4,125,365
5,923,699
103,166,889
$
71,617,326
33,347,897 4,772,670 5,885,743 (6,533,048) (6,030,540)
6,533,048 6,030,540
Benefit payments Administrative expenses
Balances at June 30, 2017
99,041,524
Plan Fiduciary Net Position (b)
106,841 (1,798,334) $
31,549,563
The District’s net OPEB liability calculated using the discount rate of 6.0 percent, as well as what the net OPEB liability would be if it were calculated using a discount rate that is 1percentage-point lower (5.0 percent) or 1-percentage-point higher (7.0 percent) than the current rate is shown herein. Discount rate 1% decrease (5.0%) Current discount rate (6.0%) 1% increase (7.0%)
Net OPEB Liability $ 40,611,844 31,549,563 23,688,277
The District’s net OPEB liability calculated using the current healthcare cost trend rate of 6.5 percent decreasing to 4.0 percent, as well as what the net OPEB liability would be if it were calculated using healthcare cost trend rates that are 1-percentage-point lower (5.5 percent decreasing to 3.0 percent) or 1-percentage-point higher (7.5 percent decreasing to 5.0 percent) than the current rate is shown herein. Healthcare trend rate
Net OPEB Liability
1% decrease (3.0%) Current healthcare trend rate (4.0%) 1% increase (5.0%)
$
OPEB expense OPEB expense for the year ended June 30, 2017 was $4,734,714. -34-
27,103,734 31,549,563 36,325,161
COAST COMMUNITY COLLEGE DISTRICT NOTES TO THE FINANCIAL STATEMENTS For the Fiscal Year Ended June 30, 2017
NOTE 11: EMPLOYEE RETIREMENT PLANS Qualified employees are covered under multiple-employer defined benefit pension plans maintained by agencies of the State of California. Academic employees are members of the California State Teachers’ Retirement System (CalSTRS) and classified employees are members of the California Public Employees’ Retirement System (CalPERS). As of June 30, 2017, the District’s proportionate share of the net pension liabilities, pension expense, and deferred inflows of resources and deferred outflows of resources for each of the retirement plans as shown herein.
Pension Plan CalSTRS - STRP CalPERS - Schools Pool Plan Total
Proportionate Proportionate Deferred Proportionate Share of Deferred Share of Net Outflows of Share of Inflows of Pension Liability Resources Pension Expense Resources $ 114,042,210 $ 23,966,331 $ 5,950,659 $ 11,535,645 97,624,556 27,883,744 6,457,959 10,610,309 51,850,075 $ 12,408,618 $ 22,145,954 $ 211,666,766 $
The details for the governmental fund and the fiduciary fund are as shown herein.
Entity: Governmental Fund Fiduciary Fund Total
Proportionate Proportionate Deferred Proportionate Share of Deferred Share of Net Outflows of Share of Inflows of Pension Liability Resources Pension Expense Resources $ 209,753,325 $ 51,303,554 $ 12,282,042 $ 21,937,992 1,913,441 546,521 126,576 207,962 51,850,075 $ 12,408,618 $ 22,145,954 $ 211,666,766 $
The details of each plan are as included herein. California State Teachers’ Retirement System (CalSTRS) Plan Description The District contributes to the State Teachers’ Retirement Plan (STRP) administered by the California State Teachers’ Retirement System (CalSTRS). STRP is a cost-sharing multipleemployer public employee retirement system defined benefit pension plan. Benefit provisions are established by State statutes, as legislatively amended, within the State Teachers’ Retirement Law.
-35-
COAST COMMUNITY COLLEGE DISTRICT NOTES TO THE FINANCIAL STATEMENTS For the Fiscal Year Ended June 30, 2017 NOTE 11: EMPLOYEE RETIREMENT PLANS Benefits Provided The STRP provides retirement, disability and survivor benefits to beneficiaries. Benefits are based on members’ final compensation, age and years of service credit. Members hired on or before December 31, 2012, with five years of credited service are eligible for the normal retirement benefit at age 60. Members hired on or after January 1, 2013, with five years of credited service are eligible for the normal retirement benefit at age 62. The normal retirement benefit is equal to 2.0 percent of final compensation for each year of credited service. The STRP is comprised of four programs: Defined Benefit Program, Defined Benefit Supplement Program, Cash Balance Benefit Program and Replacement Benefits Program. The STRP holds assets for the exclusive purpose of providing benefits to members and beneficiaries of these programs. CalSTRS also uses plan assets to defray reasonable expenses of administering the STRP. Although CalSTRS is the administrator of the STRP, the state is the sponsor of the STRP and obligor of the trust. In addition, the state is both an employer and nonemployer contributing entity to the STRP. The District contributes to the STRP Defined Benefit Program and STRP Defined Benefit Supplement Program, thus disclosures are not included for the other plans. The STRP provisions and benefits in effect at June 30, 2017, are summarized as shown herein. Provisions and Benefits Hire date Benefit formula Benefit vesting schedule Benefit payments Retirement age Monthly benefits as a percentage of eligible compensation Required employee contribution rate Required employer contribution rate Required state contribution rate
CalSTRS-STRP Defined Benefit Program and Supplement Program On or Before December 31, 2012 On or after January 1, 2013 2% at 60 2% at 62 5 years of service 5 years of service Monthly for life Monthly for life 60 62 2.0%-2.4% 10.25% 12.58% 8.828%
2.0%-2.4% 9.21% 12.58% 8.828%
Contributions Required member, District and State of California contribution rates are set by the California Legislature and Governor and detailed in Teachers’ Retirement Law. The contributions rates are expressed as a level percentage of payroll using the entry age normal actuarial method. The contribution rates for each plan for the year ended June 30, 2017 are presented above and the total District contributions were $9,698,103.
-36-
COAST COMMUNITY COLLEGE DISTRICT NOTES TO THE FINANCIAL STATEMENTS For the Fiscal Year Ended June 30, 2017 NOTE 11: EMPLOYEE RETIREMENT PLANS Pension Liabilities, Pension Expense, and Deferred Outflows of Resources and Deferred Inflows of Resources Related to Pensions At June 30, 2017, the District reported a liability for its proportionate share of the net pension liability that reflected a reduction for State pension support provided to the District. The amount recognized by the District as its proportionate share of the net pension liability, the related state support, and the total portion of the net pension liability that was associated with the District were as shown herein. Balance Proportionate Share of Net Pension Liability
June 30, 2017
District proportionate share of net pension liability State's proportionate share of the net pension liability associated with the District Total
$ $
114,042,210 64,931,754 178,973,964
The net pension liability was measured as of June 30, 2016. The District’s proportion of the net pension liability was based on a projection of the District’s long-term share of contributions to the pension plan relative to the projected contributions of all participating school districts and the State, actuarially determined. At June 30, 2016, the District’s proportion was 0.1410%. For the year ended June 30, 2017, the District recognized pension expense of $11,535,645 and revenue of $6,276,338 for support provided by the state. At June 30, 2017, the District reported deferred outflows of resources and deferred inflows of resources related to pensions from the sources shown herein. Deferred Pension Deferred Outflows and Inflows of Resources Pension contributions subsequent to measurement date Difference between expected and actual experience Difference in proportion Net differences between projected and actual earnings on plan investments Total
Deferred
Outflows of
Inflows of
Resources
Resources
$
9,698,103 $
$
5,201,928 9,066,300 23,966,331 $
2,781,930 3,168,729 5,950,659
The deferred outflows of resources related to pensions resulting from District contributions subsequent to the measurement date will be recognized as a reduction of the net pension liability in the year ended June 30, 2018. The net difference between projected and actual earnings on plan investments is amortized over a five year period on a straight-line basis. One-fifth is recognized in pension expense during the measurement period and the remaining amount is deferred and will be amortized over the remaining four-year period. The remaining net differences between projected and actual earnings on plan investments shown above represents the unamortized balance relating to the current measurement period and the prior measurement period on a net basis. -37-
COAST COMMUNITY COLLEGE DISTRICT NOTES TO THE FINANCIAL STATEMENTS For the Fiscal Year Ended June 30, 2017 NOTE 11: EMPLOYEE RETIREMENT PLANS All other deferred inflows of resources and deferred outflows of resources are amortized over the expected average remaining service life (EARSL) of the plan participants. The EARSL for the STRP for the June 30, 2016 measurement date is 7 years. The first year of amortization is recognized in pension expense for the year the gain or loss occurs. The remaining amounts are deferred and will be amortized over the remaining periods not to exceed 6 years. The remaining amount will be recognized to pension expense as shown herein. Amortization
Year Ending June 30, 2018 2019 2020 2021 2022 2023
$
2,315,185 2,315,185 2,315,185 2,315,185 48,608 (991,779)
Total
$
8,317,569
Actuarial Methods and Assumptions Total pension liability for STRP was determined by applying update procedures to a financial reporting actuarial valuation as of June 30, 2015, and rolling forward the total pension liability to June 30, 2016. The financial reporting actuarial valuation as of June 30, 2015 used the methods and assumptions shown herein, applied to all prior periods included in the measurement. Actuarial Methods and Assumptions Valuation Date Measurement Date Experience Study Actuarial Cost Method Discount Rate Investment Rate of Return Consumer Price Inflation Wage Growth
June 30, 2015 June 30, 2016 July 1, 2006 through June 30, 2010 Entry Age Normal 7.60% 7.60% 3.00% 3.75%
CalSTRS uses custom mortality tables to best fit the patterns of mortality among its members. These custom tables are based on RP2000 series tables adjusted to fit CalSTRS experience. The long-term expected rate of return on pension plan investments was determined using a building-block method in which best estimate ranges of expected future real rates of return (expected returns, net of pension plan investment expense, and inflation) are developed for each major asset class. The best estimate ranges were developed using capital market assumptions from CalSTRS general investment consultant. Based on the model for CalSTRS consulting actuary’s investment practice, a best estimate range was determined by assuming the portfolio is -38-
COAST COMMUNITY COLLEGE DISTRICT NOTES TO THE FINANCIAL STATEMENTS For the Fiscal Year Ended June 30, 2017 NOTE 11: EMPLOYEE RETIREMENT PLANS re-balanced annually and that the annual returns are lognormally distributed and independent from year to year to develop an expected percentiles for the long-term distribution of annualized returns. The assumed asset allocation is based on board policy for target asset allocation in effect on February 2, 2012, the date the current experience study was approved by the board. Best estimates of 20-year geometric real rates of return and the assumed asset allocation for each major asset class used as input to develop the actuarial investment rate of return are summarized in the following table: Long-term Asset Class Global equity Private equity Real estate Absolute return risk mitigating strategies Inflation sensitive Fixed income Cash/liquidity
Assumed Asset
Expected Real
Allocation 47% 13% 13% 9% 4% 12% 2%
Rate of Return 6.30% 9.30% 5.20% 2.90% 3.80% 0.30% -1.00%
Discount Rate The discount rate used to measure the total pension liability was 7.60%. The projection of cash flows used to determine the discount rate assumed the contributions from plan members and employers will be made at statutory contribution rates. Projected inflows from investment earnings were calculated using the long-term assumed investment rate of return (7.60%) and assuming that contributions, benefit payments, and administrative expense occurred midyear. Based on these assumptions, the STRP’s fiduciary net position was projected to be available to make all projected future benefit payments to current plan members. Therefore, the long-term assumed investment rate of return was applied to all periods of projected benefit payments to determine total pension liability. The District’s proportionate share of the net pension liability calculated using the current discount rate as well as what the net pension liability would be if it were calculated using a discount rate that is one percent lower or higher than the current rate is shown herein. Net Pension Discount rate 1% decrease (6.60%) Current discount rate (7.60%) 1% increase (8.60%)
$
-39-
Liability 164,132,460 114,042,210 72,440,160
COAST COMMUNITY COLLEGE DISTRICT NOTES TO THE FINANCIAL STATEMENTS For the Fiscal Year Ended June 30, 2017 NOTE 11: EMPLOYEE RETIREMENT PLANS Plan Fiduciary Net Position Detailed information about the STRP’s plan fiduciary net position is available in a separate comprehensive annual financial report for CalSTRS. Copies of the CalSTRS annual financial report may be obtained from CalSTRS, 7667 Folsom Boulevard, Sacramento, CA 95826. California Public Employees Retirement System (CalPERS) Plan Description Qualified employees are eligible to participate in the Schools Pool Plan under the California Public Employees’ Retirement System (CalPERS), a cost-sharing multiple-employer public employee retirement system defined benefit pension plan administered by CalPERS. The plan provides retirement and disability benefits, annual cost-of-living adjustments, and death benefits to plan members and beneficiaries. Benefit provisions are established by State statutes, as legislatively amended, within the Public Employees’ Retirement Law. Benefits Provided CalPERS provides service retirement and disability benefits, annual cost of living adjustments, and death benefits to plan members, who must be public employees and beneficiaries. Benefits are based on years of service credit, a benefit factor, and the member’s final compensation. Members hired on or before December 31, 2012, with five years of total service are eligible to retire at age 50 with statutorily reduced benefits. Members hired on or after January 1, 2013, with five years of total service are eligible to retire at age 52 with statutorily reduced benefits. All members are eligible for non-duty disability benefits after 5 years of service. The Basic Death Benefit is paid to any member’s beneficiary if the member dies while actively employed. An employee’s eligible survivor may receive the 1957 Survivor Benefit if the member dies while actively employed, is at least age 50 (or 52 for members hired on or after January 1, 2013), and has at least 5 years of credited service. The cost of living adjustments for each plan are applied as specified by the Public Employees’ Retirement Law. The CalPERS provisions and benefits in effect at June 30, 2017, are summarized herein.
-40-
COAST COMMUNITY COLLEGE DISTRICT NOTES TO THE FINANCIAL STATEMENTS For the Fiscal Year Ended June 30, 2017 NOTE 11: EMPLOYEE RETIREMENT PLANS Provisions and Benefits Hire date Benefit formula Benefit vesting schedule Benefit payments Retirement age Monthly benefits as a percentage of eligible compensation Required employee contribution rate Required employer contribution rate
CalPERS-Schools Pool Plan On or Before December 31, 2012 2% at 55 5 years of service Monthly for life 55
On or after January 1, 2013 2% at 62 5 years of service Monthly for life 62
1.1%-2.5% 7.000% 13.888%
1.0%-2.5% 6.000% 13.888%
Contributions Section 20814(c) of the California Public Employees’ Retirement Law requires that the employer contribution rates for all public employers be determined on an annual basis by the actuary and shall be effective on the July 1 following notice of a change in the rate. Total plan contributions are determined through the CalPERS annual actuarial valuation process. The actuarially determined rate is the estimated amount necessary to finance the costs of benefits earned by employees during the year, with an additional amount to finance any unfunded accrued liability. The District is required to contribute the difference between the actuarially determined rate and the contribution rate of employees. The contributions rates are expressed as percentage of annual payroll. The contribution rates for each plan for the year ended June 30, 2017 are as presented above and the total District contributions were $8,536,763. Pension Liabilities, Pension Expense, Deferred Outflows of Resources, and Deferred Inflows of Resources Related to Pensions As of June 30, 2017, the District reported net pension liabilities for its proportionate share of the CalPERS net pension liability totaling $97,624,556. The net pension liability was measured as of June 30, 2016. The total pension liability for CalPERS was determined by applying update procedures to a financial reporting actuarial valuation as of June 30, 2015 and rolling forward the total pension liability to June 30, 2016. The District’s proportion of the net pension liability was based on a projection of the District’s long-term share of contributions to the pension plan relative to the projected contributions of all participating school districts, actuarially determined. At June 30, 2016, the District’s proportion was 0.4943%. For the year ended June 30, 2017, the District recognized pension expense of $10,610,309. At June 30, 2017, the District reported deferred outflows of resources and deferred inflows of resources related to pensions from the sources herein.
-41-
COAST COMMUNITY COLLEGE DISTRICT NOTES TO THE FINANCIAL STATEMENTS For the Fiscal Year Ended June 30, 2017 NOTE 11: EMPLOYEE RETIREMENT PLANS
Pension Deferred Outflows and Inflows of Resources Pension contributions subsequent to measurement date Difference between expected and actual experience Changes of assumptions Difference in proportion Net differences between projected and actual earnings on plan investments Total
$
Deferred
Deferred
Outflows of
Inflows of
Resources
Resources
8,536,763 $ 4,198,791 2,933,036 3,524,923
$
15,148,190 27,883,744 $
6,457,959
The deferred outflows of resources related to pensions resulting from District contributions subsequent to the measurement date will be recognized as a reduction of the net pension liability in the year ended June 30, 2018. The net difference between projected and actual earnings on plan investments is amortized over a five year period on a straight-line basis. One-fifth is recognized in pension expense during the measurement period and the remaining amount is deferred and will be amortized over the remaining four-year period. The remaining net differences between projected and actual earnings on plan investments shown above represents the unamortized balance relating to the current measurement period and the prior measurement period on a net basis. All other deferred inflows of resources and deferred outflows of resources are amortized over the expected average remaining service life (EARSL) of the plan participants. The EARSL for the STRP for the June 30, 2016 measurement date is 3.9 years. The first year of amortization is recognized in pension expense for the year the gain or loss occurs. The remaining amounts are deferred and will be amortized over the remaining periods not to exceed 2.9 years. The remaining amounts will be recognized to pension expense as show herein: Amortization 615,766 1,670,591 6,649,122 3,953,543 $ 12,889,022
Year Ending June 30, 2018 2019 2020 2021 Total
$
Actuarial Methods and Assumptions Total pension liability for the Schools Pool Plan was determined by applying update procedures to a financial reporting actuarial valuation as of June 30, 2015, and rolling forward the total pension liability to June 30, 2016. The financial reporting actuarial valuation as of June 30, 2015 used the methods and assumptions shown herein, applied to all prior periods included in the measurement. -42-
COAST COMMUNITY COLLEGE DISTRICT NOTES TO THE FINANCIAL STATEMENTS For the Fiscal Year Ended June 30, 2017 NOTE 11: EMPLOYEE RETIREMENT PLANS Actuarial Methods and Assumptions Valuation Date Measurement Date Experience Study Actuarial Cost Method Discount Rate Investment Rate of Return Consumer Price Inflation Wage Growth
June 30, 2015 June 30, 2016 July 1, 1997 through June 30, 2011 Entry Age Normal 7.65% 7.50% 2.75% Varies by entry age and service
Mortality assumptions are based on mortality rates resulting from the most recent CalPERS experience study adopted by the CalPERS Board. For purposes of the post-retirement mortality rates, those revised rates include five years of projected ongoing mortality improvement using Scale AA published by the Society of Actuaries. In determining the long-term expected rate of return, CalPERS took into account both short-term and long-term market return expectations as well as the expected pension fund cash flows. Using historical returns of all the funds’ asset classes, expected compound returns were calculated over the short-term (first 10 years) and the long-term (11-60 years) using a building-block approach. Using the expected nominal returns for both short-term and long-term, the present value of benefits was calculated for each fund. The expected rate of return was set by calculating the single equivalent expected return that arrived at the same present value of benefits for cash flows as the one calculated using both short-term and long-term returns. The expected rate of return was then set equivalent to the single equivalent rate calculated above and rounded down to the nearest one quarter of one percent. The target allocation and best estimates of arithmetic real rates of return for each major asset class are summarized herein. Long-term Asset Class Global equity Global debt securities Private equity Real estate Infrastructure and Forestland Inflation assets Liquidity
Assumed Asset
Expected Real
Allocation 51% 20% 10% 10% 2% 6% 1%
Rate of Return 5.71% 2.43% 6.95% 5.13% 5.09% 3.36% -1.05%
Discount Rate The discount rate used to measure the total pension liability was 7.65%. The projection of cash flows used to determine the discount rate assumed the contributions from plan members and employers will be made at statutory contribution rates. Based on these assumptions, the School -43-
COAST COMMUNITY COLLEGE DISTRICT NOTES TO THE FINANCIAL STATEMENTS For the Fiscal Year Ended June 30, 2017 NOTE 11: EMPLOYEE RETIREMENT PLANS Employer Pool fiduciary net position was projected to be available to make all projected future benefit payments to current plan members. Therefore, the long-term assumed investment rate of return was applied to all periods of projected benefit payments to determine total pension liability. The District’s proportionate share of the net pension liability calculated using the current discount rate as well as what the net pension liability would be if it were calculated using a discount rate that is one percent lower or higher than the current rate is shown herein. Net Pension Liability
Discount rate 1% decrease (6.65%) Current discount rate (7.65%) 1% increase (8.65%)
$
145,656,381 97,624,556 57,628,609
Plan Fiduciary Net Position Detailed information about CalPERS School Employer plan fiduciary net position is available in a separate comprehensive annual financial report. Copies of the CalPERS annual financial report may be obtained from the CalPERS Executive Office, 400 P Street, Sacramento, CA 95814. Public Agency Retirement System (PARS) Plan Description The Public Agency Retirement System (PARS) is a defined contribution plan qualifying under §401(a) and §501 of the Internal Revenue Code. The plan covers part-time, seasonal and temporary employees and employees not covered by §3121(b)(7)(F) of the Internal Revenue Code. The benefit provisions and contribution requirements of plan members and the District are established and may be amended by the PARS Board of Trustees. Funding Policy Contributions of 7.5% of covered compensation of eligible employees are made by the employer and employee. Total contributions, employer and employee combined, were made in the amount of $745,386 during the fiscal year. The total amount of covered compensation was $12,166,745 Total contributions made are 100% of the amount of contributions required for fiscal year 201516. NOTE 12: INTERFUND TRANSACTIONS Interfund transfers consist of operating transfers from funds receiving resources to funds through
-44-
COAST COMMUNITY COLLEGE DISTRICT NOTES TO THE FINANCIAL STATEMENTS For the Fiscal Year Ended June 30, 2017 NOTE 12: INTERFUND TRANSACTIONS which the resources are to be expended. Interfund receivables and payables result when the interfund transfer is transacted after the close of the fiscal year. Interfund activity within the government funds has been eliminated in the basic financial statements. NOTE 13: INTERNAL SERVICE FUNDS The District is exposed to various risks of loss related injuries to employees and medical claims. During the fiscal year, the District maintained an Internal Service Fund to account for and finance its uninsured risks of loss. The Self Insurance Fund provides coverage for up to a maximum of $250,000 for each worker’s compensation claim filed prior to June 30, 1998. During July 1, 1998, the District is fully insured for workers’ compensation. The Self Insurance Fund also provides for a maximum of $275,000 for each claim each plan year for medical claims. The District purchases commercial insurance for claims in excess of coverage provided by the fund and for all other risks of loss. Settled claims have not exceeded this commercial coverage in any of the past three years. Funding of the Internal Service Fund is based on estimates of the amounts needed to pay prior and current year claims and premiums. At June 30, 2017, the District accrued the claims liability in accordance with GASB standards, which requires that a liability for claims be reported if information prior to the issuance of the financial statements indicates that it is probable that a liability has been incurred at the date of the financial statements and the amount of the loss can be reasonably estimated. The present value of the liability, estimated at $3,287,265, is included in accrued liabilities. Changes in the reported liability are shown herein. Reported Liability Workers' Compensation Health and Other Benefits Total
Current Year Beginning Fiscal Claims and Changes Ending Fiscal in Estimates Claim Payments Year Liability Year Liability $ 466,931 $ (70,164) $ 61,373 $ 335,394 2,798,550 22,861,514 22,708,193 2,951,871 $ 3,265,481 $ 22,791,350 $ 22,769,566 $ 3,287,265
NOTE 14: JOINT POWERS AGREEMENTS The District participates in four Joint Powers Authority (JPA) entities by written agreement; the Protected Insurance Program for Schools (PIPS), the Schools Association for Excess Risk (SAFER), the CSAC Excess Insurance Authority (CSAC), and the Statewide Association of Community Colleges (SWACC).
-45-
COAST COMMUNITY COLLEGE DISTRICT NOTES TO THE FINANCIAL STATEMENTS For the Fiscal Year Ended June 30, 2017 NOTE 14: JOINT POWERS AGREEMENTS PIPS is a California Joint Power Authority (JPA) insurance pool and provides workers' compensation reinsurance protection to its public schools and community college membership throughout California. This is a finite risk sharing pool that transfers risk away from the members to the insurance market. Member premiums are determined based on payroll expense and District loss experience based upon claims incurred. The SAFER Joint Power Authority is a general liability and property loss excess insurance pool which provides coverage for liability losses from $1,000,000 to $50,000,000 for liability, and $5,000,000 to $250,000,000 for excess property coverage, dependent upon selected coverage sought by each member. CSAC Excess Insurance Authority’s Master Rolling Owner Controlled Insurance Program covers liability, property, and workers’ compensation job-site risks of construction activities for District projects. District as Owner, Construction Manager, General Contractor, contractors and sub-contractors of all tiers. CSAC Membership is comprised of 315 various counties, cities, schools, special districts, and other JPAs. Premiums are determined for each construction project or projects. The Statewide Association of Community Colleges Joint Power authority (“SWACC”) was established to provide a comprehensive program of property and liability coverage for more than 40 community colleges in California. The program’s general objectives are to formulate, develop and administer, on behalf of the member public agencies, a program of insurance, to obtain lower costs for that coverage, and to develop comprehensive loss control programs. Each of the above JPAs is governed by a board consisting of a representative from each member district. Each governing board controls the operations of its JPA, including selection of management and approval of members, independent of any influence by the District beyond the District’s representation on the governing boards. Each JPA is independently accountable for its fiscal matters. Each JPA maintains its own accounting records. Budgets are not subject to any approval other than that of the respective governing boards. Member districts share surpluses and deficits proportionately to their participation in the JPA. The relationships between the District and the JPAs are such that none of the JPAs are component units of the District for financial reporting purposes. The most recent condensed financial information available for PIPS, SAFER, CSAC, and SWACC is shown herein.
-46-
COAST COMMUNITY COLLEGE DISTRICT NOTES TO THE FINANCIAL STATEMENTS For the Fiscal Year Ended June 30, 2017 NOTE 14: JOINT POWERS AGREEMENTS
JPA Condensed Financial Information
PIPS 6/30/2017
SAFER 6/30/2016
CSAC 6/30/2016
SWACC 6/30/2016
(Audited)
(Audited)
(Audited)
(Audited)
Total assets Total liabilities
$
129,260,118 $ 111,815,654
23,297,652 $ 21,155,886
741,987,349 $ 604,314,732
53,650,572 25,243,178
Fund balance
$
17,444,464 $
2,141,766 $
137,672,617 $
28,407,394
787,536,407 762,270,435
18,776,551 20,885,850
Total revenues Total expenditures
301,089,852 296,996,362
Net increase/(decrease) in Fund Balance
$
56,004,631 55,390,780
4,093,490 $
613,851 $
25,265,972 $
(2,109,299)
NOTE 15: FUNCTIONAL EXPENSE Operating expenses are reported by natural classification in the statement of revenues, expenses and change in net position. A schedule of expenses by function is shown herein. Supplies, materials, and other operating expenses and Functional Expense
Salaries
Instructional activities Academic support Student services Operation and maintenance of plant Instructional support services Community services and economic development Ancillary services and auxiliary operations Physical property and related acquisitions Transfers, student aid and other outgo Depreciation expense
$
Total
$
66,896,199 17,424,562 22,798,362 6,667,852 24,945,477
Employee Benefits $
348,212 14,274,718 926,761
30,431,839 7,926,631 10,371,234 3,033,282 11,347,981
Financial Aid
services $
158,406 5,561,212 422,302
5,017,673 $ 3,698,398 4,449,008 5,135,807 19,805,003
Depreciation $
Total $
13,336 5,085,958 1,644,123
519,954 24,921,888 2,993,186 56,592,053 21,745,349
56,592,053 21,745,349 154,282,143
$
69,252,887
$
44,849,306
$
56,592,053
$
21,745,349
102,345,711 29,049,591 37,618,604 14,836,941 56,098,461
$
346,721,738
NOTE 16: CUMULATIVE EFFECT OF ACCOUNTING CHANGES The beginning net position of the basic financial statements has been restated by a reduction of $51,801,643 to recognize the beginning balance of the OPEB liability of $33,347,897 and removal of the June 30, 2016 OPEB asset of $18,453,746 resulting from the implementation of GASB Statements No. 74 and No. 75 (See Note 10). NOTE 17: COMMITMENTS AND CONTINGENCIES Litigation The District is involved in various claims and legal actions arising in the ordinary course of business. In the opinion of management, the ultimate disposition of these matters will not have a material adverse effect on the District’s financial statements.
-47-
COAST COMMUNITY COLLEGE DISTRICT NOTES TO THE FINANCIAL STATEMENTS For the Fiscal Year Ended June 30, 2017 NOTE 17: COMMITMENTS AND CONTINGENCIES State and Federal Allowances, Awards, and Grants The District has received state and Federal funds for specific purposes that are subject to review and audit by the grantor agencies. Although such audits could generate expenditure disallowances under terms of the grants, it is believed that any required reimbursement will not be material. Purchase Commitments As of June 30, 2017, the District was committed under various capital expenditure purchase agreements for construction and modernization projects totaling approximately $74,800,000. Projects will be funded through bond proceeds, state funds and general funds. NOTE 18: GOVERNMENTAL ACCOUNTING STANDARDS BOARD STATEMENTS ISSUED, NOT YET EFFECTIVE GASB has issued pronouncements prior to June 30, 2017, that have effective dates that may impact future financial presentations; however, the impact of the implementation of each of the statements below to the District’s financial statements has not been assessed at this time. Statement No. 81 – Irrevocable Split-Interest Agreements This statement establishes guidance in order to improve accounting and financial reporting for irrevocable split-interest agreements by providing recognition and measurement guidance for situations in which a government is a beneficiary of the agreement. This Statement requires that a government that receives resources pursuant to an irrevocable split-interest agreement recognize assets, liabilities, and deferred inflows of resources at the inception of the agreement. Furthermore, this statement requires that a government recognize assets representing its beneficial interests in irrevocable split-interest agreements that are administered by a third party, if the government controls the present service capacity of the beneficial interests. This Statement requires that a government recognize revenue when the resources become applicable to the reporting period. The statement is effective for the fiscal year 2017-18. Statement No. 83 – Certain Asset Retirement Obligations This statement addresses accounting and financial reporting for certain asset retirement obligations when a legally enforceable liability is associated with the retirement of a tangible capital asset. The statement establishes criteria for determining the timing and pattern of recognition of a liability and a corresponding deferred outflow of resources. The statement is effective for the fiscal year 2018-19.
-48-
COAST COMMUNITY COLLEGE DISTRICT NOTES TO THE FINANCIAL STATEMENTS For the Fiscal Year Ended June 30, 2017 NOTE 18: GOVERNMENTAL ACCOUNTING STANDARDS BOARD STATEMENTS ISSUED, NOT YET EFFECTIVE Statement No. 85 – Omnibus 2017 The objective of the statement is to address practice issues that have been identified during implementation and application of certain GASB statements. Specific topics addressed in this statement are related to blended component units, goodwill, fair value measurement and application, and postemployment benefits (OPEB). The statement is effective for the fiscal year 2017-18. Statement No. 86 – Certain Debt Extinguishment Issues The objective of the statement is to improve consistency in accounting and financial reporting for in-substance defeasance of debt by providing guidance for transactions in which cash and other monetary assets acquired with only existing resources – resources other than the proceeds of refunding debt – are placed in an irrevocable trust for the sole purpose of extinguishing debt. This statement also improves accounting and financial report for prepaid insurance on debt that is extinguished and notes to the financial statements for debt that is in-substance defeased. The statement is effective for the fiscal year 2017-18. Statement No. 87 – Leases The objective of the statement is to improve the accounting and financial reporting for leases by requiring recognition of certain lease assets and liabilities for leases that previously were classified as operating leases. Inflows of resources or outflows of resources will be recognized based on the payment provisions of the contract. The statement establishes a single model for lease accounting based on the foundational principle that leases are financings of the right to use an underlying asset. The statement is effective for the fiscal year 2020-21.
-49-
REQUIRED SUPPLEMENTARY INFORMATION
-50-
COAST COMMUNITY COLLEGE DISTRICT SCHEDULE OF CHANGES IN THE NET OPEB LIABILITY AND RELATED RATIOS For the Fiscal Year Ended June 30, 2017
Total OPEB Liability
2017
Service Cost Interest
$
Benefit Payments
(6,533,048) 4,125,365 99,041,524 $ 103,166,889
Net Change in Total OPEB Liability Total OPEB Liability - beginning Total OPEB Liability - ending (a) Plan Fiduciary Net Position
4,772,670 5,885,743
2017
Contributions - Employer Net Investment Income
$
6,533,048 6,030,540
Benefit Payments
(6,533,048)
Administrative Expense
(106,841) 5,923,699 65,693,627
Net Change in Plan Fiduciary Net Position Plan Fiduciary Net Position - beginning Plan Fiduciary Net Position - ending (b)
$ 71,617,326
Net OPEB Liability - ending (a) - (b)
$ 31,549,563
Plan Fiduciary Net Position as a Percentage of the Total OPEB Liability Covered payroll
69.42% $ 110,477,993
Net OPEB liability as a percentage of covered payroll
28.56%
Note: Accounting standards require presentation of 10 years of information. However, the information in this schedule is not required to be presented retroactively. Years will be added to this schedule as future data becomes available.
See the accompanying notes to the required supplementary information.
-51-
COAST COMMUNITY COLLEGE DISTRICT SCHEDULE OF POSTEMPLOYEMENT HEALTHCARE BENEFITS EMPLOYER CONTRIBUTION For the Fiscal Year Ended June 30, 2017
OPEB Contributions
2017
Actuarially Determined Contribution (ADC) Contributions in relation to the ADC Contribution deficiency (excess)
$ $
District's covered payroll
$ 110,477,993
Contributions as a percentage of covered payroll
4,594,742 6,390,000 (1,795,258)
5.78%
See the accompanying notes to the required supplementary information.
-52-
COAST COMMUNITY COLLEGE DISTRICT SCHEDULE OF POSTEMPLOYMENT HEALTHCARE BENEFITS MONEYWEIGHTED RATE OF RETURN ON PLAN ASSETS For the Fiscal Year Ended June 30, 2017
Year
Annual money-weighted rate of return, net of investment expense
2017
NA
Note: Accounting standards require presentation of 10 years of information. However, the information in this schedule is not required to be presented retroactively. Years will be added to this schedule as future data becomes available.
See the accompanying notes to the required supplementary information.
-53-
COAST COMMUNITY COLLEGE DISTRICT SCHEDULE OF THE DISTRICT’S PROPORTIONATE SHARE OF THE NET PENSION LIABILITY For the Fiscal Year Ended June 30, 2017
California State Teachers' Retirement System - State Teachers' Retirement Plan District's proportion of the net pension liability (assets)
2015
2016
2017
0.1360%
0.1460%
0.1410%
District's proportionate share of the net pension liability (asset) $ 79,474,320 $ 98,293,040 $114,042,210 51,986,043 64,931,754 State's proportionate share of the net pension liability (asset) associated with the District 47,990,508 Total
$127,464,828 $150,279,083 $178,973,964
District's covered payroll
$ 60,100,000 $ 67,800,000 $ 71,000,000
District's proportionate share of the net pension liability (asset) as a percentage of its covered payroll
132.24%
144.97%
160.62%
Plan fiduciary net position as a percentage of the total pension liability
77.00%
74.00%
70.04%
California Public Employees' Retirement System - Schools Pool Plan
2015
2016
2017
0.5164%
0.5156%
0.4943%
District's proportion of the net pension liability (assets) District's proportionate share of the net pension liability (asset)
$ 58,623,973 $ 75,999,949 $ 97,624,556
District's covered payroll
$ 53,300,000 $ 56,700,000 $ 59,700,000
District's proportionate share of the net pension liability (asset) as a percentage of its covered payroll
109.99%
134.04%
163.53%
Plan fiduciary net position as a percentage of the total pension liability
83.37%
79.43%
73.90%
Note: Accounting standards require presentation of 10 years of information. However, the information in this schedule is not required to be presented retroactively. Years will be added to this schedule as future data becomes available. The amounts for covered payroll are reported as of the previous fiscal year to align with the measurement date of the net pension liability.
See the accompanying notes to the required supplementary information.
-54-
COAST COMMUNITY COLLEGE DISTRICT SCHEDULE OF DISTRICT CONTRIBUTIONS – STRP AND CALPERS For the Fiscal Year Ended June 30, 2017
California State Teachers' Retirement System - State Teachers' Retirement Plan
2015
2016
2017
Contractually required contribution Contributions in relation to the contractually required contribution
$
6,022,305 6,022,305
$
Contribution deficiency (excess)
$
-
$
District's covered payroll
$ 67,800,000
$ 71,000,000
$ 77,100,000
8.88%
10.73%
12.58%
2015
2016
2017
6,678,600 $ 6,678,600 - $
7,075,135 $ 8,536,763 7,075,135 8,536,763 - $ -
Contributions as a percentage of covered payroll
California Public Employees' Retirement System - Schools Pool Plan
-
$
-
Contractually required contribution Contributions in relation to the contractually required contribution Contribution deficiency (excess)
$
District's covered payroll
$ 56,700,000
$ 59,700,000
$ 60,300,000
11.77%
11.85%
13.89%
Contributions as a percentage of covered payroll
$
7,618,862 $ 9,698,103 7,618,862 9,698,103
Note: Accounting standards require presentation of 10 years of information. However, the information in this schedule is not required to be presented retroactively. Years will be added to this schedule as future data becomes available.
See the accompanying notes to the required supplementary information.
-55-
COAST COMMUNITY COLLEGE DISTRICT NOTES TO THE REQUIRED SUPPLEMENTARY INFORMATION For the Fiscal Year Ended June 30, 2017 NOTE 1: PURPOSE OF SCHEDULES Schedule of Changes in the Net OPEB Liability and Related Ratios The schedule is intended to show trends about the changes in the District’s actuarially determined liability for postemployment benefits other than pensions. Benefit changes – None Changes of Assumptions - The discount rate and expected rate of return on assets was changed from 7.0% to 6.0% and the initial healthcare trend rate changed from 6.0% to 6.5% Schedule of Postemployment Healthcare Benefits Employer Contributions The schedule is intended to show trends about the amounts contributed in relation to the actuarially determined contribution. Actuarially determined contribution rates are calculated as of January 1, 18 months prior to the end of the fiscal year in which contributions are reported. Methods of assumptions used to determine contribution rates are: Actuarial Cost Method Inflation Salary Increases Investment Rate of Return Health Care Trend Rate
Entry age normal 2.75% 3% 6.0% 6.5% decreasing to 4.0% in 2023
Mortality rates were based on the rates used by CalPERS and the 2009 rates used by STRS for the pension valuations. Schedule of Postemployment Healthcare Benefits Money-Weighted Rate of Return on Plan Assets The schedule is intended to show trends about the rate of return on plan assets. Schedules of District’s Proportionate Share of the Net Pension Liability – STRP and CalPERS The schedule presents information on the District’s proportionate share of the net pension liability, the plans’ fiduciary net position and, when applicable, the State’s proportionate share of the net pension liability associated with the District. In the future, as data becomes available, 10 years of information will be presented.
-56-
COAST COMMUNITY COLLEGE DISTRICT NOTES TO THE REQUIRED SUPPLEMENTARY INFORMATION For the Fiscal Year Ended June 30, 2017 NOTE 1: PURPOSE OF SCHEDULES Schedules of District Contributions – STRP and CalPERS The schedule presents information on the District’s required contribution, the amounts actually contributed and any excess or deficiency related to the required contribution. In the future, as data becomes available, 10 years of information will be presented.
-57-
SUPPLEMENTARY INFORMATION
-58-
COAST COMMUNITY COLLEGE DISTRICT HISTORY AND ORGANIZATION For the Fiscal Year Ended June 30, 2017 The Coast Community College District encompasses approximately 105 square miles located in Orange County. The District currently operates Coastline College, Golden West College, Orange Coast College, and the District site. The District serves a large population in Orange County, which covers the communities of Costa Mesa, Fountain Valley, Garden Grove, Huntington Beach, Midway City, Newport Beach, Santa Ana, Seal Beach/Surfside, Stanton, Sunset Beach and Westminster. The Chancellor is the chief administrative officer and is assisted by vice chancellors, deans, directors, division chairpersons, and members of the faculty in bringing educational excellence to the community. The Board of Trustees has five members elected at large to overlapping four-year terms. The Board of Trustees and the District Administrators for the fiscal year ended June 30, 2017 were as follows: BOARD OF TRUSTEES Member Mr. David A. Grant Ms. Mary L. Hornbuckle Dr. Lorraine Prinsky Mr. Jerry Patterson Mr. Jim Moreno Mr. Javier Venegas
Office President Vice President Clerk of the Board Trustee Trustee Student Trustee
Term Expires 2018 2020 2020 2020 2018 2016-2017
DISTRICT ADMINISTRATORS Mr. John Weispfenning, Ph.D. Dr. Dennis Harkins Mr. Wes Bryan Dr. Loretta Adrian Dr. Andrew Dunn Dr. Cynthia Vyskocil Dr. Andreea M. Serban
Chancellor President, Orange Coast College President, Golden West College President, Coastline Community College Vice Chancellor, Finance and Administrative Services Vice Chancellor, Human Resources Vice Chancellor, Educational Services and Technology
-59-
COAST COMMUNITY COLLEGE DISTRICT SCHEDULE OF EXPENDITURES OF FEDERAL AWARDS For the Fiscal Year Ended June 30, 2017 Pass-Through Federal Catalog Entity Identifying Number Number
Program Name United States Department of Education Direct: Student Financial Aid Cluster: Federal Work Study Pell Grant Financial Aid Administrative Allowance Supplemental Education Opportunity Grant Federal Direct Student Loans Subtotal: Student Financial Aid Cluster Title III - Access 2 Success New Asian American Pacific Islander Generation Initiative Project RAISE: Regional Alliance in STEM Education
84.033 84.063 84.063 84.007 84.268
(1) (1) (1) (1) (1)
84.031A 84.031L 84.031C
(1) (1) (1)
Subtotal: Direct Programs
Total Program Expenditures
$
489,748 39,236,008 186,597 993,164 8,679,679 49,585,196 381,034 294,370 5,592 680,996
Pass-Through Program From California Community Colleges Chancellor's Office: Career and Technical Education (CTE): CTE Title I, Part C - Carl D. Perkins 84.048A CTE Transitions 84.048A Subtotal: CTE Pass-Through Program From California Department of Education: English Literacy and Civic Education Adult Education and Family Literacy Act - ESL - 231 Grant Subtotal: Passed-Through Programs Total: United States Department of Education United States Department of Agriculture Pass-Through Program From California Department of Education: Child Care Food Program Total: United States Department of Agriculture
(1) (1)
1,335,842 115,951 1,451,793
84.002A 84.002A
(1) (1)
21,861 61,056 82,917 51,800,902
10.558
(1)
65,997 65,997
(1)
136,608
15136
92,478
United States Department of Health and Human Services Pass-Through Program From California Community Colleges Chancellor's Office: Temporary Assistance for Needy Families (TANF) 93.558 Pass-Through Program From California Department of Education: Child Care and Development Block Grant 93.575 Pass-Through Program From Yosemite Community College District: Child Development Training Consortium 93.575
(1)
Subtotal: Passed-Through Programs Total: United States Department of Health and Human Services
See the accompanying notes to the supplementary information.
-60-
17,353 246,439 246,439
COAST COMMUNITY COLLEGE DISTRICT SCHEDULE OF EXPENDITURES OF FEDERAL AWARDS For the Fiscal Year Ended June 30, 2017
Pass-Through Federal Catalog Entity Identifying Program Name
Number
Total Program Expenditures
Number
Department of Defense Direct: CAE-2Y Pilot Grant Program - CAE Development of CAE Regional Resource Centers (CRRCs)
12.902
Passed-Through From Whatcom Community College: CyberWatch West CyberWatch West: Securing Cyber West
47.076 47.076
69,961
DUE-1361636 DUE-1500375
31,645 4,000
Subtotal: Passed-Through Programs Total: United States Department of Health and Human Services United States Department of Interior Pass-Through Program From Department of Parks and Recreation: Aquatic Center
35,645 105,606
15.622
68106
15,334
Total: United States Department of Interior
15,334 $ 52,234,278
Total Federal Programs Student Financial Aid Loan Programs: Loan Outstanding Perkins Loan Program, loan balance outstanding as of 06/30/17
84.038
(1) Pass-Through Entity Identifying Number not readily available or not applicable
See the accompanying notes to the supplementary information.
-61-
(1)
$
1,064,786
COAST COMMUNITY COLLEGE DISTRICT SCHEDULE OF STATE FINANCIAL ASSISTANCE - GRANTS For the Fiscal Year Ended June 30, 2017
Program Revenues Prior Year Program Name
Cash Received
State Categorical Aid Programs: Adult Block Grant $ 1,516,630 Board Financial Assistance Admin Allowance 1,497,607 Basic Skills (S.F.A.A) 451,731 Cal Grant 3,866,664 Cooperating Agencies Foster Youth Education Support 475,010 Disabled Student Programs & Service (DSPS) 3,215,624 Economic Opportunity (EOPS) 3,237,764 EOPS-Coop Agency Resource Education (CARE) 260,939 CalWORKs 707,444 Career Technical Education Enhancement 257,772 Career Technical Education Pathways Initiative 40,000 Instructional Equipment and Library Materials 4,026,431 Full-time Student Success Grant 1,012,485 Nursing Education 89,240 Schedule of Maintenance 1,857,331 State Capital Outlay (Prop 39 Clean Energy) 1,192,413 State Hospitals (Fairview Handicapped) 632,817 Strong Workforce Program 2,414,498 Student Equity Program 3,351,737 Student Success and Support Program (SSSP) Credit 7,096,167 SSSP-Noncredit 102,173 Total State Categorical Aid Programs
$ 37,302,477
Total
Unearned Revenue
Accounts Receivable
$ 1,856,003 $
Unearned Revenue
Accounts Payable
$ 2,572,304 $
406,447
$
194,225 44,155
800,329 1,497,607 457,726 3,866,664 475,010 3,215,624 3,237,764 260,922 702,249 257,772 1,021,730 3,578,709 1,225,156 89,240 2,870,879 1,192,413 632,817 510,636 3,659,322 7,299,743 110,031
243,592
$ 36,962,343
400,452
17 5,195 981,730 99 212,671
447,821
2,626,542
1,612,994
1,903,862 1,855,834 1,961,392
2,163,419 2,359,193 52,013 $ 9,676,387
$
981,730
$ 10,754,659
See the accompanying notes to the supplementary information.
-62-
$
Total
Program Expenditures
$
800,329 1,497,607 457,726 3,866,664 475,010 3,215,624 3,237,764 260,922 702,249 257,772 1,021,730 3,578,709 1,225,156 89,240 2,870,879 1,192,413 632,817 510,636 3,659,322 7,299,743 110,031
$ 36,962,343
COAST COMMUNITY COLLEGE DISTRICT SCHEDULE OF WORKLOAD MEASURES FOR STATE GENERAL APPORTIONMENT ANNUAL (ACTUAL) ATTENDANCE For the Fiscal Year Ended June 30, 2017
Audit Categories
Reported Data
Revised Data
Adjustments
A. Summer Intersession (Summer 2015 only) 1
1. Noncredit 1
2. Credit B. Summer Intersession (Summer 2016 - Prior to July 1, 2016) 1
1. Noncredit 1
2. Credit C. Primary Terms (Exclusive of Summer Intersession) 1. Census Procedure Courses (a) Weekly Census Contact Hours (b) Daily Census Contact Hours 2. Actual Hours of Attendance Procedure Courses 1
(a) Noncredit 1
(b) Credit 3. Independent Study/Work Experience (a) Weekly Census Contact Hours (b) Daily Census Contact Hours (c) Noncredit Independent Study/Distance Education Courses D. Total FTES
14.56
14.56
2,241.58
2,241.58
-
-
6.56
6.56
19,813.68 1,040.94
19,813.68 1,040.94
294.71
294.71
1,099.99
1,099.99
4,127.50 1,652.81
4,127.50 1,652.81 -
30,292.33
Supplemental Information (subset of above information) E. In-service Training Courses (FTES) H. Basic Skills courses and Immigrant Education 1
(a) Noncredit 1
(b) Credit
CCFS 320 Addendum CDCP Noncredit FTES
-
30,292.33
11.37
11.37
195.55
195.55
2,366.80
2,366.80
-
-
-
-
-
-
Centers FTES 1
(a) Noncredit 1
(b) Credit
1 Including Career Development and College Preparation (CDCP) FT ES
See the accompanying notes to the supplementary information.
-63-
COAST COMMUNITY COLLEGE DISTRICT RECONCILIATION OF ANNUAL FINANCIAL AND BUDGET REPORT WITH AUDITED FINANCIAL STATEMENTS For the Fiscal Year Ended June 30, 2017 The audit resulted in no adjustments to the fund balances reported on the June 30, 2017 Annual Financial and Budget Report (CCFS-311) based upon governmental accounting principles. In accordance with Governmental Accounting Standards Board Statements No. 34 and No. 35, the financial statements have been prepared under the full accrual basis of accounting which requires that revenues are recognized when earned, and expenses are recorded when an obligation has been incurred. Additional entries were made to comply with the governmental reporting requirements. These entries are not considered audit adjustments for purposes of this reconciliation. A reconciliation between the fund balances reported on the June 30, 2017 Annual Financial and Budget Report (CCFS-311), based upon the modified accrual basis of accounting, and total net position recorded on the full accrual basis of accounting is shown below and on the following page: General Fund Balance Bond Interest and Redemption Fund Balance Capital Outlay Fund Balance Measure M - Bond Construction Funds Balance Self-Insurance Fund Balance Amount reported as OPEB Plan Fund Balance Incurred but not reported liability
$
40,892,865 63,432,697 30,551,535 364,343,373
103,534,115 (71,617,326) (3,287,265)
Self-Insurance Fund Balance - Revised All Other Funds
28,629,524 15,470,285
Total fund balances as reported on the Annual Financial and Budget Report (CCFS-311)
$
See the accompanying notes to the supplementary information.
-64-
543,320,279
COAST COMMUNITY COLLEGE DISTRICT RECONCILIATION OF ANNUAL FINANCIAL AND BUDGET REPORT WITH AUDITED FINANCIAL STATEMENTS For the Fiscal Year Ended June 30, 2017 Total fund balances as reported on the Annual Financial and Budget Report (CCFS-311)
$
Notes receivable is recognized in the statement of net position. The repayment of notes receivable is reported as revenue in the governmental funds, but the repayment reduces the notes receivable in the statement of net position.
543,320,279
12,937,500
Capital assets used for governmental activities are not financial resources and therefore are not reported as assets in governmental funds. Net capital assets of $5,411,250 is already recorded in other governmental funds. Capital assets, net of accumulated depreciation are added to total net assets.
506,706,012
Deferred charges on refunding debt are recorded as deferred outflows and are amortized over the life of the refunded debt.
26,623,438
Deferred outflows of resources - pensions are for contributions made during the fiscal year that are removed from expenses and differences between estimated and actual results. The contributions will be recognized as a reduction of the net pension liability in the subsequent year and the differences will be amortized.
51,303,554
Capital lease are not due and payable in the current period and therefore are not reported as liabilities in the governmental funds. The liability is added to the statement of net position which reduces the total net assets reported.
(91,481)
Compensated absences are not due and payable in the current period and therefore are not reported in the governmental funds. The short term portion of compensated absences of $741,457 is already recorded in the General Fund.
(6,043,567)
Long-term liabilities related to bonds are not due and payable in the current period and therefore are not reported as liabilities in the governmental funds. Bond related liabilities are added to the statement of net position which reduces the total net assets reported.
(923,815,723)
The liability of employers contributing for other post employment retirement plans in excess of annual required contributions is reported as a liability in the governmental funds.
(31,549,563)
The liability of employers and nonemployers contributing to employees for benefits provided through a defined benefit pension plan is recorded as net pension liabilities.
(209,753,325)
Deferred inflows of resources - pensions represent an acquisition of net assets by the District that is applicable to a future reporting period. The deferred inflows of resources – pensions, results from various differences between estimated and actual results. These amounts are deferred and amortized.
(12,282,042)
Interest expense related to bonds incurred through June 30, 2017 is accrued as a current lability on the statement of net position which reduces the total net assets reported.
(5,143,672)
Total net position
$
See the accompanying notes to the supplementary information.
-65-
(47,788,590)
COAST COMMUNITY COLLEGE DISTRICT RECONCILIATION OF 50 PERCENT LAW CALCULATION For the Fiscal Year Ended June 30, 2017
Object/TOP Codes Academic Salaries Instructional Salaries - Contract or Regular 1100 Instructional Salaries - Other 1300 Total Instructional Salaries Non-Instructional Salaries - Contract or Regular 1200 Non-Instructional Salaries - Other 1400 Total Non-Instructional Salaries Total Academic Salaries Classified Salaries Non-Instructional Salaries - Regular Status 2100 Non-Instructional Salaries - Other 2300 Total Non-Instructional Salaries Instructional Aides - Regular Status 2200 Instructional Aides - Other 2400 Total Instructional Aides Total Classified Salaries Employee Benefits 3000 Supplies and Materials 4000 Other Operating Expenses 5000 Equipment Replacement 6420 Total Expenditures Prior to Exclusions Exclusions Activities to Exclude Instructional Staff–Retirees’ Benefits & Retirement Incentives 5900 Student Health Services Above Amount Collected 6441 Student Transportation 6491 Non-instructional Staff-Retirees’ Benefits & Retirement Incentives 6740 Objects to Exclude Rents and Leases 5060 Lottery Expenditures Academic Salaries 1000 Classified Salaries 2000 Employee Benefits 3000 Software 4100 Books, Magazines, & Periodicals 4200 Instructional Supplies & Materials 4300 Noninstructional, Supplies & Materials 4400 Other Operating Expenses and Services 5000 Capital Outlay 6000 Library Books 6300 Equipment - Additional 6410 Equipment - Replacement 6420 Other Outgo 7000 Total Exclusions Total for ECS 84362, 50% Law Percent of CEE (Instructional Salary Cost/Total CEE) 50% of Current Expense of Education
Activity (ECSA) ECS 84362 A Instructional Salary Cost AC 0100-5900 & AC 6110 Reported Audit Revised Data Adjustments Data
Activity (ECSB) ECS 84362 B Total CEE AC 0100-6799 Reported Audit Revised Data Adjustments Data
36,616,325 28,417,701 65,034,026
-
65,034,026
-
36,616,325 28,417,701 65,034,026 65,034,026
36,616,325 28,417,701 65,034,026 14,535,314 2,125,146 16,660,460 81,694,486
2,973,615 1,436,277 4,409,892 4,409,892 26,661,617 96,105,535
33,220,007 2,952,687 36,172,694 2,973,615 1,436,277 4,409,892 40,582,586 54,457,554 1,946,716 16,604,469 195,285,811
5,265,729
5,265,729
5,265,729
-
77,645 380,797
77,645 380,797
-
6,933,564
6,933,564
-
1,425,607
1,425,607
3,400,213
3,400,213 966,998 729,175 19,179,728 176,106,083 100% 88,053,042
2,973,615 1,436,277 4,409,892 4,409,892 26,661,617
-
96,105,535
-
-
5,265,729
5,265,729 90,839,806 51.58%
0%
5,265,729 90,839,806 51.58%
-
-
-
-
966,998
729,175
19,179,728 176,106,083 100% 88,053,042
See the accompanying notes to the supplementary information.
-66-
-
0% -
36,616,325 28,417,701 65,034,026 14,535,314 2,125,146 16,660,460 81,694,486 33,220,007 2,952,687 36,172,694 2,973,615 1,436,277 4,409,892 40,582,586 54,457,554 1,946,716 16,604,469 195,285,811
COAST COMMUNITY COLLEGE DISTRICT PROPOSITION 55 EDUCATION PROTECTION ACCOUNT EXPENDITURE REPORT For the Fiscal Year Ended June 30, 2017
Activity Classification
Object Code
Unrestricted $ 24,178,261
EPA Proceeds:
8630
Activity Classification Instructional Activities
Total Expenditures for EPA* Revenue less Expenditures
Object Code 0100-5900
Salaries Operating and Benefits Expenses (1000-3000) (4000-5000) $ 24,178,261 $ -
$
$ 24,178,261
$
$
-
Capital Outlay (6000)
Total
-
-
$ 24,178,261 24,178,261
*Total Expenditures for EPA may not include Administrator Salaries and Benefits or other administrative costs.
See the accompanying notes to the supplementary information.
-67-
COAST COMMUNITY COLLEGE DISTRICT SCHEDULE OF FINANCIAL TRENDS AND ANALYSIS For the Fiscal Year Ended June 30, 2017
2018 (Budgeted) Total revenues
$
Total expenditures Total other sources
2017
2016
2015
260,316,071 $
250,569,791 $
256,368,317 $
213,701,133
261,066,071
258,999,882
244,389,882
214,928,037
750,000
1,050,000
771,906
687,768
Change in fund balance
-
(7,380,091)
12,750,341
(539,136)
Ending fund balance
$
40,892,865 $
40,892,865 $
48,272,956 $
35,522,615
Available reserve
$
31,141,380 $
27,305,716 $
45,753,622 $
32,464,301
Available reserve %
11.93%
Full-time equivalent students Total long term debt
32,623 $
922,348,526 $
10.54%
18.72%
30,292 934,302,228 $
32,624 593,219,634 $
15.10% 30,924 595,352,888
IMPORTANT NOTES: Available reserve balance is the amount designated for general reserve and any other remaining undesignated amounts in the General Fund. The 2018 budget reserve balance was estimated using the budgeted contingency reserve balances less other 2017 amounts reserved. The 2017 budget is the Plan and Budget adopted by the Board of Trustees on September 6, 2017. The California Community College Chancellor's Office has provided guidelines that recommend an ending fund balance of 3% of unrestricted expenditures as a minimum with a prudent ending fund balance being 5% of unrestricted expenditures. Long-term debt is reported for the District as a whole and includes debt related to all funds, excluding the net pension liability. 2015 amounts for state revenues and employee benefits have not been revised to include amounts for on-behalf payments.
See the accompanying notes to the supplementary information.
-68-
COAST COMMUNITY COLLEGE DISTRICT NOTES TO THE SUPPLEMENTARY INFORMATION For the Fiscal Year Ended June 30, 2017 NOTE 1: PURPOSE OF SCHEDULES Schedule of Expenditures of Federal Awards Basis of Presentation The accompanying schedule of expenditures of federal awards (the Schedule) includes the federal award activity of the District under programs of the federal governmental for the year ended June 30, 2017. The information in this Schedule is presented in accordance with the requirements of the Title 2 U.S. Code of Federal Regulations Part 200, Uniform Administrative Requirements, Cost Principles, and Audit Requirements for Federal Awards (Uniform Guidance). Because the Schedule presents only a selected portion of operations of the District, it is not intended to and does not present the financial position, changes in net assets, or cash flows of the District. Summary of Significant Accounting Policies Expenditures reported on the Schedule are reported on the accrual basis of accounting. Such expenditures are recognized following the cost principles contained in the Uniform Guidance, wherein certain types of expenditures are not allowable or are limited as to reimbursement. The District did not use the 10-percent de minimus indirect cost rate as allowed under the Uniform Guidance. Schedule of State Financial Assistance - Grants The Schedule of State Financial Assistance was prepared on the modified accrual basis of accounting Schedule of Workload Measures for State General Apportionment Annual (Actual) Attendance The Schedule of Workload Measures for State General Apportionment represents the basis of apportionment of the District's annual source of funding. Reconciliation of Annual Financial and Budget Report with Audited Financial Statements This schedule reports any audit adjustments made to the fund balances of all funds as reported on the June 30, 2017 Annual Financial and Budget Report (Form CCFS-311). This schedule shows a reconciliation between the governmental fund balances on the June 30, 2017 CCFS-311, based upon the modified accrual basis of accounting, and total net position recorded on the full accrual basis of accounting shown.
-69-
COAST COMMUNITY COLLEGE DISTRICT NOTES TO THE SUPPLEMENTARY INFORMATION For the Fiscal Year Ended June 30, 2017 NOTE 1: PURPOSE OF SCHEDULES Reconciliation of 50 Percent Law Calculation This schedule reports any audit adjustments made to the 50 percent law calculation (Education Code Section 84362). Proposition 55 Education Protection Account Expenditure Report This schedule reports how funds received from the passage of Proposition 55 Education Protection Act were expended. Schedule of General Fund Financial Trends and Analysis This report is prepared to show financial trends of the General Fund over the past three fiscal years as well as the current year budget. This schedule is intended to identify if the District faces potential fiscal problems and if they have met the recommended available reserve percentages.
-70-
OTHER INDEPENDENT AUDITOR’S REPORT
-71-
INDEPENDENT AUDITOR’S REPORT ON INTERNAL CONTROL OVER FINANCIAL REPORTING AND ON COMPLIANCE AND OTHER MATTERS BASED ON AN AUDIT OF FINANCIAL STATEMENTS PERFORMED IN ACCORDANCE WITH GOVERNMENT AUDITING STANDARDS The Board of Trustees Coast Community College District Costa Mesa, California We have audited, in accordance with auditing standards generally accepted in the United States of America and the standards applicable to financial audits contained in Government Auditing Standards, issued by the Comptroller General of the United States, the basic financial statements of Coast Community College District (the District), as of and for the year ended June 30, 2017, and the related notes to the financial statements and have issued our report thereon dated November 30, 2017. Internal Control Over Financial Reporting In planning and performing our audit of the financial statements, we considered the District’s internal control over financial reporting (internal control) to determine the audit procedures that are appropriate in the circumstances for the purpose of expressing our opinions on the financial statements, but not for the purpose of expressing an opinion on the effectiveness of the District’s internal control. Accordingly, we do not express an opinion on the effectiveness of the District’s internal control. A deficiency in internal control exists when the design or operation of a control does not allow management or employees, in the normal course of performing their assigned functions, to prevent or detect and correct misstatements on a timely basis. A material weakness is a deficiency or a combination of deficiencies in internal control such that there is a reasonable possibility that a material misstatement of the financial statements will not be prevented, or detected and corrected on a timely basis. A significant deficiency is a deficiency or a combination of deficiencies in internal control that is less severe than a material weakness, yet important enough to merit attention by those charged with governance.
-72-
INDEPENDENT AUDITOR’S REPORT ON INTERNAL CONTROL OVER FINANCIAL REPORTING AND ON COMPLIANCE AND OTHER MATTERS BASED ON AN AUDIT OF FINANCIAL STATEMENTS PERFORMED IN ACCORDANCE WITH GOVERNMENT AUDITING STANDARDS Our consideration of internal control was for the limited purpose described in the first paragraph of this section and was not designed to identify all deficiencies in internal control that might be material weaknesses or significant deficiencies and, therefore, material weaknesses or significant deficiencies may exist that have not been identified. We identified a deficiency in internal control, as described in the accompanying schedule of findings and questioned costs that we consider to be a material weakness, finding 2017-001, and another deficiency that we consider to be a significant deficiency, finding 2017-002. Compliance and Other Matters As part of obtaining reasonable assurance about whether the District’s financial statements are free of material misstatement, we performed tests of its compliance with certain provisions of laws, regulations, contracts and grant agreements, noncompliance with which could have a direct and material effect on the determination of financial statement amounts. However, providing an opinion on compliance with those provisions was not an objective of our audit and, accordingly, we do not express such an opinion. The results of our tests disclosed no instances of noncompliance or other matters that are required to be reported under Government Auditing Standards. District’s Response to the Findings The District’s responses to the findings identified in our audit are described in the accompanying schedule of findings and questioned costs. The District’s responses were not subjected to the auditing procedures applied in the audit of the financial statements and, accordingly, we express no opinion on them. Purpose of this Report The purpose of this report is solely to describe the scope of our testing of internal control and compliance and the results of that testing, and not to provide an opinion on the effectiveness of the entity's internal control or on compliance. This report is an integral part of an audit performed in accordance with Government Auditing Standards in considering the entity's internal control and compliance. Accordingly, this communication is not suitable for any other purpose.
CliftonLarsonAllen LLP Glendora, California November 30, 2017
-73-
INDEPENDENT AUDITOR’S REPORT ON COMPLIANCE FOR EACH MAJOR FEDERAL PROGRAM; AND REPORT ON INTERNAL CONTROL OVER COMPLIANCE REQUIRED BY THE UNIFORM GUIDANCE The Board of Trustees Coast Community College District Costa Mesa, California Report on Compliance for Each Major Federal Program We have audited Coast Community College District’s (the District) compliance with the types of compliance requirements described in the U.S. Office of Management and Budget (OMB) Compliance Supplement that could have a direct and material effect on each of the District’s major federal programs for the year ended June 30, 2017. The District’s major federal programs are identified in the summary of auditor’s results section of the accompanying schedule of findings and questioned costs. Management’s Responsibility Management is responsible for compliance with federal statutes, regulations, and the terms and conditions of its federal awards applicable to its federal programs. Auditor’s Responsibility Our responsibility is to express an opinion on compliance for each of the District’s major federal programs based on our audit of the types of compliance requirements referred to above. We conducted our audit of compliance in accordance with auditing standards generally accepted in the United States of America; the standards applicable to financial audits contained in Government Auditing Standards, issued by the Comptroller General of the United States; and the audit requirements of Title 2 U.S. Code of Federal Regulations Part 200, Uniform Administrative Requirements, Cost Principles, and Audit Requirements for Federal Awards (Uniform Guidance). Those standards and the Uniform Guidance require that we plan and perform the audit to obtain reasonable assurance about whether noncompliance with the types of compliance requirements referred to above that could have a direct and material effect on a major federal program occurred. An audit includes examining, on a test basis, evidence about the District’s compliance with those requirements and performing such other procedures as we considered necessary in the circumstances.
-74-
INDEPENDENT AUDITOR’S REPORT ON COMPLIANCE FOR EACH MAJOR FEDERAL PROGRAM; AND REPORT ON INTERNAL CONTROL OVER COMPLIANCE REQUIRED BY THE UNIFORM GUIDANCE We believe that our audit provides a reasonable basis for our opinion on compliance for each major federal program. However, our audit does not provide a legal determination of the District's compliance. Opinion on Each Major Federal Program In our opinion, the District complied, in all material respects, with the types of compliance requirements referred to above that could have a direct and material effect on each of its major federal programs for the year ended June 30, 2017. Report on Internal Control Over Compliance Management of the District is responsible for establishing and maintaining effective internal control over compliance with the types of compliance requirements referred to above. In planning and performing our audit of compliance, we considered the District’s internal control over compliance with the types of requirements that could have a direct and material effect on each major federal program to determine the auditing procedures that are appropriate in the circumstances for the purpose of expressing an opinion on compliance, for each major federal program and to test and report on internal control over compliance in accordance with the Uniform Guidance, but not for the purpose of expressing an opinion on the effectiveness of internal control over compliance. Accordingly, we do not express an opinion on the effectiveness of the District’s internal control over compliance. A deficiency in internal control over compliance exists when the design or operation of a control over compliance does not allow management or employees, in the normal course of performing their assigned functions, to prevent, or detect and correct, noncompliance with a type of compliance requirement of a federal program on a timely basis. A material weakness in internal control over compliance is a deficiency, or a combination of deficiencies in internal control over compliance, such that there is a reasonable possibility that material noncompliance with a type of compliance requirement of a federal program will not be prevented, or detected and corrected, on a timely basis. A significant deficiency in internal control over compliance is a deficiency, or a combination of deficiencies, in internal control over compliance with a type of compliance requirement of a federal program that is less severe than a material weakness, yet important enough to merit attention by those charged with governance.
-75-
INDEPENDENT AUDITOR’S REPORT ON COMPLIANCE FOR EACH MAJOR FEDERAL PROGRAM; AND REPORT ON INTERNAL CONTROL OVER COMPLIANCE REQUIRED BY THE UNIFORM GUIDANCE Our consideration of internal control over compliance was for the limited purpose described in the first paragraph of this section and was not designed to identify all deficiencies in internal control over compliance that might be material weaknesses or significant deficiencies and, therefore, material weaknesses or significant deficiencies may exist that have not been identified. We did not identify any deficiencies in internal control over compliance that we consider to be material weaknesses. Purpose of this Report The purpose of this report on internal control over compliance is solely to describe the scope of our testing of internal control over compliance and the results of that testing based on the requirements of the Uniform Guidance. Accordingly, this report is not suitable for any other purpose.
CliftonLarsonAllen LLP Glendora, California November 30, 2017
-76-
INDEPENDENT AUDITOR’S REPORT ON STATE COMPLIANCE The Board of Trustees Coast Community College District Costa Mesa, California We have audited the Coast Community College District’s (the District) compliance with the types of compliance requirements described in the 2016-17 Contracted District Audit Manual, published by the California Community Colleges Chancellor’s Office for the year ended June 30, 2017. The District’s state compliance requirements are identified in the table provided. Management’s Responsibility Management is responsible for compliance with the state laws and regulations as identified below. Auditor’s Responsibility Our responsibility is to express an opinion on the District’s compliance based on our audit of the types of compliance requirements referred to below. We conducted our audit of compliance in accordance with auditing standards generally accepted in the United States of America, the standards applicable to financial audits contained in Government Auditing Standards, issued by the Comptroller General of the United States, and the 2016-17 Contracted District Audit Manual, published by the California Community Colleges Chancellor’s Office. Those standards require that we plan and perform the audit to obtain reasonable assurance about whether noncompliance with the specific areas listed below has occurred. An audit includes examining, on a test basis, evidence about the District’s compliance with those requirements and performing such other procedures as we considered necessary in the circumstances. We believe that our audit provides a reasonable basis for our opinion on state compliance. However, our audit does not provide a legal determination of the District’s compliance.
-77-
INDEPENDENT AUDITOR’S REPORT ON STATE COMPLIANCE Compliance Requirements Tested In connection with the audit referred to above, we selected and tested transactions and records to determine the District's compliance with the laws and regulations applicable to the following items: Section 421 423 424 425 426 427 428 429 430 431 435 439 440 475 479 490 491
Description Salaries of Classroom Instructors (50 Percent Law) Apportionment for Instructional Service Agreements/Contracts State General Apportionment Funding System Residency Determination for Credit Courses Students Actively Enrolled Dual Enrollment of K-12 Students in Community College Credit Courses Student Equity Student Success and Support Program (SSSP) Scheduled Maintenance Program Gann Limit Calculation Open Enrollment Proposition 39 Clean Energy Funds Intersession Extension Program Disabled Student Programs and Services (DSPS) To Be Arranged Hours (TBA) Proposition 1D State Bond Funded Projects Proposition 55 Education Protection Account Funds
Procedures Performed Yes Not applicable Yes Yes Yes Yes Yes Yes Yes Yes Yes Yes Not applicable Yes Yes Not applicable Yes
Opinion on State Compliance In our opinion, the District complied with the laws and regulations of the state programs referred to above in all material respects for the year ended June 30, 2017. Purpose of this Report The purpose of this report on state compliance is solely to describe the results of testing based on the requirements of the 2016-17 Contracted District Audit Manual, published by the California Community College Chancellor’s Office. Accordingly, this report is not suitable for any other purpose.
CliftonLarsonAllen LLP Glendora, California November 30, 2017
-78-
FINDINGS AND QUESTIONED COSTS
-79-
COAST COMMUNITY COLLEGE DISTRICT SCHEDULE OF FINDINGS AND QUESTIONED COSTS SUMMARY OF AUDITOR RESULTS June 30, 2017
SUMMARY OF AUDITOR’S RESULTS Financial Statements Type of report the auditor issued on whether the financial statements audited were prepared in accordance with GAAP:
Unmodified
Internal control over financial reporting: Material weakness(es) identified? Significant deficiency(ies) identified? Noncompliance material to financial statements noted?
X
Yes
No
X
Yes
None Reported
Federal Awards Internal control over major federal awards: Material weakness(es) identified? Significant deficiency(ies) identified?
Yes
X
No
Yes
X
No
Yes
X
None Reported
Type of auditor’s report issued on compliance for major federal programs:
Unmodified
Any audit findings disclosed that are required to be reported in accordance with 2 CFR 200.516(a)?
No
Yes
X
Identification of Major Federal Programs: CFDA Number(s) Name of Federal Program or Cluster 84.007, 84.033, 84.063, and 84.268 Student Financial Aid Cluster
Dollar threshold used to distinguish between type A and type B programs:
$1,567,028
Auditee qualified as low-risk auditee?
No
Yes
-80-
X
COAST COMMUNITY COLLEGE DISTRICT SCHEDULE OF FINDINGS AND QUESTIONED COSTS RELATED TO THE FINANCIAL STATEMENTS June 30, 2017 NOTE: Each of the findings and recommendations below include details about the criteria or specific requirements, the condition, the effect and the cause. Questioned costs, if applicable are listed separately. The district response that follows the finding is the District’s corrective action plan. 2017-001
RECONCILIATION AND CLOSING PROCEDURES
Original Finding: 2014-001 Finding: Our audit procedures revealed the lack of a systematic method to ensure complete monthly reconciliations and closing procedures take place. A continuing and growing backlog of accounts that are not reconciled may ultimately cause significant errors in the financial records and statements as well as allow possible irregularities, including fraud, to exist and continue without notice. We noted the following deficiencies:
There are 17 checking accounts between the General Fund and the Student Financial Aid Fund, of the 17, six accounts were reconciled, seven accounts have unreconciled differences, and four accounts with no bank reconciliations. No reconciliation process between the campuses’ auxiliary funds and the District’s Fund 81, which is the control fund for the campuses Due to incomplete reconciliations of some accounts receivable and accounts payable accounts, there were three proposed adjusting entries. One was for $899,268 in accounts receivable and one was for $849,236 in accounts payable, totaling to a net effect of $50,033 on the ending fund balance. In addition, there were differences on the initial federal and state revenues and expenditures schedule provided to us.
Recommendation: Establish a system of consistent monthly reconciliations and closing procedures. To provide more accurate financial statements, establish effective review and reconciliation policies and procedures as a customary part of the business operations and accounting process. This would include monthly reconciliations of all accounts, recording adjustments throughout the year that have typically been made at year-end only, and perform regular reviews of the general ledger throughout the year. District Response: There has been significant turnover in the District Fiscal Department resulting in a delay of our implementation plan. However, our original plan is sound and entails full staffing to implement a system of monthly closing procedures. These procedures will include account reconciliations to ensure accounts are reviewed, reconciled, and adjusted monthly. The plan includes the following: a) Documentation supporting the reconciliation of bank balance to the account balance in the general ledger. b) Monthly account reconciliations completed and reviewed by specified due dates and a -81-
COAST COMMUNITY COLLEGE DISTRICT SCHEDULE OF FINDINGS AND QUESTIONED COSTS RELATED TO THE FINANCIAL STATEMENTS June 30, 2017 2017-001
RECONCILIATION AND CLOSING PROCEDURES
review of the unidentified differences and posting the necessary adjustments timely. c) Procedures established to reconcile auxiliary charges to District Fund 81 balances. In addition, we will implement procedures and timelines to ensure all audit adjusting entries are posted when required. d) Year-end accruals in pre-paid and accounts payable accounts will be reviewed and corrected as appropriate. e) The monthly close process will be reviewed periodically to identify improvements that help ensure quality, accuracy and completeness of the reconciliations. 2017-002
Internal Controls – Payroll Segregation of Duties and Personnel Files
Finding: Salaries and benefits expenditures are the most significant expense of the District. A strong internal control system over the payroll functions of on-boarding new employees, and ongoing payroll preparation, reviewing process, and record keeping can reduce the potential threats of error and misappropriation. Our audit procedures disclosed the following deficiencies:
Except for the part-time faculty, the payroll department uses a version of the authorization form such as Personnel Action Form (PAF), the electronic PAF (ePAF), or the Personnel Action Request (PAR), forwarded by the human resource department to enter all new employees and their pay rates and pay rate changes into Banner, the financial system, and payroll system. The human resources department enters the parttime faculty information into Banner and the payroll system. No confirmation of input of the PAFs is sent back to the human resource department and there is no audit function performed by other departments to review the payroll department’s input process of the PAFs.
Currently, the payroll department audits its own work. The payroll technicians cross audit all their entries each payroll cycle. The payroll analyst audits each payroll cycle for data entry errors, misclassifications of employees, retirement misclassification of pay, salary calculation errors. The payroll systems manager audits each payroll cycle for balancing, retirement reporting, and tax reporting. Although the payroll department is performing and auditing all the functions noted above, the documentation of such process is not available for audit review.
Personnel files do not always include the most current authorizations such as the PAF, ePAF, or the PAR for pay rates. These authorizations exist, but are not maintained in a central location. When a PAF or a PAR was not available for audit review, the assumption is the employees may have an ePAF; however, documentation was not easily accessible by the human resources department. Requesting the ePAF from payroll, requires the transaction number which is not easily obtained. Also, if no ePAF is on file, and the employee has a Faculty Load and Compensation (FLAC) approval, the payroll -82-
COAST COMMUNITY COLLEGE DISTRICT SCHEDULE OF FINDINGS AND QUESTIONED COSTS RELATED TO THE FINANCIAL STATEMENTS June 30, 2017 2017-002
Internal Controls – Payroll Segregation of Duties and Personnel Files
department maintains custody of the supporting documentation Recommendation: To strengthen internal controls, have individual(s) or a department outside the payroll function, such as the human resources department enter all new employees and pay rate changes. The payroll department should not have access to this function within the payroll system. Review, and documentation of the review, strengthen internal controls by ensuring changes made to an employee’s record and personnel file are proper and correct.
Document the payroll department’s current cross audit and review functions within the department and maintain evidence that the review was completed.
Establish a process to ensure the history and authorization of each employees’ pay rate changes are documented and retained. The process established should result in a timely response to requests for supporting documentation.
District Response: The District is in the process of implementing the electronic personnel action form (ePAF) by February 2018, which will automatically apply the pay rates after the ePAF has been fully approved by all respective departments within its workflow process. Since the system will be automatically applying the pay rates, and the payroll department will not be part of the workflow approval process of an ePAF, this business process will effectively segregate the duties as Human Resources will be entering the pay rates into the system for an ePAF. The review and cross audit of payroll functions will be properly documented with dates and signatures of the reviewer. In addition to compensating internal controls, Payroll will engage the Fiscal department to perform sampling audits for payroll completeness, accuracy and existence. The District will be able to run ePAF reports at any given time to see a historical audit approval trail as well as any relevant changes to an employee’s pay. The official personnel file for all employees is maintained and housed securely in the District Human Resources Office. With the implementation of ePAF in February 2018, Human Resources will create and annually print a report of all current fiscal year authorizations for each faculty member with assignment and pay rate, and place this report in each personnel file. With regard to Load, Human Resources will create a load report for each faculty member, and include printed reports in the personnel file.
-83-
COAST COMMUNITY COLLEGE DISTRICT SCHEDULE OF FINDINGS AND QUESTIONED COSTS RELATED TO FEDERAL AWARDS June 30, 2017 There were no findings and questioned costs related to federal awards for the year ended June 30, 2017.
-84-
COAST COMMUNITY COLLEGE DISTRICT SCHEDULE OF FINDINGS AND QUESTIONED COSTS RELATED TO STATE AWARDS June 30, 2017
There were no findings and questioned costs related to state awards for the year ended June 30, 2017.
-85-
COAST COMMUNITY COLLEGE DISTRICT STATUS OF PRIOR YEAR FINDINGS AND QUESTIONED COSTS June 30, 2017 2016-001
Reconciliation and Closing Procedures
Original Finding: 2014-001 Finding: Our audit procedures revealed the lack of a systematic method to ensure complete monthly reconciliations and closing procedures take place. A continuing and growing backlog of accounts that are not reconciled may ultimately cause significant errors in the financial records and statements as well as allow possible irregularities, including fraud, to exist and continue without notice. We noted the following deficiencies:
The District Office has 23 bank accounts of which nine accounts reconciled to the general ledger, ten accounts have no bank reconciliation reports, and four bank reconciliations with reports did not reconcile to the general ledger Prepaid expenditures in the Self-insurance fund related to 2014-15 activity that should be recorded as expense during the closing process No reconciled detail listing for account object 9510, accounts payable for the year end Journal entries of $705,378 were recorded and later reversed which caused the beginning balance to not reconcile to either the 2013-14 or 2014-15 ending fund balance No reconciliation process between the campuses’ auxiliary funds and the District’s Fund 81, which is the control fund for the campuses
Recommendation: Establish a system of consistent monthly reconciliations and closing procedures. In addition, in order to provide more accurate financial statements, we strongly recommend the District establish more effective review and reconciliation policies and procedures as a customary part of the accounting process. This would involve monthly reconciliations of all accounts, making adjustments throughout the year that have typically been made at year-end only, and performing more frequent reviews of the general ledger throughout the year. District Response: The District will establish a system of monthly reconciliations and closing procedures. These monthly reconciliations will consist of the following: a) Documentation supporting the reconciliation of bank balance to the account balance in the general ledger. b) Account reconciliations will be completed and reviewed in a timely manner by creating due dates for reconciliations, and a review of the unidentified differences and posting the necessary adjustments timely. c) The account reconciliation process will be reviewed quarterly to identify improvements that help ensure quality, accuracy and completeness of the reconciliations. d) Year-end accruals in pre-paid and accounts payable accounts will be reviewed and -86-
COAST COMMUNITY COLLEGE DISTRICT STATUS OF PRIOR YEAR FINDINGS AND QUESTIONED COSTS June 30, 2017 2016-001
Reconciliation and Closing Procedures
corrected as appropriate. e) We will establish procedures to reconcile auxiliary charges to District Fund 81 balances. In addition, we will establish procedures and timelines to ensure all audit adjusting entries are posted when required. Status: See current year finding 2017-001. The following items from the prior year have been implemented: Prepaid expenditures in the Self-insurance fund related to 2014-15 activity that should be recorded as expense during the closing process A detail listing for account object 9510, accounts payable that is reconciled at year end Journal entries of $705,378 were recorded and later reversed which caused the beginning balance to not reconcile to either the 2013-14 or 2014-15 ending fund balance. 2016-002
Return to Title IV
Federal Program: Student Financial Aid Cluster (84.038, 84.063, and 84.268) CFDA Number: Federal Award Number & Year: P268K163665, P268K161161, P268K163665, P063P153665, P063P151139, P063P151161, 2015-2016 Name of Federal Agency: U.S. Department of Education Name of the Pass-through Agency: Not applicable Campus: Coastline College (CCC), Golden West College (GWC), and Orange Coast College (OCC) Criteria: According to 34 CFR 668.22(1)(3)(i), “For a student who provides notification to the institution of his or her withdrawal, the student's withdrawal date as determined under paragraph (c) […the date, as determined by the institution, that the student otherwise provided official notification to the institution, in writing or orally, of his or her intent to withdraw] … or the date of notification of withdrawal”. According to 34 CFR 668.22(j)(1), an institution must return the amount of title IV funds for which it is responsible under paragraph (g) as soon as possible but no later than 45 days after the date of the institution’s determination that the student withdrew as defined in (l)(3). Condition: From a sample of Return to Title IV (R2T4) students selected for file testing, we verified the R2T4 calculation including the determination and return to the U.S. Department of Education's Grant Management System (G5). A total of 47 students, 13 at CCC, 15 at GWC, and 19 at OCC, were selected for R2T4 testing which includes recalculation, timing of determination, -87-
COAST COMMUNITY COLLEGE DISTRICT STATUS OF PRIOR YEAR FINDINGS AND QUESTIONED COSTS June 30, 2017 2016-002
Return to Title IV
and verification of the funding was returned through G5. From the total, the determination period was not met for 28 students; the student notified campus that he/she was withdrawing and R2T4 calculation was not done at the time per regulation. Of the 28 students noted, eight were at CCC, 10 were at GWC, and 10 were at OCC. From the total, three students did not have R2T4 returned within 45 days. One student is from GWC and two were from OCC. Context: A total of 47 students, 13 at Coastline Campus (CCC), 15 at Golden West Campus (GWC), and 19 at Orange Coast Campus (OCC), were selected for R2T4 testing. From the total, 28 students did not meet the determination period (eight at CCC, 10 at GWC, and 10 at OCC). From the students selected for testing, 24 students’ R2T4 calculated for no funds to be returned. There were four students’ R2T4 funds that were not returned by the timeframe, two from GWC and two from OCC. Effect: Not in compliance with 34 CFR 668.22(l)(3)(i) and 34 CFR 668.22(j)(1) Cause: Unknown Total Program Expenditures: $54,775,981 Questioned Costs and Units: Not applicable Recommendation: Implement procedures to ensure the timeframes indicated by 34 CFR 668.22(1)(3)(i) and 34 CFR 668.22(j)(1). Corrective Action Plan: All 2015-16 Return to Title IV calculations were completed and all applicable funds were returned to the U.S. Department of Education’s Grant Management System (G5) by all three colleges in the District. As a result of the external auditor visits in April and August 2016, the Return to Title IV (R2T4) procedures have been revised to ensure that the Colleges meet all required timelines and calculations. The Condition/Context of the audit finding report dated June 30, 2016, 2016-002 indicated that from the total of 47 students selected for file testing, 28 students notified the campus that he/she was withdrawing and R2T4 calculation were not done at the time per regulation 34 CFR 668.22(1)(3)(i). Of the 28 students noted, eight were from CCC, 10 were at GWC, and 10 were at OCC. In fall 2015, staff was processing a large percentage of students “dropping” all units as official withdrawals and others were seeking a Last Day of Attendance (LDA) from faculty. By the time -88-
COAST COMMUNITY COLLEGE DISTRICT STATUS OF PRIOR YEAR FINDINGS AND QUESTIONED COSTS June 30, 2017 2016-002
Return to Title IV
spring 2016 started, further clarification and training was provided to staff on how to process R2T4 official and unofficial withdrawals and understanding the difference between the two types of withdrawals and related difference in R2T4 processing rules. Although the colleges have an official withdrawal process, rarely does a student utilize this option to inform the college that she/he is withdrawing for the term. When looking at the total file testing sample, not one student officially withdrew from either college. Outside the sample testing, Orange Coast College (OCC) had only one student notify the college of the withdrawal by submitting the official withdrawal form. Coastline Community College (CCC) had two students notify the college of their withdrawal submitting the official withdrawal form and Golden West College (GWC) had none. The Colleges have implemented the following R2T4 procedures for official and unofficial withdrawals as institutions not required to take attendance (except for students in online courses which are treated differently). The Colleges refer to the federal handbook for all federal regulations pertaining to Return to Title IV at http://ifap.ed.gov/fsahandbook/attachments/1617FSAHbkVol5Master.pdf The Financial Aid Office is required by federal statute to recalculate federal financial aid eligibility for students who withdraw, drop out, dismissed, or take an unapproved leave of absence prior to completing 60% of the payment period or term. If a student leaves the institution prior to completing 60% of the payment period, the Financial Aid Office recalculates eligibility for Title IV funds. Recalculation is based on the percentage of earned aid using the following Federal Return of Title IV funds formula: a. Percentage of payment period or term completed = the number of days completed up to the withdrawal date divided by the total days in the payment period or term. (Any break of five days or more is not counted as part of the days in the term.) This percentage is also the percentage of earned aid. b. Funds are returned to the appropriate federal program based on the percentage of unearned aid using the following formula: i. Aid to be returned = (100% of the aid that could be disbursed minus the percentage of earned aid) multiplied by the total amount of aid that could have been disbursed during the payment period or term. ii. If a student earned less aid than was disbursed, the institution would be required to return a portion of the funds and the student may be required to return a portion of the funds. Keep in mind that when Title IV funds are returned, the student borrower may owe a debit balance to the institution. iii. If a student earned more aid than was disbursed to him/her, the institution would owe the student a post-withdrawal disbursement, which must be paid within 120 days of the student's withdrawal.
-89-
COAST COMMUNITY COLLEGE DISTRICT STATUS OF PRIOR YEAR FINDINGS AND QUESTIONED COSTS June 30, 2017 2016-002
Return to Title IV
Types of Withdrawals Official Withdrawal - a student begins the official withdrawal process or provides official notification to the college of his or her intent to withdraw. The date of the institution’s determination that the student withdrew would be the date the student began the official withdrawal process or the date of the student’s notification, whichever is later. Unofficial Withdrawals - Encompasses all other withdrawals where official notification is not provided to the college. The colleges have now in place revised R2T4 procedures to ensure the correct calculation and determination of R2T4 and timely return of applicable funds. These procedures are described in the R2T4 Procedure Manual. Status: Implemented. 2016-003
SFA Finding related to Common Origination of Disbursement (COD)
CFDA Title and Number: Student Financial Aid Cluster (84.038, 84.063, and 84.268) Federal Award Number and Year: P268K163665, P268K161161, P268K163665, P063P153665, P063P151139, P063P151161, 2015-2016 Name of Federal Agency: U.S. Department of Education Name of the Pass-through Agency: Not applicable Campus: Coastline College (CCC), Golden West College (GWC), and Orange Coast College (OCC) Criteria: According to 34 CFR 668.164(a), “the disbursement date is the date that a school credits a student’s account at the school or pays a student or parent borrower directly with Title IV funds received from the U.S. Department of Education (the Department) or with institutional funds in advance of receiving Title IV program funds. This is the date that a school must report to the COD [Common Origination and Disbursement] System as the actual disbursement date for a Direct Loan, as distinguished from the anticipated disbursement date”. Condition: File testing at OCC was based on a sample size of 29 students; noted that 22 students’ COD disbursement dates did not match the students’ actual disbursement dates. Each student had more than one disbursement reported on COD. For the 22 errors noted, 12 students had incorrect COD disbursement dates for all disbursement received and the remaining 10 students had one disbursement date that did not correspond. At the other two campuses, GWC and CCC, we noted no issues during the initial file testing; noted that these campuses corrected the file before testing was performed, which aligns to the -90-
COAST COMMUNITY COLLEGE DISTRICT STATUS OF PRIOR YEAR FINDINGS AND QUESTIONED COSTS June 30, 2017 2016-003
SFA Finding related to Common Origination of Disbursement (COD)
guidance that it is acceptable to revise the dates in the COD system when errors are found. An additional 25 students were selected per campus and issues related to incorrect dates were noted. At both campuses, all students’ in the additional sample had COD disbursement dates that did not match the actual date disbursements were received. Context: At OCC, 22 out of the original 29 students tested had COD disbursement dates that did not match the actual date disbursements were received. For both GWC and CCC, the additional 25 students tested, all contained errors between the COD disbursement date and the actual disbursement date. Effect: Not in compliance with 34 CFR 668.164(a). Cause: There was an initial misunderstanding of the date to use. Within the Banner system, the federal awards are directly applied to the student’s outstanding balance; therefore, the COD disbursement date should reflect the Banner system date. Total Program Expenditures: $54,775,981 Questioned Costs and Units: Not applicable Recommendation: Implement procedures to report accurate information. For errors noted in FY15-16, perform procedures to correct and reconcile between COD and students’ actual disbursements. Corrective Action Plan: In fall 2015, the District and the colleges became aware of the discrepancies in posted disbursement dates for specific transactions of Title IV program funds between the Common Origination and Disbursement (COD) and the District’s Enterprise Resource Planning System Banner student ledger. The reason for this discrepancy was an initial misunderstanding of the date to use. Within the Banner system, the federal awards are directly applied to the student’s outstanding balance. The federal awards are loaded through a process that transfers information from the financial aid management system PowerFaids, which is a standalone system outside Banner, to the Banner Students Accounts Receivables module. The COD date that the staff posted in COD was the date when the student received the balance of the funds through the refund process not the date when the federal awards were posted to the student account in the Banner Students Accounts Receivables module. The COD date should have been the Banner system date when the federal awards were directly applied to the student’s outstanding balance. Once the staff understood this misunderstanding and discrepancy, staff attempted to adjust the setup in the PowerFaids financial aid management software for the 2015-16 aid year. However, because some 2015-16 aid year disbursements had already taken place, PowerFaids does not allow the setup to be changed. As a result, all COD dates for 2015-16 need to be adjusted
-91-
COAST COMMUNITY COLLEGE DISTRICT STATUS OF PRIOR YEAR FINDINGS AND QUESTIONED COSTS June 30, 2017 2016-003
SFA Finding related to Common Origination of Disbursement (COD)
manually. The sample files used by the external auditors for the 2015-16 aid year reflected that some of the dates have already been aligned and some were not at the time of the review. The colleges are in the process of aligning the COD disbursements dates with the student ledger disbursement dates for the 2015-16 aid year. Due to the magnitude of the project and staffing capacity, the process of aligning the dates in COD manually will take some time. Below is a summary of the current status for each college: Coastline Community College – there are 3,206 students with approximately 6 disbursements each for the 2015-16 aid year that need dates in COD aligned. This represents about 19,236 dates in COD to align. As of November 4, 2016, approximately 2,905 students and 17,430 dates in COD remained to be aligned. Golden West College (GWC) – there are 6,000 students with approximately 6 disbursements each for the 2015-16 aid year that need dates in COD aligned. This represents about 36,000 dates in COD to align. As of November 4, 2016, approximately 3,900 students and 23,400 dates in COD remain to be aligned. Orange Coast College (OCC) – there are 8,011 students with approximately 6 disbursements each for the 2015-16 aid year that need dates in COD aligned. This represents about 48,000 dates in COD to align. As of November 4, 2016, approximately 7,800 students and 46,800 dates in COD remain to be aligned. For the 2016-17 aid year, PowerFaids was set up correctly prior to any 2016-17 disbursements. The dates in COD and the Banner student ledger match for all 2016-17 disbursements. In order to enhance the District’s financial aid system, the District decided to move forward with the implementation of the Banner Financial Aid module which is integrated within the Banner Enterprise Resource Planning System. The implementation of Banner Financial Aid will remove the outside and additional current financial aid management system PowerFaids, helping the District to reconcile and work within one system to improve efficiency and accuracy. This will eliminate the need for data loads between various internal systems and from Banner to COD. This will also eliminate the timing delays, since information will be submitted from Banner to COD as the disbursement process is run in Banner. The Banner Financial Aid implementation is scheduled for January 2017 for the 2017-18 aid year. Status: Implemented.
-92-
CONTINUING DISCLOSURE INFORMATION
-93-
COAST COMMUNITY COLLEGE DISTRICT 2015-16 LARGEST LOCAL SECURED TAXPAYERS (UNAUDITED) June 30, 2017
2016-17 Largest Local Secured Taxpayers (1)
Property Owner 1. 2. 3. 4. 5. 6. 7. 8. 9. 10. 11. 12. 13. 14. 15. 16. 17. 18. 19. 20.
The Irvine Company Bella Terra Associates LLC. PH Finance LLC Oxy USA Inc. South Coast Plaza PRII/MCC South Coast Property Owner LCC Block 500 Newport Center Drive LCC United Dominion Realty LP Hyndai Motor America McDonnell Douglas Corp. JKS-CMFV LLC Marjack LLC Irvine Company Westminster Mall LLC Interinsurance Exchange of the Automobile Club of America UDR Newport Beach North LP Casden Lakes LP Balboa Bay Club Ventures LLC Coronado South Apartments LP SOCO Retail Fee Owner ASN Long Beach LLC
2016-17 Assessed Valuation
% of Total(2)
Commercial Commercial Commercial Oil & Gas Commercial Commercial
$1,471,596,770 333,555,816 286,473,762 268,589,374 267,523,731 233,000,000
1.22% 0.28 0.24 0.22 0.22 0.19
Commercial Apartments Commercial Industrial Commercial Apartments Commercial Commercial
203,034,528 194,669,466 186,408,920 184,135,545 178,189,182 153,657,985 133,072,884 130,381,181
Apartments Apartments Commercial Apartments Industrial Apartments
129,962,688 126,946,891 126,036,927 124,735,592 120,000,000 117,350,468 $4,969,321,710
Primary Land Use
(1) Information obtained from California Municipal Statistics, Inc. (2) % of total assessed valuation for the fiscal year 2016-17 of $120,774,337,722
-94-
0.17 0.16 0.15 0.15 0.15 0.13 0.11 0.11 0.11 0.11 0.10 0.10 0.10 0.10 4.12%
COAST COMMUNITY COLLEGE DISTRICT SCHEDULE OF BUDGETARY COMPARISON FOR THE GENERAL FUND For the Fiscal Year Ended June 30, 2017
General Fund Variance Favorable Budget Revenue Revenue from Federal Sources Higher Education Act Temporary Assistance for Needy Families (TANF) Career and Technical Education Act Other Federal Revenue Revenue from State Sources General Apportionments Categorical Apportionments Other State Revenues Revenue from Local Sources Property Taxes Interest and Investment Income Student Fees and Charges Other Local Revenue
$
Total Revenue
Actual
1,430,753 $ 136,608 1,486,656 995,563
(Unfavorable)
970,714 $ 136,608 1,451,792 607,837
(460,039) (34,864) (387,726)
37,918,563 45,109,050 16,823,645
40,107,985 34,487,976 11,280,936
2,189,422 (10,621,074) (5,542,709)
124,064,988 428,400 30,150,092 5,197,833
120,884,154 606,248 33,290,058 7,495,483
(3,180,834) 177,848 3,139,966 2,297,650
263,742,151
251,319,791
(12,422,360)
Expenditures Academic Salaries Classified Salaries Employee Benefits Supplies and Materials Other Operating Expenses & Services Capital Outlay Other Uses Total Expenditures
91,521,665 63,002,837 62,805,088 7,476,243 48,587,363 9,374,941 3,986,778
89,178,225 55,988,494 62,130,350 4,768,185 23,984,095 6,925,018 3,394,512
2,343,440 7,014,343 674,738 2,708,058 24,603,268 2,449,923 592,266
286,754,915
246,368,879
40,386,036
Excess (deficiency) of revenues over expenditures
(23,012,764)
4,950,912
27,963,676
Other Financing Sources (Uses) Interfund Transfers In Interfund Transfers Out
300,000 (441,562)
300,000 (12,631,003)
(12,189,441)
Total Other Financing Sources (Uses)
(141,562)
(12,331,003)
(12,189,441)
Excess (deficiency) of revenues over expenditures and other sources (uses)
$
(23,154,326)
(7,380,091) $
Fund Balance at Beginning of Year
48,272,956
Fund Balance at End of Year
$
-95-
40,892,865
15,774,235