Mix Ratio Optimization of Cemented Coal Gangue Backfill (CGB) Based on Response Surface Method GUORUI FENG1,2,*, ZHEN LI1,2, YUXIA GUO1,2, JIACHEN WANG3, DIAN LI1,2, TINGYE QI1,2, GUOYAN LIU1,2, KAIGE SONG1,2 and LIXUN KANG1,2 1College
of Mining Engineering, Taiyuan University of Technology, Taiyuan 030024, Shanxi, China mining engineering technology research center of Shanxi Province, Taiyuan 030024, Shanxi, China 3College of Resource and Safety Engineering, China University of Mining and Technology, Beijing 100083, China 2Green
ABSTRACT: Central composite design (CCD) experiments were performed to investigate the effect of cement content, fine gangue rate and water reducer content on the rheological properties of fresh cemented coal gangue backfill (CGB) and the compressive strength of hardened slurry. The parameter of mixture proportion was optimized by Multi-criteria optimization analysis. The results show that the fresh CGB rheological property conforms to Bingham model, the yield stress of fresh slurry is influenced by the interaction of the three factors, and the plastic viscosity increases with cement content, fine gangue rate and water reducer content. The value of 28 days uniaxial compressive strength (UCS28) is proportional to cement content and water reducer content, while it is inversely proportional to fine gangue rate. The overall satisfaction of slurry rises significantly with the increase of water reducer content. However, it increases firstly and then decreases with the increase of cement content and fine gangue rate, and reaches a maximum at cement content of 210 kg/m3 and fine gangue rate of 40%. The developed design method can provide scientific reference to reduce the accumulation of waste residues.
1. INTRODUCTION
C
as an important fossil energy in the world, accounts for 30% of global primary energy consumption. However, coal mining has resulted in many problems, such as surface subsidence, solid waste accumulation, water contamination and gas leakage [1,2]. Coal gangue backfill (CGB) not only solves the problems of ground gangue accumulation and fly ash pollution, but also effectively obviates surface subsidence and the induced gas leakage. In recent years, paste filling mining technology has been greatly popularized and broadly applied as a new green coal mining technology [3,4]. Previous studies on CGB have gained substantial achievements. According to Miao, Yang and Qi each component (i.e. cement, milled gangues, fly ash and water reducer) of CGB plays a significant role in its rheological and mechanical performance (i.e., transportation, placement, strength and stability) [5,6,7]. In the work of Chang et al., the ratio of paste filling mateOAL,
*Author to whom correspondence should be addressed. E-mail:
[email protected]; Tel: +86 0351 6010177
rial was regarded as the core problem of paste filling technology, and artificial neural network method was adopted to predict and evaluate the ratio of filling material [8]. The pozzolanic effect of fly ash was found to probably improve the performance in CGB strength to certain extent by Feng [9]. Furthermore, it was concluded that the flow ability of fresh filling material is greatly enhanced by increasing the content of milled fly ash [10]. Zheng et al. stated that high content of fine gangue may enhance the slump and pumpability of the paste [11]. Qi studied the influences of fine gangue content on the strength, resistivity and microscopic properties of CGB for coal mining [12]. Wu studied the transportability and pressure drop of backfill slurry composed of freshly cemented coal gangue-fly ash in pipe loop [13]. However, the influences of raw material contents on coal mine CGB rheological and compressive strength properties, as well as the quantitative relationship between them, are still not well understood currently. Actually the optimization of coal mine CGB mixture ratio today is still based primarily on traditional experimental methods. This approach requires a large number of trial experiments to determine the desired
Journal of Residuals Science & Technology, Vol. 13, No. 3—July 2016 1544-8053/16/02 175-10 © 2016 DEStech Publications, Inc. doi:10.12783/issn.1544-8053/13/3/1
175
176
G. FENG, Z. LI, Y. GUO, J. WANG, D. LI, T. QI, G. LIU, K. SONG and L. KANG
concentrations of the CGB components. Meanwhile the mainly researches [12,14,15,16] performed on the optimization of CGB properties were only experimental and rarely taking all factors into consideration. Therefore a scientific mix proportioning method which can minimize the number of trial mixes and provides the quantitative relationship between CGB properties and raw materials are needed urgently. In the present study, the influences on CGB working properties are investigated by taking the cement content, fine gangue rate and water reducer content into consideration by using central composite experiment method (CCD). Meanwhile, a responsive surface (RS) regression model of yield stress, plastic viscosity and CGB strength is established to predict the CGB performance under various conditions. Lastly, multi-criteria optimization of CGB based on satisfaction function method are performed to provide useful reference for the prediction of CGB materials in coal mine. 2. MATERIALS AND METHODS 2.1. Materials The raw materials used in the present study included coal gangue, fly ash, cement, water and water reducer. 2.1.1. Coal Gangue The coal gangue samples were collected from Xinyang coal mine, which is located in Shanxi Province of China. Without dehydration and drying process, the samples were crushed mechanically and then categorized into two groups according to particle size, fine aggregate (0~5 mm) and coarse aggregate (10~15 mm). In present study both the fine and coarse gangue are selected as gangue materials. Meanwhile fine gangue rate means the percentage content of fine gangue in all gangue materials. The fineness modulus μ of the fine gangue (0–5 mm) was 3.02. Relative physical properties of the gangue samples are lists in Table 1. The chemical composition of the gangue samples was determined by A Thermo Fisher Scientific Thermo iCAP 6300 inductively coupled plasma optical emission spectrometer (ICP-OES) (Table 1). It should be noted that in the measurement of SiO2 percentage, samples were first burned at 800°C to remove organic matter and then measured in NaOH solution at 650°C. All the other oxides were measured from samples subject to sealed digestion in HF + HNO3 at 185°C.
2.1.2. Fly Ash The fly ash samples obtained from power plant of Xinyang coal mine falls in the category of Class II fly ash. An ICP-OES was used to analyze the chemical composition (Table 1). The physical properties listed in Table1 were determined according to the Technical Specification for Fly Ash Used in Concrete and Mortar (JGJ28-86). 2.1.3. Cement and Water Ordinary portland cement (Grade 42.5) with flexural strength of 6.5 MPa and compressive strength of 48.0 MPa was used in the present study. Its physical properties and chemical composition are listed in Table 1 (provided by the manufacturer). Tap water was used as the water source. 2.1.4. Water Reducer Highly effective poly carboxylic acid water reducer was used in the present study. The consumption of water reducer is determined by the percentage content of cemented materials [17]. In this study the fly ash were regarded as cemented materials as well as cement due to the cementation effect of fly ash caused by pozzolanic reactions [9,16]. 2.2. Sample Preparation and Test method 2.2.1. Sample Preparation Introduced by Box and Wilson [18], the response surface method (RSM) provides a scientific method to discover the relationship (polynomial equations) beTable 1. Chemical Components and Physical Properties of the CGB Materials. Major Element SiO2 Al2O3 Fe2O3 CaO MgO TiO2 Specific gravity (g/cm3) Specific surface (m2/kg) Fineness (> 45 µm), % Moisture content, % Lose on ignition, %
Gangue (%) Fly Ash (%) Cement (%) 35.46 16.11 3.86 7.15 3.50 0.80 2.0 499 53.78 8.0 –
52.42 32.48 3.62 3.05 1.01 1.26 2.2 415 42.54 0.56 3.8
22.27 5.59 3.47 65.90 0.81 – 3.1 349 5 – 2
Mix Ratio Optimization of Cemented Coal Gangue Backfill (CGB) Based on Response Surface Method Table 2. Factors and Their Levels in Respond Surface Analysis. Values –1.682 –1 0 1 1.682
Cement, Kg/m3 Fine Gangue, % 156.36 170 190 210 223.64
13.18 20 30 40 46.82
Water Reducer, % 0.23 0.3 0.4 0.5 0.57
tween an output variable and the levels of a number of input variables. Base on response surface method (RSM) principles, the concrete three factors and their five levels of response surface analysis are listed in Table 2. In the present work all the test groups have a constant fly ash content of 380 kg/m3, and the control
177
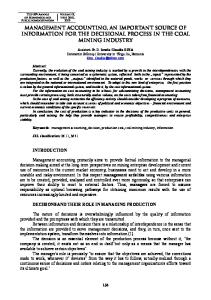
group (0 # group) contains no water reducer. All the solid content of the paste mixtures was 81% by weight. The content of cement ranges from 156.36 Kg/m3 to 223.64 Kg/m3; the fine gangue rate is between 13.18% and 46.82%; and the content of poly carboxylic acid water reducer is in the range of 0.23–0.57%. During each test the raw materials were mixed according to RS design and then mechanically stirred [Figure 1(a)]. Once well blended, the raw materials were tested for rheological properties [Figure 1(b)]. Then, the slurry was stirred again and poured into 10 × 10 × 10 cm3 testing moulds. As suggested by Ren [16], the specimens were cured in a curing room (temperature: 20 ± 2°C, humidity: 80%) for 28 days. Figure 1(c) shows the cured CGB samples. After that, the compressive tests were performed as shown in Figure 1(d).
Figure 1. Preparation and testing of CGB samples: (a) mixing; (b) rheological test apparatus; (c) cured CGB samples; and (d) UCS tests.
178
G. FENG, Z. LI, Y. GUO, J. WANG, D. LI, T. QI, G. LIU, K. SONG and L. KANG
2.2.2. Rheological and Compressive Strength Test The rheological properties of the fresh CGB samples, including yield stress and plastic viscosity, were tested by using a torque rheometer (ICAR RHM-3000) [19]. The rheometer allows for a maximum test sample size of 40 mm, which is much greater than the size of the samples prepared in the present study. The tests of CGB sample compressive strength after 28 days of curing (UCS28) were performed by using a computer controlled mechanical press with a load capacity of 1000 kN and a force change speed of 6.75 kN/min according to GB/T50080-2002. 3. RESULTS AND DISCUSSION 3.1. Experimental Results and Model Validation Based on RSM design (Table 2), the experimental results are summarized in Table 3. Multivariate regression analysis [as shown in Equations (1)–(3)] on yield stress (Y1), plastic viscosity (Y2) and UCS28 (Y3) is performed based on the data from Table 3, where X1 is cement content, X2 represents fine gangue rate and X3 denotes water reducer content. The main results of variance analysis of above regression model are summarized in Tables 4. In variance analysis the interaction item P value is used to determine whether there is a significance effect of variables. If p ≤ 0.05 there is a significant effect on y; P ≤ 0.01, there is a quite significant effect on y; P > 0.05, it means there is no significant effect on y. Yield stress: Y1 = 1938.57321 − 15.93198 X 1 − 17.32805 X 2 + 1234.42384 X + 0.090250 X X − 3.48750 X X 1 2 1 3 3 2 2 −0.875 X 2 X 3 + 0.039593 X 1 + 0.025789 X 2 +1129.80599 X 32 (1) Plastic viscosity: Y2 = 0.13548 X 1 + 0.18426 X 2 + 39.88511X 3 − 37.01671
(2)
Y3 = 0.050619 X 1 − 0.016908 X 2 + 6.22826 X 3 − 3.19611
(3)
UCS28:
As illustrated in Equation (1) and Table 4, The yield stress (Y1) regression model conforms to the a secondorder response surface. The factors that significantly influence the yield stress of the CGB are water reducer and fine gangue rate. The interactions between cement content and fine gangue rate also play a quite significant role on the yield stress of fresh CGB (P < 0.01). The quadratic terms X 12 and X 32 are also statistically significant (P < 0.05). The plastic viscosity (Y2) and the UCS28 (Y3) are calculated by first-order equations, as expressed in Equations (2) and (3). The cement, fine gangue rate and water reducer are both have quite significantly influence on plastic viscosity (P < 0.01). Table 4 also listed the results of variance analysis on UCS28 by regression model. All the P values of X1, X2 and X3 are smaller than 0.01, indicating that all the factors have quite significantly influence on UCS28. The interactions between each factor are not significant (P > 0.05). In present study the P values of each model were less than 0.0001, indicating that the regression model results are rather significant. Meanwhile the P values of “lack of fit” items are greater than 0.05, which indicates that every regression model is correct [20,21,22]. To verify the validity of the developed models, the model predictions results were compared with experimental tests data. Figure 2 listed the experimental verification of the accuracy of the models. As is shown there is a good agreement between model predictions and experimental values. The distribution of the scattered points approximately follows the straight line of y = x, which indicates that the model fits very well. 3.2. Influence of Response Surface Parameters on Transport Characteristics Figure 3 shows the relationship between torque and speed, the values of which are obtained by rheometer (ICAR RHM-3000). The figure indicates there is a linearly increasing relationship between shear force and the shear rate of fresh CGB. The slurry flow behavior index has a value of n = 1. As is shown in Figure 3, the intercept of Y-axis gives the slurry yield stress and the slope of the line indicates the plastic viscosity. It is evident that the slurry flow falls in a non-Newtonian fluid Bingham model [16,21].When water reducer is increased by 0.4% from 0 # to 2 #, the yield stress decreases by 25% and the plastic viscosity increases by about 100%. The reasons can be explained as follows. On the one hand, the water reducer molecules are adsorbed on the surface of cement particles, which is
179
Mix Ratio Optimization of Cemented Coal Gangue Backfill (CGB) Based on Response Surface Method Table 3. Results of RS Experiment. No
Cement (X1) Kg/m3
Fine Gangue (X2), %
Water Reducer (X3), %
Yield Stress (Y1), Pa
Plastic Viscosity (Y2), Pa·s
UCS28 (Y3), MPa
0 1 2 3 4 5 6 7 8 9 10 11 12 13 14 15 16 17 18 19 20
190 210 190 170 210 190 190 156.4 190 190 190 190 210 170 223.6 190 170 190 210 190 170
30 20 30 20 40 30 30 30 30 30 46.82 30 20 40 30 30 20 30 40 13.18 40
0 0.3 0.4 0.5 0.5 0.4 0.23 0.4 0.4 0.4 0.4 0.57 0.5 0.5 0.4 0.4 0.3 0.3 0.3 0.4 0.3
540.7 413.4 400 381.2 387.5 408.9 427.8 407.8 358.9 384.4 420 303.1 333.2 367.1 476.6 360.7 437.3 408.9 475 389.4 422.9
5.4 4.9 10.8 8.7 18.4 10.4 3.32 4.8 9.5 8.9 10.9 19 15.5 13.6 13.9 11.3 4 10.3 14.2 6.7 5
6.32 9.1 8.44 8.42 9.8 8.11 7.2 6.8 8.48 8.49 7.9 9.57 10.2 7.6 10.05 8.62 6.69 8.43 8.84 8.5 6.87
Table 4. Results of Variance Analysis on Yield Stress, Plastic Viscosity, UCS28 by Regression Model. Variance Analysis
Variation Source
Sum of Squares
Freedom
Mean-square
F Value
P Value
Model X1 X2 X3 X1 X2 X2 X3 X1 X3 X12 X22 X32 Residual Lack of fit
29031.00 990.52 1411.96 17532.12 2606.42 6.13 389.20 3614.58 95. 85 1839.55 2111.11 1428.04
9 1 1 1 1 1 1 1 1 1 10 5
3255.67 990.52 1411.96 17532.12 2606.42 6.13 389.20 3614.58 95. 85 1839.55 211.11 285.61
15.28 1.82 2.59 18.55 4.78 0.011 0.71 12.24 1.80 8.56
< 0.0001 0.0555 0.0271 < 0.0001 0.0056 0.8681 0.2044 0.0020 0.5157 0.0145
Significant
2.09
0.2188
Not Significant
363.89 100.27 46.37 217.26 38.99 35.19
3 1 1 1 16 11
121.30 100.27 46.37 217.26 2.44 3.20
49.78 41.15 19.03 89.16
< 0.0001 < 0.0001 0.0005 < 0.0001
Significant
Plastic Viscosity
Model X1 X2 X3 Residual Lack of fit
4.24
0.0624
Not Significant
19.68 14.00 0.39 5.30 0.6 0.46
3 1 1 1 16 11
6.56 14.00 0.39 5.30 0.038 0.042
173.73 53.38 1.27 18.85
< 0.0001 < 0.0001 0.0054 0.0001
Significant
UCS28
Model X1 X2 X3 Residual Lack of fit
1.44
0.3602
Not Significant
Yield Stress
↓
↓
↓
180
G. FENG, Z. LI, Y. GUO, J. WANG, D. LI, T. QI, G. LIU, K. SONG and L. KANG
Figure 2. Comparison between predicted and the tested values: (a)Yield stress; (b) Plastic viscosity; and (c) UCS28.
adverse to aggregation of cement particles and results in disintegration of flocculated cement structure. The free water released from the flow of cement effectively increases the liquidity of the slurry. On the other hand, water reducer reduces the liquid-gas interfacial tension and creates a certain air entraining effect. In addition to the bubble ball and floating effect, there is stronger tendency of relative sliding between the cement particles and the aggregates. Figure 4 shows the effects of cement content and fine gangue content on fresh CGB yield stress when the content of water reducer takes up 0.4%. With the increase of cement content, the yield stress decreases firstly and then increases. The slurry has the lowest yield stress when cement content is 190 kg/m3.With the increase of the fine gangue rates, the yield stress
shows an upward trend. As is shown in Table 4 and Equation (2), cement content, fine gangue rate and water reducer have significant influences on slurry plastic viscosity. The impact of these factors on plastic viscosity follows the order: water reducer > cement content > fine gangue rate. 3.3. Influence of Response Surface Parameters on UCS28 UCS28 increases by about 50% when cement content rises from 156.4 kg/m3 (7#) to 223.6 kg/m3 (14#) under the same experimental conditions. This is mainly due to gelling properties of the cement. The more cement, the greater the strength is. However, more cement means greater cost too. When fine gangue rate is
Mix Ratio Optimization of Cemented Coal Gangue Backfill (CGB) Based on Response Surface Method
181
Figure 3. Relational graphs of rheological parameters.
increased from 20% in 1 # to 40% in 18 #, the UCS28 drops from 9.1 MPa to 8.84 MPa, which is a slight decline of 2.8%. The water reducer rate increases from 0% in 0 # to 0.4% in 2 #, and UCS28 climbs from 6.32 MPa to 8.44 MPa, which is a 33% increase. The reasons are as follows: the water reducer disperses the cement particles and promotes the release of free water trapped in cement floccules. Larger amount of water effectively promotes hydration and pozzolanic reactions, and brings an increase of CGB strength. The corresponding SEM images of cube specimens failure section are shown in Figure 5 [Figure 5(a) is for 0# and Figure 5(b) is for 2#]. By contrast the reasons can be drawn as follows: the molecular structure of the long side chain of poly carboxylic acid water reducer tightens the connection between the particles and aggregates.
Figure 5. The microscopic scanning image of specimen failure section: (a) 0% water reducer and (b) 0.4% water reducer.
This promotes the formation of dense and compact grid structure of C-S-H (hydrated calcium silicate), which can be seen in in Figure 5(b) easily. The dense spatial structure greatly improves the CGB body strength. 4. NONLINEAR MULTI-CRITERIA OPTIMIZATION OF CGB 4.1. Optimization Method The aim of the optimization is to find optimal CGB mixes. Based on the former experimental results, the optimization principles must simultaneously satisfy the following criteria: Figure 4. Interaction effects of cement and fine gangue rate on fresh CGB with water reducer content of 0.4%.
1. Suitable values of yield stress and plastic viscosity to guarantee slurry transport; 2. Sufficient UCS28 to ensure sufficient roof support.
182
G. FENG, Z. LI, Y. GUO, J. WANG, D. LI, T. QI, G. LIU, K. SONG and L. KANG
Table 5. Optimization Range of Response Objectives. Response Objectives Range
Yield Stress, Pa
Plastic Viscosity, Pa·s
UCS28, MPa
350 < Y1 < 470
6 < Y2 < 14
7 < Y3 < 10.5
Since the experiment involves optimization of multiple factors response, the Multi-criteria optimization of CGB mixture ratio was applied. This optimization is based on Multi-criteria decision-making principles according to Derringer and Suich [23]. This method is based on construction of a satisfaction function for each individual model response, as expressed in Equation (4) and Equation (5) [22,24]. According to Equation (4), larger values of UCS28 and the plastic viscosity are desirable; while according to Equation (5), smaller value of yield stress is expected in optimization. Taking the actual mining conditions of Xinyang coal mine into account, the determined range of response optimization targets are illustrated in Table 5. Hence, the satisfaction function of each regression model [di(Yi(X))] are established firstly. Then the multiobjective optimization function based on mean weighted geometry of each single satisfaction, namely overall satisfaction function, was established [Equation (6)]. 0 Y ( X ) − Li di (Yi ( X )) = i Yi ,max ( X ) − Li 1
Yi ( X ) ≤ Li Li ≤ Yi ( X ) ≤ Yi ,max ( X ) Yi ( X ) ≤ Yi ,max ( X ) (4)
0 Yi ( X ) ≥ Yi ,max ( X ) Yi ( X ) − Yi ,max ( X ) di (Yi ( X )) = Li ≤ Yi ( X ) ≤ Yi ,max ( X ) Li − Yi ,max ( X ) Yi ( X ) ≤ Li 1 (5) where di is the satisfaction degree function of the ith response, Yi(X) is the ith response value, Li is the ith lower limit of response values, Yi,max(X) is the ith upper limit of response values. D = (Π iq=1diri )1 Σri
(6)
where ri is weights, depending on the importance of the response surface in the optimal design.
4.2. Analysis of Optimization Results In practical engineering applications, slurry transport performance is determined by yield stress and plastic viscosity, and UCS28 determines its carrying capacity of the overburden. Thus in this work we set the same degree of importance for each response surface regression model, i.e., r1 = r2 = r3. According to Equations (4) and (5), the CGB performance satisfaction distribution is calculated as shown in Figures 6(a), 6(b), and 6(c) for single factor. Meanwhile, the CGB overall performance satisfaction distribution based on multi-objective combinations is established according to Equation (6) [Figure 5(d)]. By increasing the cement content and fine gangue rate, the CGB satisfaction degree increases firstly and then goes down and reaches the maxima at cement content of 210 kg/m3 and fine gangue rate of 40%. The CGB satisfaction degree increases rapidly with the rise of water reducer content. There is no obvious inflection point in Figure 6(c), which indicates individually increase water reducer dosage to improve the overall transport performance can obtain obvious satisfaction. As is shown in Figure 6(d), at water reducer content of 0.23% the highest satisfaction degree reaches 0.2, while at water reducer content of 0.3% the highest satisfaction degree is greater than 0.4. With the increase of water reducer content, the satisfaction degree presents an increasing trend. When water reducer dosage is greater than 0.3%, the overall performance of CGB is very sensitive to the change of cement content. More cement content corresponds to higher overall satisfaction. The group of 223.64 Kg/m3 cement content, 30% fine gangue and 0.57% water reducer leads to the highest satisfaction degree. However, the unit volume of cemented materials and admixtures directly determines the amount of CGB costs. Therefore, the results suggests an optimal CGB composition of 190 Kg/m3 cement content, 30% fine gangue and 0.5% water reducer ratio. 5. CONCLUSION In this study, a response surface method by CCD experiment is proposed to investigate the influence of cement content, fine gangue rate and water reducer content on CGB transport and mechanical properties. The prediction model for yield stress, plastic viscosity and UCS28 is developed, in which a second-order response surface model is applied to yield stress and a first-order
Mix Ratio Optimization of Cemented Coal Gangue Backfill (CGB) Based on Response Surface Method
183
Figure 6. (a), (b), (c) CGB satisfaction degree under the single factor and (d) multi-objective combinations.
response surface function model is adopted for Plastic viscosity and UCS28. This method is able to accurately predict the test results and provides useful guides for practical design. The fresh CGB rheological properties conform to the bingham plastic model by using type ICAR rheometer measurements to test yield stress and plastic viscosity. The relevant rheological parameter can realize the quantitative evaluation on the properties of fresh CGB transport. Based on the response surface function, an overall satisfaction function of CBG is established to evaluate the performance of CGB. The study shows that the satisfaction degree increases quickly with the increase of water reducer content. Meanwhile the satisfaction degree first increases and then decreases with the increase of cement and fine gangue rate. It reaches the highest value at cement content of 210 kg/m3 and fine gangue
rate of 40%. Therefore, the optimal mixing proportion is suggested. 6. ACKNOWLEDGEMENTS This research is supported by the National Science Fund for Excellent Young Scholars (No.51422404), the National Natural Science Foundation of China (No.51174142, 51574172), the Key Scientific and Technological Coal Projects of Shanxi Province (MQ2014-12), the Program for the Innovative Talents of Higher Learning Institutions of Shanxi, the Program for New Century Excellent Talents in University of China (NCET-11-1036), the Fok Ying Tung Education Foundation ( No.132023), the Scientific and Technological Achievements Promotion Project of Shanxi Province ( No.2013071050) and Postgraduate Innovate Project of Shanxi Province (No.800104/02100739).
184
G. FENG, Z. LI, Y. GUO, J. WANG, D. LI, T. QI, G. LIU, K. SONG and L. KANG
7. REFERENCES 1. Bell F.G., Stacey T.R., Genske D.D., Mining subsidence and its effect on the environment: some differing examples, Environ. Geol, Vol. 40, No. 1, 2000, pp. 135–152. http://dx.doi.org/10.1007/s002540000140 2. Tiwary R.K., Environmental impact of coal mining on water regime and its management, Water Air Soil Pollution, Vol. 132, No. 1, 2001, pp. 185–199. http://dx.doi.org/10.1023/A:1012083519667 3. Miao X.X., Qian M.G., Research on green mining of coal resources in China: current status and future prospects, J. mining & Safety Eng., Vol. 26, No. 1, 2009, pp.1–14. 4. Khaldoun A., Ouadif L., Baba K., Bahi L., Valorization of mining waste and tailings through paste backfilling solution, Imiter operation, Morocco, Int J. Min Sci Tech, Vol. 26, No. 3, 2016, pp. 511–516. http:// dx.doi.org/10.1016/j.ijmst.2016.02.021 5. Yang B.G, Li Y.L, Dang P., Peng Y.H., Wang Y.K, Influence of fly ash on performance of high concentration cemented backfill material in coal mine, J. Chem. Pharm. Res, Vol. 7, No. 2, 2015, pp. 351–3561. 6. Qi T.Y, Feng G.R., Zhang Y.J.,Guo J., Guo Y.X., Effects of fly ash content on properties of cement paste backfilling. J. Residuals Sci Tech, Vol. 12, No. 3, 2015, pp. 133–141. http://dx.doi.org/10.12783/ issn.1544-8053/12/3/3 7. Yilmaz E., Kesimal A., Ercikdi B., Strength properties in varying cement dosages for paste backfill samples. In: Proceedings of the 10th International Conference on Tailings and Mine Waste, Balkema, Swets and Zeitlinger, Lisse12-15 October, Colorado, USA, 2003, pp. 109– 114. 8. Chang Q.L., Zhou H.Q., Qin J.Y., Using Artificial Neural Network Model to Determine the Prescription of Paste Filling Materials, J mining & Safety Eng., Vol.26, No.1, 2009, pp. 74–77. 9. Feng G.R, Ren Y.F, Zhang X.Y. The activating experimental research of fly ash for mining filling material in Tashan Mine, J. China Coal Society, Vol. 36, No. 5, 2011, pp. 732–737. 10. Yao Y. and Sun H.H., Characterization of a new silica alumina-based backfill material utilizing large quantities of coal combustion byproducts, Fuel, Vol. 97, 2012, pp. 329–336. http://dx.doi.org/10.1016/j. fuel.2012.01.057 11. Zheng B.C, Zhou H.Q., He R.J., Experimental research on coal gangue paste filling material, J. Mining & Safety Eng., Vol. 23, No. 4, 2006, pp. 460–463.
12. Qi T.Y, Feng G.R, Li Y.R, Guo Y.X., Effects of Fine Gangue on Strength, Resistivity, and Microscopic Properties of Cemented Coal Gangue Backfill for Coal Mining, Shock and Vibration, Vol. 2015, Article ID 752678, 11 pages. 13. Wu D., Yang B.G., Liu Y.C., Transportability and pressure drop of fresh cemented coal gangue-fly ash backfill (CGFB) slurry in pipe loop. Powder Technol., Vol. 284, 2015, pp. 218–224. http://dx.doi. org/10.1016/j.powtec.2015.06.072 14. Kesimal A., Ercikdi B., Yilmaz E., The effect of desliming by sedimentation on paste backfill performance, Miner. Eng., Vol. 16, No. 10, 2003, pp. 1009–1011. http://dx.doi.org/10.1016/S0892-6875(03)00267-X 15. Fall M., Benzaazoua M., Ouellet S., Effect of tailings properties on paste backfill performance. In: Proceedings of the 8th International Symposia on Mining with Backfill, Beijing, China, 2004, pp. 193–202. 16. Ren A., Feng G.R., Guo Y.X., Influence on performance of coal mine filling paste with fly ash, J. China Coal Society, Vol. 39, No. 12, 2014, pp. 2374–2380. 17. Zhou Y. Experimental study on the effect caused by water reducer on concrete, Concrete, Vol.11, 2012, pp. 86–88. 18. Box G.E.P., Wilson K.B., On the experimental attainment of optimum conditions, J. Royal Stat. Soc., Vol. 13, No. 1, 1951, pp. 45–65. 19. Xie H.B., Liu F., Fan Y.R., Workability and proportion design of pumping concrete based on rheological parameters. Constr and Build Mater., Vol. 44, 2013, pp. 267–275. http://dx.doi.org/10.1016/j.conbuildmat.2013.02.051 20. Fall M., Benzaazoua M., Modeling the effect of sulphate on strength development of paste backfill and binder mixture optimization, Cement Concrete Res., Vol. 35, No. 2, 2005, pp. 301–314. http://dx.doi. org/10.1016/j.cemconres.2004.05.020 21. Zhang X.G. 2013. The study of key techniques of coal paste filling, Beijing, China: Coal Industry Publishing Press. 22. Khanchi A.R., Sedighi H., Ansar S., Fasihi J., Preconcentration of rare earth elements from Iranian monazite ore by spiral separator using multi-response optimization method, Int J. Min Sci Tech, Vol. 24, No. 1, 2014, pp. 117–121. http://dx.doi.org/10.1016/j.ijmst.2013.12.020 23. Derringer, G., Suich, R., Simultaneous optimization of several responses variables, J. Qual Technol., Vol. 12, No. 4, 1980, pp. 214–219. 24. Fall M., Benzaazou M., Mix proportioning of underground cemented tailings backfill. Tunn Undergr Sp Tech., Vol. 23, No. 1, 2008, pp. 80–90. http://dx.doi.org/10.1016/j.tust.2006.08.005