Seventh Northwest Conservation and Electric Power Plan
CHAPTER 12: CONSERVATION RESOURCES Contents Key Findings ..................................................................................................................................... 4 Overview ........................................................................................................................................... 9 Power Act Requirements for Conservation .................................................................................... 9 Estimating Conservation Potential ............................................................................................... 11 Conservation Resource Characteristics ....................................................................................... 12 Methodology for Determining Conservation Potential................................................................... 12 Key Data Sources ........................................................................................................................ 17 Factors Impacting Conservation Potential Since the Sixth Power Plan ............................................ 18 Significant Conservation Achievements ....................................................................................... 19 Federal and State Codes and Standards ..................................................................................... 19 New Sources of Conservation Potential ....................................................................................... 21 Stock Assessments...................................................................................................................... 21 Achievable Potential Estimates by Sector ....................................................................................... 21 Residential Sector ........................................................................................................................ 21 Resource Type ......................................................................................................................... 21 Comparison to Sixth Power Plan .............................................................................................. 22 Savings by End-use ................................................................................................................. 22 Major and New Residential Measures ...................................................................................... 23 Residential Sector Summary .................................................................................................... 24 Commercial Sector ...................................................................................................................... 27 Resource Type ......................................................................................................................... 27 Comparison to Sixth Power Plan .............................................................................................. 27 Savings by End-use ................................................................................................................. 27 Major and New Commercial Measures ..................................................................................... 28 Commercial Sector Summary................................................................................................... 30 Industrial Sector ........................................................................................................................... 33 Resource Type ......................................................................................................................... 33 Comparison to Sixth Power Plan .............................................................................................. 33 Savings by End-use ................................................................................................................. 33 Major and New Industrial Measures ......................................................................................... 35 Industrial Sector Summary ....................................................................................................... 36 Agriculture Sector ........................................................................................................................ 38 Resource Type ......................................................................................................................... 38 Comparison to Sixth Power Plan .............................................................................................. 38 Savings by End-use ................................................................................................................. 38 Major and New Agricultural Measures ...................................................................................... 39
nwcouncil.org/7thplan
12-1
Chapter 12: Conservation Resources
Agricultural Sector Summary .................................................................................................... 39 Utility Distribution Systems........................................................................................................... 41 Resource Type ......................................................................................................................... 42 Comparison to Sixth Power Plan .............................................................................................. 42 Savings by Measure ................................................................................................................. 42 Major and New Distribution System Measures ......................................................................... 43 Utility Distribution System Sector Summary ............................................................................. 43 Total Conservation Potential- All Sectors ..................................................................................... 45 Conservation Scenarios modeled .................................................................................................... 46 Conservation Scenario 1: Testing Annual Pace Constraints ....................................................... 47 Conservation Scenario 2: Testing Emerging Technologies’ Deployment Assumptions ............... 49 Direct Application Renewables .................................................................................................... 52 Distributed Solar Photovoltaics................................................................................................. 52 State of Washington’s Energy Independence Act Implications ........................................................ 55
nwcouncil.org/7thplan
12-2
Chapter 12: Conservation Resources
List of Figures and Tables Figure 12 - 1: Technical Achievable Conservation Potential in 2035 by Levelized Cost ..................... 5 Figure 12 - 2: Peak and Energy Impacts by Levelized Cost Bundle for 2035 ..................................... 7 Figure 12 - 3: Maximum Cumulative Availability of Conservation Resources Over 20-year Plan Period................................................................................................................................................ 8 Figure 12 - 4: Maximum Cumulative Availability of Conservation Resources Over First Six Years ... 9 Figure 12 - 5: Approach to Setting Conservation Targets ................................................................ 10 Figure 12 - 6: Levels of Conservation Potential ............................................................................... 11 Figure 12 - 7: Conservation Acquisition Ramp Rates ...................................................................... 16 Figure 12 - 8: Conservation Supply Curve by Resource Type ......................................................... 17 Table 12 - 1: New or Revised Federal Electric Standards Incorporated in Seventh Power Plan Conservation Assessment Baseline Assumptions ........................................................................... 20 Figure 12 - 9: Residential Potential by End-use and Levelized Cost by 2035 .................................. 23 Table 12 - 2: Summary of Potential and Cost for Residential Measure Bundles .............................. 25 Figure 12 - 10: Commercial Potential by End-use and Levelized Cost by 2035 ............................... 28 Table 12 - 3: Summary of Potential and Cost for Commercial Measure Bundles ............................. 31 Figure 12 - 11: Industrial Potential by End-use and Levelized Cost by 2035.................................... 34 Figure 12 - 12: Industrial Sector Savings Potential by Industry Segment by 2035 ........................... 35 Table 12 - 4: Summary of Potential and Cost for Industrial Measure Bundles ................................. 37 Figure 12 - 13: Agriculture Potential by End-use and Levelized Cost by 2035 ................................. 39 Table 12 - 5: Summary of Potential and Cost for Agriculture Measure Bundles ............................... 40 Figure 12 - 14: Distribution System Potential by Measure and Levelized Cost by 2035 ................... 43 Table 12 - 6: Summary of Potential and Cost for Utility Measure Bundles ....................................... 44 Figure 12 - 15: Cumulative Potential by Sector and Levelized Cost by 2035 ................................... 45 Figure 12 - 16: Monthly Savings Shape for All Conservation Measures during Heavy and Light Load Hours .............................................................................................................................................. 46 Figure 12 - 17: Comparison of Maximum Conservation Available For Pace Scenarios over Plan Period.............................................................................................................................................. 48 Figure 12 - 18: Comparison of Maximum Conservation Available for Pace Scenarios during First Six years of Plan ................................................................................................................................... 48 Table 12 - 7: Emerging Conservation Technologies ........................................................................ 50 Figure 12 - 19: Cost Trend for Distributed Photovoltaics.................................................................. 53 Table 12 - 8: Distributed Solar PV Estimated Costs and Maximum Achievable Potential ................ 54
For most of this chapter the Council presents results using the medium range of the forecast. In the section entitled “Total - All Sectors”, the Council includes the entire range of uncertainty regarding the drivers. This is done to reinforce the fact that the future is uncertain. The Council’s planning process does not use a single deterministic future to drive the analysis. The stochastic variation introduced in the Regional Portfolio Model tests a wide range of future uncertainties in load, fuel prices, etc.
nwcouncil.org/7thplan
12-3
Chapter 12: Conservation Resources
KEY FINDINGS The Northwest Power Act defines conservation as reduced electric power consumption as a result of improved efficiency in energy use. This means that less electricity is needed to provide the same level of services. Conservation resources are measures that ensure that new and existing residential buildings, household appliances, internal and external lighting systems, new and existing commercial buildings, commercial-sector appliances, commercial infrastructure such as street lighting and sewage treatment, and industrial and irrigation processes are energy efficient. These efficiencies, when cost-effective, reduce operating costs by cutting back on the operation of the least-efficient existing power plants; ultimately reducing the need to build new power plants and expand transmission and distribution systems. Conservation also includes measures to reduce electrical losses in the region's generation, transmission, and distribution systems where the measures result in a reduction in electrical power consumption. The Council’s assessment of conservation resources includes six major updates since the Sixth Power Plan: 1. Accounting for utility conservation programs and other savings since 2010, including removal of measures that have saturated the market (e.g. LED TVs). 2. Adjusting both the load forecast 1 and the conservation assessment to reflect improvements in federal and state standards for lighting, appliances, and other equipment. 3. Adding potential savings from new technologies and practices that have matured to commercial readiness since the development of the Sixth Power Plan’s estimates. 4. Updating estimates of energy equipment saturation, gas and electric fuel shares, and other key building characteristics from the residential, commercial, and industrial stock assessments. 5. Updating forecasts of the number of new homes, businesses, and farms. 6. Updating costs to be in 2012 constant dollars. The Council identified around 5,100 average megawatts 2 of technically achievable conservation potential in the medium demand forecast by the end of the forecast period. Not all of the conservation potential identified is cost-effective to develop in all future scenarios; nor is all of it immediately available. The Council uses its regional portfolio model (RPM) to identify the amount of conservation that can be economically developed. The results presented in this chapter serve as an input to the RPM, which tested varying amounts and pace of conservation development against other resource options across a wide range of future conditions. The results of the RPM analysis are presented in Chapter 15.
1 2
See Chapter 7 for details on the load forecast All savings values are at busbar.
nwcouncil.org/7thplan
12-4
Chapter 12: Conservation Resources
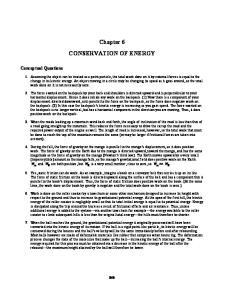
The total technical achievable potential in 2035 by total resource cost (TRC) net levelized cost 3 bin is shown in Figure 12 - 1. Around 4,300 average megawatts of conservation are available at costs less than $100 per megawatt-hour (2012$). Another 800 average megawatts are available at costs above $100 per megawatt-hour. Figure 12 - 1: Technical Achievable Conservation Potential in 2035 by Levelized Cost
Technical Achievable Potential (aMW)
6,000 5,000 4,000 3,000 2,000 1,000
>200