CALIBRATION PROCEDURE OF MATERIAL TESTING MACHINES IN KENYA. David Kimetto Kenya Bureau of Standards Metrology Department P.O Box 54974 00200 Nairobi, Kenya Tel: (+254 020) 605573/4 E-mail:
[email protected]
ABSTRACT This paper highlights how the S.I unit of force (Newton) is realized in the Kenya Bureau Of Standards force laboratory. The use of the 1MN Multi-Lever Force Standard Machine. The dissemination of the Unit (N) in the organization (KEBS) and in the Kenyan industry. Calculation if uncertainty of measurement
1.0.
INTRODUCTION
The calibration of material testing machines (Tensile/Compression/Universal) using calibrated force-proving instruments (Load cells, proving Rings and Digital compensators (Read outs)). It applies for the Kenya Bureau of Standards owned testing machines and those for external clients from the Kenyan’s Industries. The Load cells and proving Rings are calibrated in the Laboratory using the 1 MN Multi-Lever Force Standards Machine. 2.0.
THE FORCE STANDARD MACHINE AT KENYA BUREAU OF STANDARDS
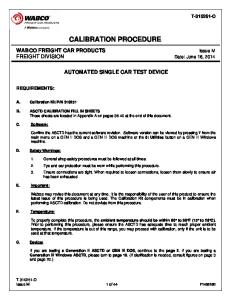
Fig. 1: General view of the 1MN Multi-Lever Force Machine at the KEBS /3/
Fig. 2: Schematic Diagram of the 1MN Multi-Lever Force Machine at the KEBS /3/
The force standard machine at Kenya Bureau of Standards was installed in 1981. These is the only Force standard machine at the KEBS Force laboratory, carrying out the verification in the range from secondary standards to ordinary force measuring devices. The machine is a compound lever system, Fig. 1, /3/, with a maximum capacity of 1000kN (1MN).It is a prototype machine, where the dead weight part of the machine is replaced by a modified weighing machine with incorporated weights. In order to take care of the disadvantages of the lever deflection, the lever length is reduced by dividing the total multiplication ratios as shown in fig. 2, /3/. The nominal capacity of the machine is divided into seven ranges with a nominal
1
capacity of 10kN, 20kN, 50kN, 100kN, 200kN, 500kN and 1MN, each having a different multiplication ratio. On the average, the multiplication ratio varies from 1:2000 at the lower ranges to 1:15000 in the 1MN range. For the generation of force steps at 10% intervals, in each of the seven ranges, the weighing machine is equipped with 70 weights. This type of design has helped in achieving a compact and very stable machine. 2.1. 1. 3. 4. 5. 7. 9. 10. 13. 14. 18. 22.
EXPLANATION OF FIG. 2 Base Frame 2. Loading Frame 6. Lower Platen for compression Force Transducer 8. Upper platen for Transducer 11. Adjustable support 16. Control motor for opposite Forces on support 19. Loading lever of the weighing 12. Force transducer for control circuits 15. Displacement transducer for control circuits 17. Space for tension device 20. Force transducer for overload protection 21.
Compound lever system Fitting for tension device Spindle with ball bearing Weight cradle Controller Calibration weights Weights Amplifier Space for compression device Mechanism for lifting weights Eddy current brake
2.2.` PERFORMANCE OF MACHINE SINCE INSTALLATION The machine at the KEBS was installed in 1981 when the Metrology Laboratories were set up. Inter-comparison Measurement performed by PTB in 1981, 1985, 1987 and 1990 have all proved that the design can be relied on. The uncertainty of ±4.10-4 realistically covers the operational range of the machine. The performance of the machine at the different ranges can be summarized as RANGE
UNCERTAINTY
5kN 10kN 20kN 50kN 100kN 200k 500kN 1MN
±3.10-4 ±2.10-4 ±7.10-4 ±0.2.10-4 ±1.2.10-4 ±1.2.10-4 ±1.5.10-4 ±4.10-4
At 20kN and below, the accuracy can be quoted at ±6.10-4 and since this covers the machine quite well, it could be taken to be a realistic representation of the overall accuracy of the machine. At values greater than 20kN but less than 800kN, the accuracy is much better and the machine can fairly compete with deadweight Force Standard Machine within these ranges. However, at values greater than 800kN the accuracy of the machine deteriorates. As pointed out earlier, the machine is a prototype compound lever transmission machine and even if it uses the normal acceptable principles, it has its own peculiar characteristics
2
3.0.
BRIEF PROCEDURE OF CALIBRATION OF A FORCE SENSORS (LOADCELL)
3.1. 3.1.1
Preliminary Preparation Mount the load cell centrally on the Force Standard machine according to the mode of loading:For compression, the load cell is placed centrally between the to loading platens and the appropriate adaptor placed. For tensile, appropriate accessories are used to fix the load cell in the machine. The load cell is connected to the digital compensator (readout) by the connecting cable The machine safety is set at 110% of the load cell capacity. The load cell weight is tared of the machine The appropriate range for the load cell under test is set. The machine is switched on for 30 minutes to attain equilibrium (warm up) The load cell is subjected to cyclic maximum loading to relieve it of any inherent internal stresses (pre-loading three times to the maximum value
3.1.2 3.1.3 3.1.4 3.1.5 3.1.6 3.1.7
3.2. 3.2.1 3.2.2
3.2.3 3.2.4 3.3. 3.3.1
Calibration The machine is operated according to document QMET3/OP/01. Which is kept in the laboratory. During calibration, the load cell is rotated through 0°, 120°and 240°in clockwise direction after each set of reading in order to reduce the error that may occur due to eccentric loading. Two sets of increasing load readings are taken at 0°, one setoff increasing and one set of decreasing load reading at 120° and 240° at intervals of 10% of the load cell capacity Pre-load is done once at position 120° and 240° respectively Analysis of Results This is done in order to classify the load cell:i) Error = Applied force – Indicated force
( Applied
ii)
%Error =
iii)
Play (Repeatability)
iv
Variation coefficient
force − Indicated force) x100% Applied force Highest deviation in loadcell x100% = Mean( x ) Highest deviation in reverse loading x100 = Mean( x )
4.0.
CALIBRATION OF MATERIAL TESTING MACHINE
4.1. 4.1.1
Preliminary Preparation Check the testing machine by visual inspection/observation, functional and operational tests to determine if the machine is in good working order. Clean the machine thoroughly until the loading platens and/or tensile jaws are free of grease, oil and dirt. Mount the load cell centrally between the loading platens of machine and connect the digital compensator (DK 38 readout) . Connect DK 38 readout to an AC power source 240V/50HZ out, switch on and leave it for 30 minutes to attain equilibrium (warm-up). For a machine with many ranges, set the range under calibration starting with the range containing the of the machine.
4.1.2 4.1.3 4.1.4 4.1.5
3
4.1.6
For compression move the loading platen to within an air gap off (1mm) the load cell and set the machine gauge and digital readout to zero.
4.1.7
Pre-load the load cell three times to machine capacity to remove any inherent stresses in the load cell and record the values. During pre-load, the load is left to act approximately one and half of a minute each time.
4.2 . 4.2.1 4.2.2
Calibration Six sets of increasing load readings are taken at 10% intervals of the machine capacity The load cell is rotated through 0°, 120° and 240° and at each position, two sets of readings at 10% interval taken in order to reduce the error that may occur due to eccentric loading. The average of the six sets of readings are then worked out at every load step. Repeat the above for each range of the machine
4.2.3 4.2.4 4.3. 4.3.1
Analysis of Results This is done in order to classify the load cell:i) Error = Applied force – Indicated force
( Applied
ii)
%Error =
iii)
Play (Repeatability)
iv
Variation coefficient
force − Indicated force ) x100% Applied force Highest deviation in loadcell x100% = Mean =
S tan dard deviation in reverse loading x100 Mean 5.0.
CACULTATION OF UNCERTAINTY OF MEASUREMENT
5.1
The uncertainty of measurement is an estimate of that part of the expression of the result characterizing type range of values within which the true value of the quality to be measured lies.
5.1.2 Random Uncertainty Ur 5.1.2.1 If observations are repeated a number of times in precision measurements under the same conditions, the results will not be identical. This is due to the presence of small independent random variables. 5.1.2.2 Determination of Random Uncertainty i) Arithmetic sample mean of the individual measured values is given by. −
xi = vi =
1 n
n
∑v
ij
− − − − − − − − − − − − − − − − − − − −1
j =i
−
Where n is the number of results taken vij ( j = 1, n ) . The limiting values of the sample mean when n tends to infinity becomes the population mean µ where ui =
⎛ lim ⎜ 1 n ⇒ α ⎜⎜ n ⎝
⎞ ⎟ xi ⎟ ⎟ j =1 ⎠ n
∑
− − − − − − − − − − − − − − − − − − − −2
4
ii)
An estimate of the standard deviation of the distribution of values Svi
⎛ 1 n 2⎞ Svi = ⎜⎜ ∑(vij −vi ) ⎟⎟ ⎠ ⎝n−1 j=1 iii)
−−−−−−−−−−−−−−−−−−−−3
Population standard deviation is the limiting values of the sample standard deviation when n tends to infinity is given by
Sv =
lim n⇒α
⎛1 2⎞ ⎜ ∑(vij −vi ) ⎟ ⎝n ⎠
−−−−−−−−−−−−−−−−−−−−4
5.1.3 Systematic Uncertainty Us 5.1.3.1 Systematic uncertainty normally follows rectangular probability, so the true
⎛− ⎝
⎞ ⎠
⎛− ⎝
⎞ ⎠ distribution. If only upper and lower limits aui and ali can be estimated for the
values lies between ⎜ x − a ⎟ and ⎜ x − a ⎟ , a being the semi-range in the
value of influence quantity e.g limit of error of a measuring instrument, etc.
1 xi = (aui +ali ) 2
−−−−−−−−−−−−−−−−−−−−−−−−−−−−−−−5
For the expected values, and for estimated variance
Sxi = 2
1 (aui +ali)2 12
−−−−−−−−−−−−−−−−−−−−−−−−−−−−−−6
If the difference between the limiting values is denoted by 2ai then equation (6) becomes
1 2 2 S xi = ai 3 5.1.3.2 Uncertainty that follow rectangular probability are due to the following contributions a) Zero error. Estimated relative variance
1 2 u zer = a 2 3 b)
Reproducibility without rotation.
urep = 2
c)
1 2 a 3
− − − −− − − −− − − −− − −8
Resolution. Estimated relative variance
ures = 2
d)
− − − − − − − − − − − −7
1 2 a 3
− − − − − − − − − − − −9
Reversibility (hysteresis).
1 2 urev = a 2 3
− − − − − − − − − − − − − − − − − − − 10
5.1.3.3 Contributions to systematic uncertainty that do not follow rectangular probability distribution are also given below. e) Reproducibility with rotation. This follows U-shaped distribution as is given by estimated relative variance Estimated relative variance
1 2 u rot = a 2 2
− − − − − − − − − − − − − − − − − − − − − −11
5
f)
Interpolation error. This follows triangular distribution as is given by estimated relative variance.
u int = 2
1 2 a 6
− − − − − − − − − − − − − − − − − − − − − − − 12
In all cases, a = half width of the input quality 5.1.3.4 After the relative variance for each force step has been determined, the relative combined uncertainty µtra for k=2 will be calculated from equation 13 and 14 for any force step.
(
)
uc(tra) = uzer + urep + urot + uint + ures + urev − − − − − − − − − − − − − − − − −13 2
2
2
2
2
2
utra = k.uc(tra) − − − − − − − − − − − − − − − − − − − − − − − − − − − − − − − − − − − −14 5.1.3.5 The relative uncertainty U s is determined by considering the best measurement capability of force calibration (standard) machine as follows. U
s
=
[(u
tra
)2
+
(u
bmc
5.1.3.6 Overall uncertainty U = S y =
∴±U = k 6.0
]−
)2
(U
2 r
− − − − − − − − − − 17
+ Us
2
)
( Ur2 +Us2 ) − − − − − − − − − − − − − − − − − − − − − − − − − − − − − −19
CONCLUSION The calibration of material testing machines (Tensile/Compression/Universal) using calibrated force-proving instruments (Load cells, proving Rings and Digital compensators (Read outs)) is very important for Industry and Research Institutions in any country in the world. N.B Worked out Examples of Uncertainty is available on request. REFERENCE
1.
M. Peters The realization of forces up to 1Mn on an international level. Proceedings of the 10th conference of IMEKO TC-3 on measurement of force and mass, Kobe, Japan, September,1984.
2.
A. Sawla Problems of the high accuracy transfer of large forces of up to 8Mn; Proc.Weghtech 83, London.
3.
M. Peters, A. Sawla, D. Peschel Uncertainty in force measure – Report of the CCM working Group force PTB-MA-17, 1990
4.
A. Sawla and M. Peters An inter-comparison of force Standard machines at the South African Bureau of Standards PTBME-68, 1985
5.
Walter N. Okoko Force measurement in Kenya Addresses of the Authors: David K. Kimetto, Force Laboratory Kenya Bureau Of Standards (KENYA)
[email protected] or
[email protected]
6