Calcif Tissue Int (1998) 62:491–496
© 1998 Springer-Verlag New York Inc.
Bone Mineral Content and Density in Professional Tennis Players J. A. L. Calbet,1 J. S. Moysi,1 C. Dorado,1 L. P. Rodrı´guez2 1 2
Departamento de Educacio´n Fı´sica, Universidad de Las Palmas de Gran Canaria, 35017 Las Palmas de Gran Canaria, Canary Islands, Spain Departamento de Medicina Fı´sica y de Rehabilitacio´n, Universidad Complutense, Madrid, Spain
Received: 29 April 1997 / Accepted: 14 November 1997
Abstract. Total and regional bone mineral content (BMC) as well as lean and fat mass were measured in nine male professional tennis players (TPs) and 17 nonactive subjects; dual-energy X-ray absorptiometry (DXA) was used for measuring. The mean (±SD) age, body mass, and height were 26 ± 6 and 24 ± 3 years, 77 ± 10 and 74 ± 9 kg, and 180 ± 6 and 178 ± 6 cm for the TP and the control group (CG), respectively. The whole body composition for BMC, lean mass, and fat of the TP was similar to that observed in the CG. The tissue composition of the arms and legs was determined from the regional analysis of the whole-body DXA scan. The arm region included the hand, forearm, and arm, and was separated from the trunk by an inclined line crossing the scapulo-humeral joint. In the TP, the arm tissue mass (BMC + fat + lean mass) was about 20% greater in the dominant compared with the contralateral arm because of a greater lean (3772 ± 500 versus 3148 ± 380 g, P < 0.001) and BMC (229.0 ± 43.5 versus 188.2 ± 31.9 g, P < 0.001). In contrast, no significant differences were observed either in BMC or BMD between arms in the CG. Total mass, lean mass, and BMC were greater in the dominant arm of the TP than in the CG (all P < 0.05). In the TP, BMD was similar in both legs whereas in the CG, BMD was greater in the right leg. Lumbar spine (L2–L4) BMD, adjusted for body mass and height, was 15% greater in the TP than in the CG (P < 0.05). Femoral neck BMDs (femoral neck, Ward’s triangle, greater trochanter, and intertrochanteric regions) adjusted for body mass and height were 10–15% greater in the TP (all P < 0.05). Ward’s triangle BMD was correlated with the maximal leg extension isometric strength (r 4 0.77, P < 0.05) even when adjusted for body mass (r 4 0.76, P < 0.05) and height (r 4 0.77, P < 0.05). In summary, the participation in tennis is associated with increased BMD in the lumbar spine and femoral neck. These results may have implications for devising exercise strategies in young and middle-aged persons to prevent involutional osteoporosis later in life. Key words: DXA — Bone mass — Body composition — Osteoporosis — Tennis.
lead to osteoporosis with an increased risk of fractures [3– 5]. Conversely, most cross-sectional [6–14] and longitudinal studies [15, 17] have demonstrated that physical exercise is associated with an increased bone mineral content (BMC) and bone mineral density (BMD), although some have failed to establish such a relationship [9, 12, 16]. Still others have even shown a decrease in some locations [13, 18–21]. These discrepancies may be due to differences in the research methodology, exercise characteristics, or subject’s age, gender, nutrition, exercise compliance, and sports history. Some of the controversy would be explicable after considering the regions examined since the effects of both physical activity and immobilization seem to be confined to the areas submitted to either immobilization or mechanical load [2, 7–9, 11, 13, 21, 22]. Even though some efforts have been made to determine to what extent bone mass and bone density might be increased by specific mechanical loading, questions regarding the type, duration, and intensity of exercise as a loading modality to enhance osteogenesis still remain unanswered. The asymmetrical nature of tennis offers an interesting model to study the adaptability of both the skeletal and the soft tissue of the upper limbs to physical stress, using as a control the nondominant arm. From earlier studies it has been shown that BMC and BMD increase in the dominant arm of tennis players (TP) of different ages and levels [7–9, 11, 14, 23–25]. Most of these earlier studies did not examine the effects of tennis participation in other regions apart from the arms. Therefore, the two main purposes of this study were to determine if long-term high-level tennis playing is associated with changes in the skeletal and soft tissues of the limbs with special reference to the dominant and nondominant arm, as well as to assess the effects of the participation in tennis on the BMD in the lumbar spine and femoral neck. Another aim was to determine the relationship between lean tissue mass and bone mass in both control sedentary subjects and tennis players. Materials and Methods Subjects
Bone tissue, much like muscle, shows a high plasticity and through a continuous modeling and remodeling adapts to meet the strain demands that may be imposed by either external or internal forces [1–3]. It has been documented that immobilization and weightlessness are associated with a decrease in bone mass, osteopenia, and in extreme cases, Correspondence to: J. A. L. Calbet
Nine male TPs from the Canary Islands and 14 nonactive subjects from the same Caucasian population participated in this study which was approved by the ethical committee of the University of Las Palmas de Gran Canaria. The exact nature and purpose of the project was explained to all volunteers who then gave their informed consent. All the TPs have been participating in professional or top level amateur tennis competitions during, at least the last seventeen years (17 ± 6). The mean time they have been spending on tennis training or competitions has been 25 ± 8 hours per week. Subjects were ascribed to the sedentary or control group
492
J. A. L. Calbet et al.: Bone Mass in Tennis Players
Table 1. Reliability of DXA regional analysis of tissue composition, as represented by the CV for repeated measures with repositioning in nine subjects
Table 2. Anthropometric and whole body composition variables Variable
Variable
Right arm
Left arm
Right leg
Left leg
Total body
BMC Fat-free lean mass Fat mass Bone area BMD
2.9 2.5 5.4 3.2 1.1
3.5 3.3 7.5 4.8 4.0
1.1 1.8 4.7 2.7 2.3
1.7 1.1 5.8 2.4 2.6
0.4 1.0 3.1 0.8 0.7
only if they had not been participating in either a sport during at least the last 5 years or any physically demanding work activity.
Body Composition and Bone Mass Assessment Anthropometric measurements were taken first. Height was measured in the upright position to the nearest 1 mm (Atla´ntida, An˜o´ Sayol, Barcelona, Spain). Body mass was assessed using a balance of a 50 g imprecision (Atla´ntida, An˜o´ Sayol, Barcelona, Spain), calibrated with M1 class calibration masses (tolerance < 0.005% in mass). Thereafter, total and regional body composition was measured by dual-energy X-ray absorptiometry (DXA) (QDR-1500, Hologic Corp., software version 7.10, Waltham, MA) as described elsewhere [26]. The principle of DXA, as well as its validity and reliability, have been described previously [27–30]. Body composition was analyzed assuming that the hydration of the lean body mass is 73.2% and brain fat 17.0%. From the whole body scans, the lean body mass (g), body fat (g), total area (cm2), and BMC (g) were obtained. Bone mineral density (BMD; g/cm2) was calculated from these measures using the formula BMD 4 BMC/total area. Additionally, total body scan subregions are reported. The arm region included the hand, forearm, and arm, and was separated from the trunk by an inclined line crossing the scapulo-humeral joint, such that the humeral head was located in the arm region. The leg region included the foot and the lower and upper leg, and was separated from the trunk by an inclined line passing just below the pelvis, which bisected the femoral neck. Special examinations were carried out to measure bone mass in the lumbar spine and proximal femur of the left leg. The values for femoral neck, Ward’s triangle, greater trochanter, and intertrochanteric regions are reported as well as L2–L4 from the anteroposterior lumbar scan, by computing a mean BMD value for the three lumbar vertebras analyzed. Fat-free lean mass was assumed to be equivalent to muscle mass, but only in the limbs.
Reliability of DXA Tissue Composition and Bone Area Assessment The laboratory precision error for the regional analysis of the whole body scan, as defined by the coefficient of variation (CV) for repeated measurements in young volunteers (n 4 9), is depicted in Table 1. Part of these data have been published previously [29].
Other Measurements To assess the leg extension explosive strength, the jumping capacity was measured in seven of the TPs. Testing sessions began with a standardized self-conducted warm up for 20–30 minutes depending on their individual preferences. Next, each subject did vertical jumps on a special platform. During the performance of the jumps, the subjects were asked to keep their hands on their hips and to try to minimize horizontal and lateral displacements. They were aware
Tennis players
Control group
Age (years) 26.2 ± 5.6 24.2 ± 2.8 Height (cm) 180 ± 6 178 ± 7 Total body mass (kg) 77.3 ± 10.3 74.9 ± 9.4 Total BMC (g) 3078 ± 476 2876 ± 383 Total lean mass (g) 60,188 ± 5727 57,015 ± 5639 Total body fat (g) 12,981 ± 6553 14,494 ± 5242 % fat 16.5 ± 6.9 19.1 ± 5.1
P NS NS NS NS NS NS NS
that the jumps had to be executed explosively to achieve maximum height. Two kinds of jumps were performed: (1) a squatting jump (SJ) beginning with knees bent at 90° and without countermovement, (2) counter-movement jumps (CMJs) beginning from standing position with allowance for counter-movement, with intention to reach knee bending angles of around 90° just before impulsion. Jumping height was calculated from the flight time which in turn was measured with a platform (Ergojump, Junghans GMBH-Schramberg, BRD) provided with a digital timer (±0.001 seconds). The timer was triggered by the feet of the subject at the moment of release from the platform and was stopped on touchdown. The displacement of the center of gravity was obtained assuming that the positions of the jumper on the platform were the same during takeoff and landing [31]. The best of three attempts was taken as the representative performance for each jump. These measurements were only performed in the TPs. In these seven TPs, maximal isometric strength during leg extension was also measured three times with a force plate (Kistler, Winterthur, Switzerland) in the upright position with the knees bent at a 90° angle, i.e., in the same position as for the squat jump. Subjects pulled maximally against a weightlifting bar placed over the shoulders and attached with two lateral chains to the floor where the force plate was also fixed. The best force records of three trials lasting 6 seconds are reported. These measurements were only performed in the TPs. Statistical Analysis Descriptive statistics were run on all the variables to check for the assumptions of normality and homocedasticity. Group differences were evaluated using Student’s unpaired t-tests and differences between sides were assessed using Student’s paired t-test. Analysis of covariance (ANCOVA) was used to determine whether there were significant differences between groups in BMD after adjusting for body mass and height or local muscle mass. Finally, stepwise multiple regression was used to determine the best predictor of BMD at the Ward’s triangle. The significance level was set at P < 0.05 level and all data are presented as means ± standard deviations. Results Whole Body and Limbs
Table 2 summarizes the anthropometric and whole body composition data per group. The dominant arm was always the right and the nondominant was always the left, in both groups. No significant differences were observed between the TPs and sedentary subjects in age, height, body mass, BMC, total lean body mass, total body fat, and the percentage of body fat. It can be seen in Figure 1 that marked differences existed between the dominant and the contralateral arm in the TPs for BMC (229.0 ± 43.5 versus 188.2 ±
J. A. L. Calbet et al.: Bone Mass in Tennis Players
493
Fig. 2. BMD of limbs in professional tennis players and sedentary subjects (control group). Values are means ± SEM (horizontal bars). *P < 0.05.
Fig. 1. Limb’s composition in professional tennis players and sedentary subjects (control group). Values are means ± SEM (vertical bars). *P < 0.05.
31.9 g, P < 0.001), muscle mass (3772 ± 500 versus 3148 ± 380, P < 0.001), and whole mass (4977 ± 908 versus 4220 ± 632, P < 0.001). Strikingly, the fat mass showed a trend to be greater in the dominant arm (976 ± 567 versus 884 ± 467, P 4 0.09) but the percentage of fat was lower (18.7 ± 8.6 versus 20.3 ± 8.8%, P < 0.05). On the other hand, the control group also showed a slightly greater muscle mass in the dominant arm (3246 ± 421 versus 3093 ± 388 g, P < 0.01) but a lower fat mass (749 ± 274 versus 793 ± 278, P < 0.05), with the percentage of fat also lower in the dominant arm (17.7 ± 5.3 versus 19.2 ± 5.7, P < 0.01). In addition, the sedentary subjects showed similar BMC in both arms (194 ± 33 versus 193 ± 32 g). When comparing the arms between groups, total and lean mass, as well as BMC, were greater in the dominant arm of the TPs (P < 0.05). The area occupied by the osseous pixels was also greater in the dominant arm of the TPs than in the contralateral arm (261 ± 42 versus 229 ± 31 cm2, P < 0.05) whereas no significant differences were observed between bone areas of the arms in the control group. However, bone hypertrophy did not account for the overall increase in BMC, as BMD was also greater in the dominant arm than in the contralateral arm in both the TPs (0.874 ± 0.054 versus 0.821 ± 0.083 g/cm2, P < 0.05) and the control group (0.821 ± 0.087 versus 0.808 ± 0.088 g/cm2, P < 0.05). In addition, when comparing BMD across groups, the TPs showed a trend to a greater BMD in the dominant arm than the control group (0.874 ± 0.5 and 0.821 ± 0.087 g/cm2, respectively, P 4 0.1). Nevertheless, no significant differences in BMD were observed between groups for the left arm, left leg, and right leg. The BMC of the dominant arm was correlated with their respective muscle mass and total mass in the TPs (r 4 0.76, P < 0.05; and r 4 0.83, P < 0.01, respectively) as well as
in the sedentary subjects (r 4 0.86 and r 4 0.86, respectively, both P < 0.001). Minor asymmetries were also observed at the leg level in the TPs as well as in the control group (Figs. 1 and 2). In the TPs, the right leg was slightly heavier than the left leg (13,236 ± 1779 versus 13,033 ± 1826 g, P < 0.01) due to the greater fat content of the right leg (2518 ± 1177 versus 2331 ± 1070 g, P < 0.05). Nevertheless, only the fat mass was slightly increased in the right leg of the control group (2998 ± 1120 versus 2856 ± 1045, P < 0.05) whereas the total mass and muscle mass, as well as the BMC, were similar in both sides. In contrast, it was the left leg that showed the highest BMD in the control group (1.426 ± 0.087 versus 1.398 ± 0.74 g/cm2, P < 0.05) but no differences in BMD were observed between both legs in the TPs (1.426 ± 0.102 versus 1.439 ± 0.101 g/cm2; Fig. 2). Lumbar Spine
The TPs had no significantly greater lumbar spine BMD than the control subjects (1.25 ± 0.29 versus 1.09 ± 0.12 g/cm2, P 4 0.09; Fig. 3). However, when ANCOVA analysis was performed correcting for differences in body mass and height we saw that TPs have a significantly greater BMD at the lumbar spine. No relationship was observed between the mean lumbar BMD and maximal isometric force or jumping power. Femoral Neck
BMD measurements, obtained at the different sites of the proximal femur, were about 11% greater in the TPs (Fig. 3). However, the greatest difference was found in the trochanteric region (0.94 ± 0.11 versus 0.80 ± 0.07 g/cm2, P < 0.001) which represented 15% greater BMD in the left leg of the TPs compared with the left leg of the control subjects. A high correlation was observed in the tennis group between the whole BMC of the left leg and the BMD of the greater trochanter, Ward’s triangle, femoral neck, and intertrochanteric region (r 4 0.94, r 4 0.85, r 4 0.84, r 4 0.84, respectively, all P < 0.01). In contrast, the relationship between the whole BMC of the left leg and the femoral
494
Fig. 3. Lumbar spine (L2–L4) and femoral neck BMD in professional tennis players and sedentary subjects (control group). Values are means ± SEM (horizontal bars). *P < 0.05.
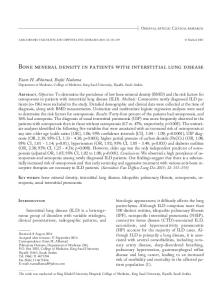
BMD was weaker in the sedentary subjects, with significant values only for the femoral neck (r 4 0.62, P < 0.05) and the intertrochanteric region (r 4 0.61, P < 0.05). In the TPs, the closest relationship between the left leg muscle mass and femoral BMD was obtained with the Ward’s triangle region (r 4 0.79, P < 0.05; Fig. 4). In addition, only the Ward’s triangle BMD was correlated with the maximal isometric force (r 4 0.77, P < 0.05; Fig. 4). Further, this correlation was also significant after adjusting it for body mass (r 4 0.76, P < 0.05) and height (r 4 0.77, P < 0.05). The total BMC in both legs showed a nonsignificant correlation with the maximal isometric strength (r 4 0.68, P 4 0.09) when adjusted for body mass. No relationship was observed between the jumping performance and BMD measured at the different femoral sites, nor was there any correlation between jumping performance and BMC nor BMD of the legs. However, when both the maximal isometric leg extension strength and muscle mass of the left leg were included as independent variables in a multiple regression model to predict the whole BMC of the left leg, only the muscle mass was accepted in the equation even when adjusting for differences in body mass and height. Lastly, maximal isometric force was a better predictor of Ward’s triangle BMD than muscle mass, as shown by multiple regression analysis. Thus, maximal isometric force explained 49% of the variability in BMD at the Ward’s triangle in the TPs. Discussion
This study shows that the marked arm asymmetry usually seen in professional TPs is due to the existence of about 20% more BMC and muscle mass in the dominant than in the contralateral arm. In addition, it has been demonstrated that professional TPs have about 11% greater BMD at the femoral neck and nearly 15% more BMD at the lumbar spine than the sedentary subjects of the same population. These results add further evidence to the regional specificity of the human bone tissue response to mechanical overloading [1, 2, 22]. The greater BMC observed in the dominant arm of the TPs can only be explained as an adap-
J. A. L. Calbet et al.: Bone Mass in Tennis Players
tive response to the mechanical load imposed by the participation in this sport since the environmental, nutritional, genetic, and neuro-humoral variables which influence bone remodeling [4, 5] can be considered similar for both arms of the same subject. This finding concords with earlier studies in TPs that were carried out at the radius bone, most of them with single photon absorptiometry [7–9, 17, 24]. With respect to the factors that might evoke an increase in BMC, it would seem that the type, intensity, and duration of muscle contractions, as well as the amount of muscle hypertrophy elicited, play an important role. For example, it has been well documented that bone tissue responds to the mechanical forces acting upon it [32, 33]. Nevertheless, it appears that to increase BMC, high impact or weightbearing activity is necessary since several studies have shown that swimmers and elite cyclists who perform a number of intense muscle contractions, which do not involve impact or weight-bearing tasks, might even have decreased values of BMC and BMD compared with those observed in sedentary subjects [12, 13]. Conversely, volleyball players and weightlifters show the highest levels of BMC [10, 12, 13, 34–36]. The area occupied by the osseous pixels was greater in the dominant arm of the TPs than in the contralateral arm whereas it was the same in the arms of the sedentary subjects. These findings seem to be valid despite the imprecision of the procedures used to determine the area occupied by osseous pixels and BMD in the arms, even when allowing for the small number of TPs included in the study. Actually, to show an interarm difference of at least 6% in BMC and BMD, a minimal sample of eight TPs would be required, if the a and b errors were set at 0.05 for a CV of 5% and 4%, respectively, in determining the area occupied by the osseous pixels and BMD. Accordingly, several studies have demonstrated that TPs have a wider cortical bone at the distal radius [7, 37] and greater BMD in some bones of the dominant arm [7, 8, 23, 24]. That bone hypertrophy plays a major role in the increased BMC of the dominant arm in TPs is further supported by the fact that differences in BMC between TP and control subjects were no longer significant after adjustment for the bone areas of the dominant arm. However, bone hypertrophy did not account for the overall increase in BMC, as BMD was also greater in the dominant arm in both the TP and control group. Therefore, it follows that the mechanical stress elicited by the participation in tennis produces an increase in both the BMC and the BMD of the arm which is similar to that observed in bones submitted to a high impact force, such as the lumbar spine and femoral neck of jumpers and weightlifters [12]. These changes in bone size and density can be envisaged as an adaptive response, which probably began soon in life [11]. Accordingly, Kannus et al. [11] have recently shown that the potential for a gain in BMC is greater in those subjects who start the sport in the prepubertal years, as our subjects did. Conversely, persons starting the sport later in life would be unlikely to have the size benefit. Physical requirements when playing tennis are mostly anaerobic in nature entailing rapid accelerations and decelerations, with twisting components acting on the spine and femoral neck which, in some circumstances, can produce ground reaction forces 5–10 times a person’s body weight [38]. Thus, it is likely that the forces generated during participation in tennis could elicit cellular reactions which subsequently activate osteogenesis not only in the bones of the dominant arm but also in the spine and leg bones. In fact,
J. A. L. Calbet et al.: Bone Mass in Tennis Players
495
Fig. 4. (A) Relationship between Ward’s triangle BMD and the muscle mass of the left leg in professional tennis players (n 4 9). (B) Relationship between Ward’s triangle BMD and the maximal leg extension isometric strength in professional tennis players (n 4 7).
this study demonstrates that TPs have a notably greater BMD in the femoral neck and lumbar spine compared with the sedentary subjects of the same population. Moreover, BMD showed a tendency to be greater in the left leg than in the right suggesting that the left leg supports more mechanical stress, perhaps due to its role in counterbalancing the rotational torques generated when hitting the ball with the right arm. Despite the fact that the increase in BMD at the lumbar spine and femoral neck sites may seem small (10– 15%), it must be emphasized that this gain in BMD is similar in magnitude to that observed in subjects engaged in other weight-bearing sports [10, 12, 13] but lower than the 40–50% increase reported in the forearm bones of weightlifters [34]. Therefore, tennis seems as efficient as other weight-bearing sports in increasing BMD at clinically relevant sites such as the femoral neck and the lumbar spine. That is, tennis playing may be envisaged as a preventive activity, however, inasmuch as the torques that can be generated may be strong enough to cause vertebral deformities in persons with low BMD at the spine, tennis is not recommended for people at risk of either vertebral or femoral fractures. In both the TPs and the sedentary subjects, the muscle mass was increased in the dominant arm. However, the interarm difference was much greater in the TPs (∼20%) than in the control group (∼5%). Thus, another factor that might be associated with the high BMC in the dominant arm of the TPs is the increased muscle and total mass of the arm, since several studies have reported that whole body BMC is correlated with whole body lean tissue mass, whereas regional lean mass correlates with both regional BMC and regional BMD [35, 39]. In this regard, when an ANCOVA was performed with the muscle mass of the dominant arm as covariate, the differences in BMC between TP and control subjects disappeared. The relevance of regional muscle mass as a predictive variable for regional BMC is further supported by the fact that the left leg muscle mass was better as a predictive variable for the left leg BMC than the maximal isometric leg extension strength, as shown by multiple regression analysis even after correcting for differences in body mass and height. Nonetheless, BMD at Ward’s triangle was positively correlated with the maximal isometric leg extension strength but not with the dynamic strength, measured as the maximal jumping height. Similar correlations between local BMD and local muscle strength have been previously reported [25, 35, 40, 41]. Additionally, our results indicate that maximal isometric leg extension force is a better predictor of Ward’s triangle BMD than leg muscle mass and
explains 49% of the variability in BMD at the Ward’s triangle among TPs. In summary, this study shows that professional TPs have a greater BMD in the lumbar spine and femoral neck than their sedentary counterparts. The arm tissue mass is about 20% greater in the dominant than in the contralateral arm due to a proportional increase of muscle and bone mass. Long-term participation in tennis, beginning at prepubertal years, is associated with increased BMD and bone hypertrophy in the dominant arm as compared with the contralateral arm. Finally, our data suggest that, in the legs, muscle mass is a better predictor of BMC than maximal isometric strength, but maximal isometric strength might be the most appropriate variable for predicting femoral BMD.
Acknowledgments. The authors wish to thank Jose Navarro del Tuero and Jorge Cortadellas Izquierdo for their excellent technical assistance and Margaret Hart for the revision of the English manuscript. This study was funded by the University of Las Palmas de Gran Canaria.
References 1. Lanyon LE (1984) Functional strain as a determinant for bone remodeling. Calcif Tissue Int 36:S56–S61 2. Lanyon LE (1992) The success and failure of the adaptive response to functional load bearing in averting bone fracture. Bone 13:S17–S21 3. Wilmet E, Ismail AA, Heilporn A, Welreads D, Bergmann P (1995) Longitudinal study of the bone mineral content and of soft tissue composition after spinal cord section. Paraplegia 33:674–677 4. Riggs BL, Melton LJ III (1986) Involutional osteoporosis. N Engl J Med 314:1676–1686 5. Raisz LG (1988) Local and systemic factors in the pathogenesis of osteoporosis. N Engl J Med 318:818–828 6. Nilsson BE, Westlin NE (1971) Bone density in athletes. Clin Orthop 77:177–182 7. Montoye HJ, Smith EL, Fardon DF, Howley ET (1980) Bone mineral in senior tennis players. Scand J Sport Sci 2:26–32 8. Huddlestone AL, Rockwell D, Kulund DN, Harrison RB (1980) Bone mass in lifetime tennis players. J Am Med Assoc 244:1107–1109 9. Jacobson PC, Beaver W, Grubb SA, Taft TN, Talmage RV (1984) Bone density in women: college athletes and older athletic women. J Orthop Res 2:328–332 10. Block JE, Friedlander AL, Brooks GA, Steiger P (1989) Determinants of bone density among athletes engaged in weight-
496
11.
12. 13.
14. 15.
16. 17.
18. 19. 20. 21. 22. 23. 24. 25. 26.
J. A. L. Calbet et al.: Bone Mass in Tennis Players
bearing and non-weight-bearing activity. J Appl Physiol 67: 1100–1105 Kannus P, Haapasalo H, Sankelo M, Sieva¨nen H, Pasanen M, Heinonen A, Oja P, Vuori I (1995) Effect of starting age of physical activity on bone mass in the dominant arm of tennis and squash players. Ann Intern Med 123:27–31 Suominen H (1993) Bone mineral density and long-term exercise. An overview of cross-sectional athlete studies. Sports Med 16:316–330 Sabo D, Reiter A, Pfeil J, Gussbacher A, Niethard FU (1996) Modification of bone quality by extreme physical stress. Bone density measurements in high-performance athletes using dual-energy x-ray absorptiometry. Z Orthop Ihre Grenzgeb 134:1–6 Kannus P, Haapasalo H, Sieva¨nen H, Oja P, Vuori I (1994) The site-specific effects of long-term unilateral activity on bone mineral density and content. Bone 15:279–284 Dalsky GP, Stocke KS, Eshani AA, Slatopolsky E, Lee WC, Birge SJ (1988) Weight-bearing exercise training and lumbar bone mineral content in postmenopausal women. Ann Intern Med 108:824–828 Gleeson PB, Protas EJ, Leblanc AD Schneiderm VS, Evans HJ (1990) Effects of weight lifting on bone mineral density in premenopausal women. J Bone Miner Res 5:153–158 Peterson SE, Peterson MD, Raymond G, Gilligan C, Checovich M (1991) Muscular strength and bone density with weight training in middle aged women. Med Sci Sports Exerc 23: 499–504 Bilanin JE, Blanchard MS, Russek-Cohen E (1989) Lower vertebral bone density in male long distance runners. Med Sci Sports Exerc 21:66–70 Michel BA, Bloch DA, Fries JF (1989) Weight-bearing exercise, overexercise and lumbar bone density over age 50 years. Arch Intern Med 149:2325–2329 Rico H, Revilla M, Hernandez ER, Go´mez-Castresana F, Villa LF (1993) Bone mineral content and body composition in postpubertal cyclist boys. Bone 14:93–95 Cuesta A, Revilla M, Villa LF, Herna´ndez ER, Rico H (1996) Total and regional bone mineral content in Spanish professional ballet dancers. Calcif Tissue Int 58:150–154 Tommerup LJ, Raab DM, Crenshaw TD, Smith EL (1993) Does weight-bearing exercise affect non-weight-bearing bone? J Bone Miner Res 8:1053–1058 Jones HH, Priest JD, Hayes WC, Tichenor CC, Nagel DA (1977) Humeral hypertrophy in response to exercise. J Bone Joint Surg 59A:204–208 Pirnay F, Bodeux M, Crielaard J, Franchimont P (1987) Bone mineral content and physical activity. Int J Sports Med 8:331– 335 Tsuji S, Tsunoda N, Yata H, Katsukawa F, Onishi S (1995) Relation between grip strength and radial bone mineral density in young athletes. Arch Phys Med Rehabil 76:234–238 Lo´pez Calbet JA, Armengol Ramos O, Chavarren Cabrero J, Dorado Garcı´a C (1997) Anthropometric equation for assessment of percent body fat in adult males of the Canary Islands. Med Clin (Barc) 108:207–213
27. Mazess RB, Chesnut CH, McClung M, Genant H (1992) Enhanced precision with dual-energy X-ray absorptiometry. Calcif Tissue Int 51:14–17 28. Svendsen OL, Haarbo J, Hassager C, Christiansen C (1993) Accuracy of measurements of body composition by dualenergy x-ray absorptiometry in vivo. Am J Clin Nutr 57:605– 608 29. Lo´pez Calbet JA, Dorado Garcı´a C, Chavarren Cabrero J (1996) Evaluacio´n de la composicio´n corporal mediante absorciometrı´a foto´nica dual de rayos X: aplicaciones y limitaciones en el a´mbito del deporte. Investigaciones en Ciencias del Deporte (Research in Sport Sciences) 8:53–79 30. Pietrobelli A, Formica C, Wang Z, Heymsfield SB (1996) Dual-energy X-ray absorptiometry body composition model: review of physical concepts. Am J Physiol 271:E941–E951 31. Bosco C, Luhtanen P, Komi PV (1983) A simple method for measurement of mechanical power in jumping. Eur J Appl Physiol 50:273–282 32. Rawlinson SCF, El Haj AJ, Minter SL, Tavarse IA, Bennett A, Lanyon LE (1991) Loading-related increases in prostaglandin production in cores of adult canine cancellous bone in vitro: a role for prostacyclin in adaptative bone remodeling? J Bone Miner Res 6:1345–1351 33. Fox SW, Chambers TJ, Chow JWM (1996) Nitric oxide is an early mediator of the increase in bone formation by mechanical stimulation. Am J Physiol 270:E955–E960 34. Virvidakis K, Georgiou E, Kortkotsidis A, Ntalles K, Proukakis C (1990) Bone mineral content of junior competitive weightlifters. Int J Sports Med 11:244–246 35. Nichols DL, Sanborn CF, Bonnick SL, Gench B, Dimarco N (1995) Relationship of regional body composition to bone mineral density in college females. Med Sci Sports Exerc 27:178–182 36. Dinc¸ H, Savci G, Demirci A, Sadikog˘lu MY, Tuncel E, Yavusz H (1996) Quantitative computed tomography for measuring bone mineral density in athletes. Calcif Tissue Int 58: 398–401 37. Martin AD, Bailey DA, Leicester JB, Gulka I (1987) Bone and muscle relationships in the forearm of lifetime tennis players. Proc Int Symp on Osteoporosis, Aalborg, Denmark 38. Alexander MJL (1985) Biomechanical aspects of lumbar spine injuries in athletes: a review. Can J Appl Spt Sci 10:1–20 39. Baumgartner RN, Stauber PM, Koehler KM, Romero L, Garry PJ (1996) Association of fat and muscle masses with bone mineral in elderly men and women. Am J Clin Nutr 63:365– 372 40. Bevier WC, Wiswell RA, Pyka G, Kozak KC (1989) Relationship of body composition, muscle strength and aerobic capacity to bone mineral density in older men and women. J Bone Miner Res 4:421–432 41. Pocock N, Eisman J, Gwinn T, Sambrook P, Kelley P, Freund J, Yeates M (1989) Muscle strength, physical fitness, and weight but not age predict femoral neck bone mass. J Bone Miner Res 4:441–448