Journal of
Archaeological SCIENCE Journal of Archaeological Science 30 (2003) 1701–1708 http://www.elsevier.com/locate/jas
Bone density studies in z...
Archaeological SCIENCE Journal of Archaeological Science 30 (2003) 1701–1708 http://www.elsevier.com/locate/jas
Bone density studies in zooarchaeology Y.M. Lam a,b, O.M. Pearson c,*, Curtis W. Marean d, Xingbin Chen e a
Department of Anthropology, University of Victoria, P.O. Box 3050, Victoria, BC, Canada V8W 3P5 Department of Archaeology, University of Cape Town, Private Bag, Rondebosch 7700, South Africa c Department of Anthropology, University of New Mexico, Albuquerque, NM 87131-1086, USA d Institute of Human Origins, Department of Anthropology, P.O. Box 872402, Arizona State University, Tempe, AZ 85287-2402, USA e Department of Computer Science, Suffolk County Community College, 533 College Road, Selden, NY 11784-2899, USA b
Received 3 December 2002; received in revised form 1 April 2003; accepted 17 April 2003
Abstract Accurate bone density data are essential for assessing the influence of destructive processes in archaeological faunal assemblages. Unfortunately, the diversity of methods employed by different researchers to derive density values has resulted in recent confusion. Two recent publications in this journal [J Archaeol Sci 29 (2002) 883; J Archaeol Sci 29 (2002) 979] exemplify this state of misunderstanding. Both studies argued that the role of bone density in shaping archaeological faunal assemblages has been largely overrated, but both based their conclusions on density values that were inaccurately derived. The former employed a method of calculating bone density that has been largely discredited over the past decade [J Archaeol Sci 29 (2002) 883]. Within a larger discussion of zooarchaeological methodology, the latter provided an assessment of the current state of bone density research that inappropriately characterized the discrepancies between available sets of density data as a reflection of the differences between two technologies—photon densitometry and computed tomography [J Archaeol Sci 29 (2002) 979]. The actual dichotomy exists—irrespective of the technology employed—between studies that account for variation in the shape of bone cross-sections and those that do not. The different sets of density data currently available to zooarchaeologists vary tremendously in their accuracy. We review and evaluate the different techniques employed in the research of bone density patterns of mammalian fauna. Computed tomography produces the most accurate density data. For elements without medullary cavities, photon densitometry may provide density values of similar accuracy but only if a method of cross-sectional shape-adjustment is applied. 2003 Elsevier Ltd. All rights reserved. Keywords: Bone density; Zooarchaeology; Taphonomy; Photon densitometry; Computed tomography; Shape adjustment
1. Introduction The analysis of the taphonomic history of an archaeological faunal assemblage requires the assessment of the influence of post-depositional bone attrition. Because such destruction affects the preservation and the subsequent quantification of faunal remains, it is of primary concern to zooarchaeologists attempting to interpret prehistoric human activities on the basis of skeletal element representation. Since Lyman’s [13] pioneering publication of density values for the skeletal elements of deer, the standard analytical technique for * Corresponding author. Tel.: +1-505-277-6692; fax: +1-505-277-0874. E-mail address: [email protected] (O.M. Pearson). 0305-4403/03/$ - see front matter 2003 Elsevier Ltd. All rights reserved. doi:10.1016/S0305-4403(03)00065-7
assessing the influence of post-depositional destruction has been to compare the abundance of skeletal elements (and portions thereof) with their bone density. Postdepositional destruction is assumed to be densitymediated, and a significant positive correlation between the abundance of a skeletal element and its density in an archaeological assemblage is evidence of the influence of taphonomic processes, suggesting that caution be applied in the inference of human behavior [7,14,15]. To date, complete sets of density values have been derived for only a small number of mammalian taxa: deer, Odocoileus spp., sheep, Ovis aries, pronghorn antelope, Antilocapra americana [13,16,21]; marmot, Marmota spp. [17]; bison, Bison bison [10]; seal, Phoca spp. [16]; camelids, Lama spp. [6,24]; leporids— Oryctolagus cuniculus, Sylvilagus floridanus, and Lepus
1702
Y.M. Lam et al. / Journal of Archaeological Science 30 (2003) 1701–1708
spp. [20]; wildebeest, Connachaetes taurinus, reindeer, Rangifer tarandus, equids, Equus spp. [12]; and baboon, Papio cynocephalus [21]. Density data have also been published for fish and bird species [4,5]. Zooarchaeologists interested in species other than the aforementioned have encountered the dilemma as to which set of density values to choose for their analyses. Some researchers continue to use Lyman’s original data for deer, likely due to an inability to evaluate the quality of the more recently derived data sets. For example, one recent article advocated the use of the density values derived by Lyman, citing their “longer track record” [25, p. 987]. There exist criteria other than antiquity by which to judge density data, and these will be discussed in a later section. 2. Bone density studies in zooarchaeology While the relationship between bone density and faunal preservation has long been recognized by paleontologists and archaeologists (see [16], for a review), early attempts to measure the bone density of sheep/goat by Brain [3] and Behrensmeyer [1] produced incompatible results due to the differences in their respective methodologies. Lyman attempted to address this problem by employing photon densitometry (hereafter “PD”) in his bone density research [13]. This technology enabled him to take readings of bone mineral content along the very narrowly defined areas (“scan sites”) of each skeletal element. In his study of deer bone density, Lyman [13] published density values for scan sites distributed throughout the mandible and the entire post-cranial skeleton, and these data became an essential component of many subsequent zooarchaeological analyses. It was almost a decade before bone density values became available for other species of mammal. In a 1989 study, Grayson [7] used Lyman’s data for deer to assess the survivorship of marmot bones at archaeological sites. Speculating that significant differences in bone density patterns may exist between taxa, Lyman et al. [17] subsequently derived a set of density data for marmot, and Kreutzer [10] presented new data for bison. Both of these later studies also employed PD, and both also documented density patterns distinct from that of deer. However, these two studies also adopted methods of calculating density—described in the following section—that were slightly different from that of Lyman’s [13] study. Lyman later published data for sheep, pronghorn antelope, and seal derived in the same manner as his original study [16]. Elkin [6] employed PD using Lyman’s [13] method in a study of camelid bones. She also derived an independent set of density values using water displacement. Pavao and Stahl [20] and Stahl [24] used PD to derive density values for leporids and camelids, respectively. Each of these last two studies
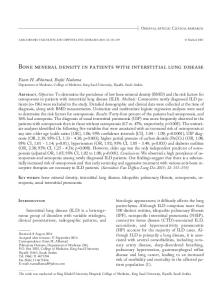
produced two sets of values—one generated by simulating Lyman’s methodology, the other by incorporating a number of modifications designed to increase the accuracy of the density measurements. In a recent study, Pickering and Carlson [21] employed Lyman’s original methodology to derive density data for baboon and goat without adopting any of the technical improvements developed by earlier researchers. Lam et al. [12] produced density values for a sample of bovid, cervid, and equid species using a different technology, computed tomography (CT). 3. Different methods of calculating bone mineral density Most zooarchaeological studies of bone density have employed a technology known as photon densitometry or absorptiometry. Photon densitometers do not provide a direct measure of bone density. They measure bone mineral content across a scanned section of bone. The volume of this scan site must be determined by the researcher before density may be calculated. Because scan length (i.e., the thickness of the scan “slice”; Fig. 1) is set by the densitometer, the researcher need only be concerned with determining the cross-sectional area of the bone at each scan site. Lyman [13] estimated the cross-sectional area of all of his scan sites as a product of the maximum bone width and maximum bone thickness (Fig. 1). Every scan site, regardless of its shape or the presence of any cavities, was in effect treated as a rectangle in the calculation of density (Fig. 1c). The primary shortcomings of this technique are not only that it underestimates the bone mineral density for any scan site that does not have a rectangular shape, but also that it underestimates density to a different degree for each scan site. This issue is discussed in detail by Kreutzer [10], Lam et al. [11] and Stahl [24]. Virtually every zooarchaeological study of bone density conducted since Lyman’s [13] pioneering research has improved upon his original methodology [6,10–12,17,20,24]. Lyman et al. [17] adopted an “average”, rather than a maximum, measurement of bone thickness—a modification that may be construed as a tacit admission of the shortcomings of his previous methodology. In her study of bison, Kreutzer [10] made a number of different measurements at each scan site to produce a geometric estimate of its cross-section. Pavao and Stahl [20], working with small leporid elements, produced similar estimates by categorizing scan sites as various geometric shapes. Stahl [24] employed a detailed technique of shape-adjustment, using a carpenter’s molding tool to accurately recreate cross-sectional shapes. Despite such efforts to estimate external shape, PD studies cannot distinguish internal heterogeneity in bone structure (Fig. 1a, b), a variable that is significant in any element that possesses a medullary cavity. To document
Y.M. Lam et al. / Journal of Archaeological Science 30 (2003) 1701–1708
1703
Fig. 1. A schematic diagram of how density is measured by a photon densitometer (after [10]). PD does not detect the cross-sectional area of a scan site; this must be measured independently by the researcher. Most researchers have attempted to measure the external shape of the scan site, but even so PD can not distinguish between a hollow cylinder of thick cortical bone, A, and a tube of spongy bone, B. Some researchers [13,21] have chosen to treat the cross-sectional area of scan sites as a rectangle (C) with sides of maximum bone width and maximum bone thickness.
accurate cross-sectional areas, Lam et al. [11,12] employed CT, which produces a clear radiographic image of the bone cross-section that may be digitized. This technique allows the medullary cavity to be excluded from the calculation of bone density. CT has been used for almost three decades to measure bone mineral density, and its advantages over PD in this task have been documented from the onset [22,23]. After years of improvements to both technologies, clinical researchers continue to prefer CT for the collection of density data [8,9]. The primary drawback of CT is that it involves much higher doses of radiation than PD [19], a consideration that is irrelevant to the type of study addressed here. While we have been advocates of the use of CT in bone density studies, we readily acknowledge that PD can produce similarly accurate density values when researchers compensate for its technological limitations [11]. For scan sites without internal cavities, crosssectional area can be accurately determined in the manner devised by Stahl [24]. For those with medullary cavities, obtaining an accurate assessment of the crosssectional area is more problematic, requiring that the element be either physically sectioned or X-rayed at the
point of interest. To date, no PD studies have excluded the volume of internal cavities from their calculation of bone density. Therefore, PD values for scan sites with internal cavities significantly underestimate density. The various methods of calculating cross-sectional area (and, by extension, bone density) are categorized and illustrated in Fig. 2. The terms “volume density” (VD) and “bone mineral density” (BMD) should be equivalent measures, but because of the variety of ways in which both are calculated, they are not. Group A consists of studies that do not employ any type of shape-estimation [13,21]. These studies treat each scan site as if its cross-section were a rectangle based on its maximum dimensions, resulting in underestimates of the density of all sites. The degree of underestimation is not systematic, varying according to the cross-sectional shape of each scan site, and is especially large in bones with large medullary cavities. The accuracy of density values produced by Group A studies is low. Group B includes studies that approximate the crosssectional area of a scan site as a (non-rectangular) geometric shape or as a geometric outline. These produce density data that are much more accurate than those in Group A but slightly less than those in Group
1704
Y.M. Lam et al. / Journal of Archaeological Science 30 (2003) 1701–1708
Fig. 2. Summary of methods of estimating cross-sectional area in density studies employing photon densitometry and computed tomography. The scan sites used in this example are FE6 (distal epiphysis of femur) and FE4 (middle shaft of femur). Accuracy increases from Group A to Group D. Several studies [6,12,20,24] derive density using more than one method; data from the less accurate method is used for comparison with earlier studies. Kreutzer’s [10] method of shape estimation was more elaborate than illustrated here, while that of Lyman et al. [17] was not clearly described (see text). Abbreviations (see original references for descriptions): VD (volume density), LD (linear density), BT (bone thickness), SA (shape-adjusted), BMD (bone mineral density).
C. Group C categorizes studies that involve an accurate reconstruction of external cross-sectional shape, using CT or other means. These produce correspondingly accurate density values for scan sites that do not contain an internal cavity. Group D consists of studies that exclude the marrow cavity from calculations of density. These employ CT or methods such as water displacement and produce accurate density values both for scan sites with internal cavities and those without. Fig. 2 notes that a number of studies employ more than one method of density calculation. This is evidence of the pervasive influence of Lyman’s pioneering work—several of these studies used Lyman’s [13] methodology to derive a second data set of less accuracy for comparative purposes. Pavao and Stahl [20] calculated two separate sets of data for leporids based on PD measurements. One set was not shape-adjusted (VDLD/ BT) and was used for comparison with the data derived for marmot by Lyman et al. [17]; the other was shape-
adjusted (VDSA) and thus more accurate. Similarly, in his study of camelid density patterns, Stahl [24] presented one set of data that was shape-adjusted (VDSA) and another that was not (VDLD/BT) for comparison with Lyman’s [13] values for deer. Elkin [6] derived density values for camelids using both Lyman’s method and water displacement. Lam et al. [12] presented two sets of data for their sample of bovid, cervid, and equid species. One excluded the medullary cavity to produce an accurate calculation of bone density (BMD2, in Group D), the other incorporated the cavity space to provide a data set comparable to those of photondensitometry studies that employed a shape-adjusted method of density calculation (BMD1, in Group C). Kreutzer [10] speculated that some of the discrepancies between her density data for bison and Lyman’s [13] data for deer reflected differences in their respective methodology rather than intertaxonomic differences between the skeletal morphology of deer and bison. Lam
Y.M. Lam et al. / Journal of Archaeological Science 30 (2003) 1701–1708
1705
Fig. 3. The effect of shape-adjustment on PD values. FE4—middle shaft of femur; FE6—distal epiphysis of femur. Column A lists Pickering and Carlson’s [21] values for sheep bone density. If they had conducted shape-adjustment of the cross-sectional area of the scan site (Columns B to C), their values would have been similar to those derived for goat bones using CT (Column D).
et al. [12] confirmed this speculation, attributing most—if not all—of the differences between the two data sets to the lack of any shape-adjustment in Lyman’s study. In a comparison of density data for different species, Lam et al. [12] found that the highest correlations occurred between data sets derived using the same methodology, regardless of any expected genetic or morphological similarity. For example, density values for reindeer, derived using CT, were much more highly correlated with CT data for equids than they were with PD data for deer from Lyman’s [13] study. It is of interest to note that Lyman’s [12] values for deer are more highly correlated to those of marmot (rs=0.55, P