BLOOD SOURCE AND ALCOHOL LEVEL; ERRORS FROM USING VENOUS BLOOD DURING ACTIVE ABSORPTION by R. N. HARGER* a n d l i n d e of Stockholm,1 in their 1930 paper on the distribution of alcohol between breath and blood, reported that they could find no difference in the alcohol level of venous and arterial blood, drawn simultaneously. However, they really did not use arterial blood, but blood from a vein on the back of the hand, after the hand had been immersed in water at about 46° for 10 minutes. Five years earlier Goldschmidt and Light,2 of Philadelphia, had reported that such warm ing of the hand causes the blood in its dorsal veins to become arterial as regards blood gases. In his well-known alcohol monograph of 1932 Widmark,3 of Sweden, stated that Liljestrand and Linde found the same level of alcohol in venous and arterial blood, after absorption was completed. Widmark’s recollection of this paper was evidently faulty, because I can find nothing in Liljestrand and Linde’s paper indicating that their statement about venous and arterial blood was confined to the postabsorptive period. However, Widmark, in his monograph, does imply that the venous blood alcohol level is below the arterial blood level during the period of absorption. He stated: “During the period of resorp tion acetone behaves like alcohol” , and he presented data from his 1919 study on the behaviour of acetone in the body showing that, two minutes after intravenous injec tion of this compound in rabbits, the acetone level in organs having a rich blood supply, viz. brain, liver and kidney, was close to that of arterial blood. On the other hand, he found that the muscle level at this time was only 6% of the blood level and did not reach the level in blood, brain, etc., until 30 to 60 minutes later. Widmark’s monograph further states: “Direct deter mination of the different speeds with which alcohol distributes itself in various organs has not yet been carried out” . Hulpieu, Lamb and myself did carry out such l il je s t r a n d
determinations in 1935-36, although we had not yet read this statement by Widmark. Our primary purpose was to obtain information on the rate of absorp tion of alcohol from the gastrointestinal tract, and also on the brain/blood alcohol ratio. In this study we used more than 50 dogs, which received alcohol by stomach tube, or intravenously, and were sacrificed in groups at periods ranging from 15 minutes to 12 hours after receiving the alcohol. As Widmark had predicted, we found that brain and liver reached alcohol equilibrium with the blood almost im mediately, while voluntary muscle required about an hour to store its quota of alcohol. These findings have an important bear ing on the matter of the alcohol level in limb vein blood during active absorption. As pointed out by Widmark, the flow of blood per kilo of tissue is many times less for voluntary muscles than for brain, liver and kidney. This slow passage of blood through voluntary muscle tissue causes a marked drop in the alcohol level of the blood so that, during active absorption, the alcohol level in the venous return from a limb lags far below the level in arterial blood. In 1934, Haggard and Greenberg5 of Yale published the results of an experi ment with one dog to which they gave 3 grams of alcohol per kilo by stomach tube. A t intervals during the next 5J hours, blood samples from the left heart, right heart, femoral vein, jugular vein and from a skin puncture were analysed for alcohol content. They reported that the alcohol levels in blood from the left heart and right heart were practically identical, that the jugular vein blood alcohol level was 87% of the heart blood level at 30 minutes, and 93% at 1 hour, and that the level in blood from the skin puncture was 90% of the heart blood level at 30 minutes and 94% at 1J hours. On the other hand, they *M .D., Professor Emeritus o f Biochemistry and Toxico logy, Indiana University School of Medicine.
212
HARGER
stated that the alcohol level in femoral vein blood was only 47% of that of the heart blood at 30 minutes, 73% at 1 hour, and 94% at 3|- hours. Subsequently, Hulpieu, Cole and myself6 repeated Haggard and Greenberg’s experi ment as regards alcohol levels in blood from the heart and from a leg vein. We employed 17 dogs and used blood from the femoral and saphenous veins. The blood from these two leg veins had essentially the same alcohol level. Forney et al? of our department later conducted a similar study, using 13 dogs which were sacrificed just 10 minutes after receiving 3 grams of alcohol per kilo. The level of alcohol in brain tissue was also included in the determinations by Forney et al. Table I T able
213
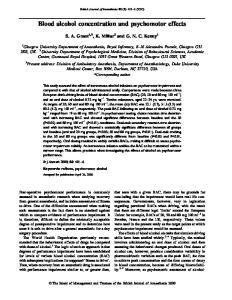
Fig. 1 shows the correlation between brain alcohol level and levels in heart blood and venous blood obtained by Forney et al.
I
R atio o f A lcohol L evels in H ea rt B lood and Saphenous Vein* B lood o f D ogs a t Various Intervals a fter O ral Adm inistration** {Dosage: Haggard and Greenberg, 3 g./kg.; Harger et al., 1—4 g-lkg.; Forney et al., 3 g./kg.) N um ber o f D ogs Used
H. & G.
____
1 1 1
H . et al. & F. et al. 13 17 17 17 —
____
17
1
____
____
17 —
1
Sapher io u s blood/H eart blooc >alcohol ratio Time After Adminis tration
10 15 30 1 1$ 2 2£ 3 3£
min. min. min. hr. hrs. hrs. hrs. hrs. hrs.
H . et al. & F . et al.
H. & G.
0 -4 7 0 -7 3 0 -8 9
Ave.
Range
0 -7 1 0 -8 3 0 -9 1 0 -9 9
0 -5 2 -1 02 0 -6 7 -0 -9 6 0 -7 9 -1 -0 2 0 -8 7 -1 -1 1
—
—
101
0 -9 5
—
____
0 -9 9 1—
0 -9 4
—
0 -9 7 -1 -1 0 —
0 -8 8 -1 -0 4
—
•H aggard and Greenberg used femoral vein blood. W ith some o f their dogs, H arger et al. used both saphenous and femoral vein blood and found them to have practically the same alcohol levels. **Data tabulated by H arger and Forney (22) from Haggard and Greenberg (5); H arger et al. (6) (15 m in.-3 hrs. experiments); and Forney et al. (7) (10 min. experiments).
compares the results of Haggard and Greenberg with those obtained by the workers in our department. We, too, found a lag in the alcohol level of venous return from a hind limb, as compared with heart blood level, but it was smaller and less prolonged than the lag reported by Haggard and Greenberg. The average lag which we found at 30 minutes was only 9%, and the greatest lag observed by us at 30 minutes was 21%, which was less than half of the lag reported by Haggard and Greenberg for this time interval. With our animals the venous lag had practically ceased at 1 hour.
F ig . 1. Alcohol concentration in brain, heart blood and saphenous vein blood o f 13 dogs sacrificed 10 minutes after oral adm inistration o f 3 g. o f alcohol per kg. D ata from a given anim al joined by a vertical line. T he diagonal line represents our average equilibrium blood/brain alcohol ratio o f 1 : 17. F rom Forney et al?
The diagonal line represents the average blood/brain alcohol ratio we previously had found for dogs which had attained alcohol storage equilibrium in the entire body (blood/brain = 1 :17). Fig. 1 indicates that, regardless of the extent of absorption, the heart blood level paralleled the brain level quite closely, but that, at this time, the level in leg vein blood would have given an erroneously low estimate of the brain alcohol level. To show the almost unbelievable speed with which brain reaches alcohol equili brium with arterial blood, I will briefly review a 1946 study by Hulpieu and Cole8 which has perhaps not received the atten tion it deserves. They gave rabbits 0-5 grams of alcohol per kilo, using a 20% solution injected into the marginal vein of the ear during a period of 20 seconds. At intervals afterwards, ranging from 30 seconds to 5 minutes, groups of the rabbits were decapitated, and drainage blood, brain and muscle tissue were promptly obtained and analysed for alcohol content. Their results are shown in Table II. If equilibrium storage of alcohol had occurred immediately after alcohol injection, the alcohol levels in blood, brain and muscle would have been
214
C H E M I C A L T E S T I N G P R O G R A MME ( 2 )
about 60 mg./lOO g. However, at 30 seconds, the levels in blood and brain were about double this value, but the muscle T a b l e II Average Alcohol Levels in Blood, Brain and Muscle after Intravenous Injection; Effect of Adrenalin* A Icohol Only**
Blood mg.%
Brain mg.%
Muscle mg.%
Rabbits
Blood . mg.%
Brain mg.%
Muscle mg.%
30 sec. 45 sec. 1 min. 2 min. 5 min.
A lcohol After Adrenalin* *♦
R abbits
Time After Alcohol
cubital vein blood level, the average difference being 7-5%. With seven of the pairs the alcohol level in fingertip blood exceeded the level in cubital vein blood by 15% to 22%.
2 1 2 2 3
124 93 104 86 79
168 126 133 86 75
32 32 42 43 51
2 1 4 2 3
881 363 510 128 101
444 331 529 137 100
9 11 7 14 36
♦Condensed by H arger and Forney (22) from data published by Hulpieu and Cole (8). ♦♦Alcohol dosage, 0-52 g./kg., as 33% sol’n. injected in ear vein over a period o f 20 sec. ♦♦♦Adrenalin dose, 0-5 ml. o f 1-10,000 sol’n., i.v. during 11 sec., followed by alcohol in 2 min.
level was less than half of the equilibrium figure. A t the end of 5 minutes the blood and brain levels were approaching equili brium values, but the muscle level still lagged somewhat. Even at 30 seconds, alcohol equilibrium between blood and brain had already been reached, and the blood peak had been passed. Adrenalin, given 2 minutes prior to the alcohol, greatly accentuated the initial elevation of alcohol level in brain and blood and almost blocked the entrance of alcohol into the muscle. In a 1954 study by Forney, Baker and myself,9 correlating the alcohol levels in rebreathed air and blood of human subjects, we analysed both cubital vein blood and blood drawn from the fingertip, since it is generally agreed that fingertip blood approaches arterial blood in C O a content and oxygen saturation. The alcohol dosage was 1*03 or 0-68 g./kg., the drinking period was 1 hour, and the blood samples were drawn 1, 2 and 3 hours after the end of the scheduled drinking period. Some of our subjects were per mitted to do additional drinking less than 1 hour before certain blood samples were taken. Fig. 2 compares the alcohol level in fingertip blood with that in cubital vein blood, drawn simultaneously. The data cover 69 such pairs of blood from 27 subjects. Thirty-four of the 69 pairs of blood were drawn less than 70 minutes after the end of drinking. W ith these 34 pairs, the alcohol level of fingertip blood was generally higher than the
F ig . 2. C orrelation o f alcohol levels in blood from cubital vein and fingertip in 69 pairs o f samples from 27 hum an subjects. Alcohol dosage, 0-7-1-5 g./kg., given orally. From H arger et al.a
In 1960, McCallum and Scroggie,10 of Australia, published an investigation com paring the level of alcohol in cubital vein blood with that in “ a suitable vein in the foot” . With 14 of their subjects the level of alcohol in the foot vein blood averaged 20% below the level in elbow vein blood, the range being —10% to —35%. These 14 pairs of blood were taken 4 to 48 minutes after the end of drinking, the average time being 20 minutes. These interesting results raise further questions regarding blood source and alcohol level during active absorption. I will now briefly report some studies carried out during the past summer by Forney, Hughes and myself,11 in which we analysed blood from various points in the vascular system and also determined the alcohol level in rebreathed air. The drink ing period was 30 minutes, and the alcohol dosage was 1-03 g./kg. For a 150 lb. (68 kg.) person, this dose would be 178 ml. (6 U.S. fl. oz„ or 6£ British fl. oz.) of a beverage containing 50% of alcohol, by volume. The blood samples were taken immediately after the end of drinking, then at 15-minute intervals during the next hour, and at 30-minute intervals during the following hour, making a total of seven test periods. Our arterial blood study continued only 30 minutes.
215
R. N. H A R G E R
In our first study we used five subjects, with fingertip and cubital vein as the chief blood sources. At 15 minutes we also took blood samples from the dorsal venous arch of the foot and from the tip of the large toe. The data obtained are shown in Fig. 3. Immediately after the end of drinking, the alcohol level in cubital vein blood of all five subjects lagged considerably behind the level in fingertip blood. With three of the subjects this lag continued for 30 minutes after the end of drinking. The peak of the fingertip blood alcohol curve is higher and occurs earlier than the peak of the cubital vein blood alcohol curve. Foot vein blood taken 15 minutes after the end of drinking showed a lag behind cubital vein blood similar to that reported by McCallum and Scroggie, and toe-tip blood also lagged behind elbow vein blood. The
III Deviation of Alcohol Level in Cubital Vein Blood from Level o f Fingertip Blood T a b le
Time After End o f Drinking
Aver age
Subject
min.
A
B
C
D
E
0 15 30 45 60 90 120
% -2 3 -2 9 * -1 4 -1 2 * - 2 + 1 + 5
% -1 8 -2 0 -1 4 - 8 - 4* - 7* - 1*
% -1 2 * - 2* + 9* - 4 + 4* + 4 + 4
% -4 0 * -2 6 -2 4 * + 6 + 2 + 5* + 9*
% -2 6 - 9 4* 7 + 10* ** *# +23
% -2 4 -1 7 - 7 - 5 0 + 1 + 8
* = Deviation range. **=D istillates accidentally spilled.
differences which we found between the alcohol levels of blood from the fingertip and cubital vein are summarized in Table III. Rebreathed air was not analysed
•-
- • CUBITAL VEIN BLOOD FINGERTIP BLOOD
X-
-X REBREATHED AIR ▲
FOOT VEIN BLOOD
A
TOE TIP BLOOD
F ig . 3. Alcohol levels in samples o f blood from cubital vein and fingertip o f seven subjects, taken during two hours after the end o f drinking. Alcohol dosage, 1 -03 g./kg., given orally. D rinking time, 30 minutes. Fifteen minutes after end o f drinking, blood samples were also taken from a foot vein and the large toe o f subjects C, D and E.
f
216
C H E M I C A L T E S T I N G P RO G R A MME ( 2 )
BLOOD
REBREATHED AIR x 100
ALCOHOL
(m g.per
100
m l)
mg. ALCOHOL per 2.1 Lltera
— 1
C U B IT A L VEIN
DEVIATION O F A R T E R IA L L E V E L FROM F IN G E R T IP L E V E L
I F IN G E R T IP R A D IA L A R TER Y R E B R E A T H E D A IR
p>-\
15 minutes 30 minutes 15 minutes 30 minutes Av.
♦ 13 % 27 % 4-17 % + 15 % ♦ 18 %
Alcohol levels in blood from cubital vein, fingertip and radial artery of subjects A and E, im m ediately, 15 min. and 30 min. after end o f drinking, and in rebreathed air at 15 and 30 min. Alcohol dosage, 1-03 g./kg. D rinking time, 30 min. Fingertip blood drawn about 2 min. after venous and arterial samples, probably m aking fingertip “ immediate” levels erroneously high
120--
100
100
-
-12 0
80
60
60
BLOOD
ALCOHOL
120
--4 0
4 0 --
AIR
CUBITAL VEIN BLOOD
20-
-
--20
O — O FIN GERTIP BLOOD X------- X RE BREATHED AIR
—I— 15
30
45
60
75
90
105
120
MINUTES A F TE R
0
15
30
45
90
105
120
END OF DRI NKI NG
F ig . 5. Alcohol levels in blood from cubital vein, dorsal vein o f foot, fingertip, and in rebreathed air o f subjects F and G during two hours following end o f drinking. Alcohol dosage, 1-03 g./kg. D rinking period, 30 min.
x 100
A -------A HAND VEIN BLOOD
20-
mg. ALCOHOL per 2.1 Liters REBREATHED
(mg. per 100 ml)
F ig . 4.
R. N. H A R G E R
immediately after the end of drinking because of the danger of erroneously high results from residual alcohol in the mouth. At 15 minutes after the end of drinking, the rebreathed air values for four of our five subjects, like the fingertip blood levels, definitely exceeded the cubital vein blood level. With Subject A, the rebreathed air result at 15 and 30 minutes even exceeded the level for fingertip blood. Later results with this subject’s arterial blood appear to explain this discrepancy. From 45 minutes to 120 minutes, the rebreathed air results ran fairly parallel with the levels of finger tip and cubital vein blood, but were usually a little lower. In a later study, Subjects A and E were again used, and blood from the radial artery was added to the samples analysed. This experiment lasted only a half-hour after the end of drinking. The results are given in Fig. 4. At 15 and 30 minutes the arterial blood alcohol level considerably exceeded the fingertip level the average difference being 18%. The levels in blood from these two sources immediately after the end of drinking appear nearer together, but, unfortunately, the fingertip blood was drawn about two minutes after the arterial blood, at a time when the blood alcohol level was rising sharply. The rebreathed air results are between the fingertip blood and the arterial blood levels, and are nearer to the arterial blood level. For the first two periods, cubital vein blood had the usual lag behind blood from the fingertip. Finally, we used two additional subjects to compare the alcohol levels in cubital vein blood and blood from a vein on the back of the hand. The subject’s hand was not warmed prior to taking the blood sample. For each of the seven test periods we planned to take blood from the cubital vein, fingertip, and dorsal hand vein, and also to analyse rebreathed air. However, the two technicians employed to draw the blood samples were unable to keep up with the schedule, so the blood data are incom plete for certain test periods. The results obtained are shown in Fig. 5. They indicate that, during the entire two-hour test period, the alcohol levels in blood from the back of the hand and blood from the elbow vein were almost identical and that both levels lagged behind the level of fingertip blood during active absorption. Discussion It is true that most blood samples used for analysis in traffic cases are probably
217
drawn after alcohol absorption ceases, when the alcohol level is about the same in all parts of the vascular system. Never theless, the demonstrated discrepancies between venous and arterial blood during active absorption do affect the answers to certain questions often raised regarding the medico-legal interpretation of the level of alcohol in the sample analysed. Five of these vital questions will be mentioned: 1. Does the same blood alcohol level cause greater impairment during the rising phase than during the falling phase ? From his work with dogs, Mellanby12 in 1919 reported such a difference. However, he employed venous blood from the dog’s hind leg, so that his reported blood alcohol levels during the rising phase must have been much lower than the actual levels in arterial blood and brain during that period. The same criticism applies to conclusions drawn from cubital vein blood alcohol data in the human studies conducted by Mirsky et al.,13 Alha,14 and many others. Inci dentally, the drinking period of Mirsky’s subjects and of Alha’s subjects was only 5 minutes, so that the arterial blood alcohol levels during absorption must have greatly exceeded the venous blood alcohol levels which these investigators reported for this period. Goldberg,15 of Stockholm, did use fingertip blood in his impairment studies published in 1943. With three of his impairment tests he found no difference between rising and falling phases, while, with his remaining three tests, impairment was slightly less during the falling phase. Eggleton,16 of England, also used fingertip blood, and her rather limited data from experiments with four subjects do indicate more impairment during the rising phase of blood alcohol. Her subject, on whom she gives complete data, absorbed alcohol so fast that the first blood sample she obtained was practically at the blood alcohol peak, so that no blood alcoholimpairment data are available for the rising phase. Rauschke,17 of Heidelberg, also correlated impairment with rising and falling body alcohol levels, using breath alcohol analyses to estimate body alcohol level. His data indicate that the difference in the two phases, if any, is that of greater impairment from a given alcohol level during the falling phase. 2. When does the blood alcohol peak occur; is back-calculation o f alcohol level reliable? This subject has lately received much attention. Unfortunately, most of the investigators have used cubital vein
218
C H E M I C A L T E S T I N G P R O G R A MME ( 2 )
blood. The results which we have just presented show that the alcohol peak of fingertip blood, and probably of arterial blood, is higher and is reached much sooner than the peak of cubital vein blood, thus shortening the period when backcalculation is questionable. 3. What about post-mortem diffusion o f alcohol from stomach to heart blood? Huber18 and Turkel and Gifford,19 of San Francisco, have claimed such diffusion, because they observed some autopsy cases where the alcohol level in heart blood exceeded that in femoral vein blood. A lag in femoral blood alcohol level is just what one would expect during active absorption, so their results prove nothing. True, some experimenters have demon strated a little alcohol in heart blood after introducing unnaturally high alcohol con centrations into the stomach of an alcoholfree cadaver. This, also, fails to prove that such diffusion occurs normally, because Sunshine,20 of Cleveland, has recently reported that the highest concentration of stomach alcohol which he has observed in a large series of autopsy cases was only 5%, and he says, “people simply do not die with a bellyful of strong liquor” . Another extensive analytical study of post-mortem material was conducted by Freireich21 of New York, who reported that his results certainly do not support the theory of post-mortem diffusion from stomach to heart blood. 4. Is there an accepted range o f bloodl brain alcohol ratio? Many of the animal studies, including some of our own, suffer from the defect that the blood used was venous blood, drawn shortly prior to sacrificing the animal. This gives errone ously low blood/brain ratios during active absorption. In a large series of such analyses made by Gettler et al,22 and a second large series conducted in our department, the blood/brain alcohol ratios reported, after storage equilibrium had occurred, agree well. 5. Are there not great discrepancies between blood alcohol levels, determined directly, and levels calculated from breath analysis? The answer is, yes, if cubital vein blood was used during the period of active absorption. Using fingertip blood during this period will eliminate most of such discrepancies. Summary The data which I have presented seem to indicate that, for estimating the level of
alcohol in arterial blood and brain during the period of active absorption, the body material of first choice is rebreathed air, and presumably alveolar air, with fingertip blood a close second choice; that third place, which is far behind second, goes to cubital vein blood and hand vein blood; and that away in last place is blood from the foot or toe. When they learn the facts about blood alcohol variations during active absorption, drivers charged with intoxication, who have imbibed recently, will perhaps then settle for nothing but pedal blood.
R
eferences
1 Liljestrand, G ., and Linde, P. (1930). Scand. Arch. Physiol., 60, 273. 2 G oldschm idt, S., and Light, A. B. (1925). J. biol. Chem., 64, 53. 3 W idm ark, E. M. P. (1932). “ Die theoretischen Grundlagen und die prakthsche Verwendbarkeit der gerichtlich-medizinischen Alkoholbectimmung", Berlin. 4 Harger, R. N ., Hulpieu, H. R., and Lamb, E. B. (1937). J. biol. Chem., 120, 689. 5 H aggard, H. W ., and Greenberg, L. A. (1934). J. Pharmacol, exp. Ther., 52, 158. 6 Harger, R. N ., Hulpieu, H . R ., and Cole, V. V. (1945). Fed. Proc., 4, 123. 7 Forney, R. B., Hulpieu, H . R., and Harger, R. N . (1950). J. Pharmacol, exp. Ther., 98, 8. 8 Hulpieu, H. R., and Cole, V. V. (1946). Quart J. Stud. Alcohol., 7, 89. 9 H arger, R. N ., Forney, R. B., and Baker, R. S. (1956). Quart. J. Stud. Alcohol., 17, 1. 10 M cCallum, N . , E. W ., and Scroggie, J. G. (1960). Med. J. Aust., 2, 1031. 11 Forney, R. B., Hughes, F. W ., and Harger, R. N ., “ Concentration o f orally-administered alcohol at various points in the vascular system, and in rebreathed air, during active absorption". To be published. 12 Mellanby, E. (1919). Alcohol: British Med. Research Comm., Special R eport Series N o. 31, London. 13 M irsky, A., Piker, P., Rosenbaum, M., and Lederer, H. (1941). Quart. J. Stud. Alcohol, 2, 35. 14 Alha, A. R. (1951). Ann. Acad. Scient. Fennicae, Series A. V., No. 26, Helsinki. 18 Goldberg, L. (1943). Acta physiol, scand., 5, Suppl. No. 16. 16 Eggleton, M. G. (1941). Brit. J. Psychol., 32,61. 17 Rauschke, J. (1954). Dtsch. Z . ges. gerichtl. M ed., 43, 27. 18 H uber, O. (1943). Dtsch. Z . ges. gerichtl. Med., 37, 128. 19 Turkel, H. W ., and Gifford, H. J. (1957). J. Amer. med. Ass., 164, 1077. 20 Sunshine, I. (1957). “ Post-mortem Distribution o f Ethyl-Alcohol", presented a t the 1957 meeting o f the American Academy of Forensic Sciences. 21 Freireich, A. W. (1960). Paper read at the 2nd International Meeting on Forensic Pathology, Medicine and Toxicology, New York. 22 Harger, R. N ., and Forney, R. B. “ The Aliphatic Alcohols” , Chapter in Advances in Toxicology, Ed. by Stolman, A., New York (in press).
R. N. H A R G E R
219
DISCUSSION Dr. Lester (U.S.): In view of the large differ Mr. Donovan (Eire): Is breath analysis favoured ences of alcohol content in different portions over blood analysis for alcohol determination of the brain, reported by various German in the United States, and, if so, why? Are the workers, what portion or portions of the brain results of breath analysis accepted as evidence were used in your work? in the courts, without the supporting evidence Professor Harger: In our work we hashed the of blood or urine analysis, or of medical entire brain, and analysed a representative evidence ? sample, as did Gettler and his colleagues in Professor Harger: Whether breath is favoured their study with dogs in New York. Dr. over other materials depends on the State. Hebbelink of Belgium, perhaps the first man Some States, such as Ohio, use urine a good to work on this, is here today, and he pub deal; in others they use only blood. You can lished a series on autopsy cases where he get this information from the yearly reports of analysed various parts of the brain and did the National Safety Council, which set out find differences. Meyer from one of the what methods are used and the percentage of German universities, used mice, and found convictions. I would say that at least twodifferences in various parts of the brain after thirds of the analyses done in our country at he had given them alcohol. Professor V&mosi the present time are breath, and most of them told me yesterday that he has done work with are not supported by analysis of either urine monkeys on this. All these workers report or blood. Now, I have repeatedly stated in differences in different areas of the brain. I court that in my opinion, with a properly think there are several possible explanations. trained police technician, these methods of If the samples were taken before complete breath analysis are so simple that a mistake is distribution had occurred, thqn you would almost inexcusable, and I have further said that have different results in various parts of the in my opinion I would sooner rely on the results brain which have different circulation; exactly of a police technician whom we have carefully as you would have, for example, if you analyse trained in our school, than I would on a whole the muscles from which the venous return goes lot of girl laboratory technicians in hospitals. into the cubital vein, or the muscles of the foot from which the return goes to the dorsal vein. Professor Alha (Finland): When I did my basic Another possible explanation is water content, work on the Widmark factors with Finns and the third explanation is the well-known venous blood was taken for practical reasons. post-mortem changes in the alcohol content of Now our whole back-calculation system certain parts of the body. Meyer explains this depends on this work. When less than two as a matter of circulation. Finally, hours have elapsed after the ingestion do we Muehlberger pointed out some years ago that endanger legal safety by doing this? any arguments about the parallelism between Professor Harger: I think you are safe if you blood alcohol and brain alcohol are really a say that the level you found an hour after the little bit spurious, because practically all of the accident was probably at least as high at the impairment studies have been done with blood. time of the accident. In our country our courts So that the conclusions as regard what limit have permitted back-calculation, and I usually there is. above which all drinkers, even the give a maximum, a minimum and the average: most seasoned, would be under the influence, a minimum of 10 mg./lOO ml. per hour, a maximum of 20 mg. and an average of 15 mg. are not affected.