International Journal of Environmental Science & Technology Vol. 1, No. 1, pp. 59- 68, Spring 2004
Biological indicators of air quality in Brisbane, Australia *
M. Azadi and D. Doley
Department of Environmental Science, University of Queensland, Brisbane, Australia
Abstract During very considerable progress in industry and industrial centres development in late 20th and early 21st century, air pollution has become one of the most significant problems of mega cities. Thus, air pollution survey to exert abatement methods has a very important role. Various methods are available for air pollution monitoring which are very costly. Air pollution monitoring by susceptible plants as biological indicators are not only economic but also simple. In this paper, vast studies were done on the plants of around each Queensland Environmental Protection Agency (QEPA) monitoring sites. Around these sites susceptible plants to air pollution were neither available nor exist in all monitoring sites. Therefore, it seemed the best method is the portable exposure benches application with automatic watering system in five sites among all studied locations. In this research different varieties of tobacco like Weather fleck, Bel-B, Bel-W3, Dynes, ZZ100 were used to measure the impact of ozone as a pollutant on them. Parsley cv. Frizz and Leek cv. Vertina were selected as nitogen oxides indicators. In general, the above-mentioned plants were exposed to the ambient air in five sites around Brisbane from April 1997 to May 1998. The susceptible variety leaves of Bel-W3 showed injuries just in two sites. The reason for this is the high level of ozone and the effects of climatic factors in production and dispersion of it during the experiments. The survey results represent that ozone with elevated concentrations is available as far as 30km radius from Brisbane city centre. Within this area only the most susceptible plants’ leaves would be liable to suffer injury. Key words: Biological monitoring, nitrogen oxides, ozone, portable exposure bench *Corresponding Author, E-mail:
[email protected]
Introduction were not observed on the suburbs vegetation. Tobacco cv.Bel-W3 variety develops characteristic foliar injury when ozone concentrations exceed 4 pphm for a few hours. This concentration is the maximum which occurs from natural sources for example, thunderstorm or stratospheric mixing (Horsman, 1981). If Bel-W3 is exposed to ozone for an hour with 7.65 pphm concentration, foliar injury will be appeared again (Treshow and Lacass, 1976). Hence, this plant is very appropriate for ozone monitoring and measurements. Of course, in this experiment, Weather fleck, Bel-B, Dynes and ZZ100 are also used, but susceptibility was measured in comparison to Bel-W3 variety.
Biological monitoring by susceptible plants, particularly Nicotiana tabacum cv.Bel-W3 and other certain species is common in many countries such as; The United States, Australia, The United Kingdom, Germany, Japan, Sweden, Switzerland, Italy, The Netherlands, Mexico, India and Taiwan (Heggestad, 1991). In 1981, this method is used around Melbourne, Australia (Horsman, 1981). In recent years, with the development of industrial centres, the air pollutants level in some parts of Brisbane has been increased (DOE, 1990-1997), and from 1990 to 1997 the ozone level has been increased up to 11.9 pphm in December 1993 (DOE, 1993). Nitrogen oxides and ozone monitoring by digital analyzers has been used around Brisbane since January 1978. Air pollutants measurements have been carried out in monitoring sites around Brisbane, monthly (DOE, 1990-1997), but considerable damages
Objectives
Air chemical
59
quality
monitoring
and physical
via
either
measurements
or
M. Azadi and D. Doley
biological monitoring is performed because of the following reasons: 1. To determine compliance with the state regulations. 2. To determine potential effects on human health. 3. To determine the effects on environmental health. 4. To identify the source of pollution. 5. To provide exposure data for using in epidemiological studies. 6. To identify trends in pollutant concentration. 7. The principal objectives of this study are as follows: 1. To investigate the conditions of plants and plant communities in the area selected for study (in particular, to assess plants’ visible injury). 2. To establish a biological monitoring system for oxidant pollutants in Queensland using sensitive plant species. 3. To establish a reliable field exposure system, including an automatic watering system for air pollution monitoring by susceptible plants at each monitoring site. 4. To co-ordinate this biomonitoring system with the air quality-monitoring network operated in the Brisbane area by the Queens land Environmental Protection Agency.
Active monitoring method:
Indicator species exposure under appropriate conditions like humidity, temperature and sunlight radiation is called active monitoring. In the meantime, like previous monitoring method, bioindication was performed at plants’ tissues and organs level (Steubing and Jager, 1982). This method, along with the Portable Exposure System was determined as the most appropriate for this purpose (Arndt, et al., 1985). Portable exposure benches system
Five portable exposure structures were constructed for disposition at five QEPA monitoring sites, following the design described by Arndt et al., (1985). The framing of the structures was constructed from square galvanized steel tube; 25×25 mm section, and wall thickness 1.6 mm. For developmental work or where the location had to be changed frequently, it would be preferable to use demountable frames made of aluminum tubing. Two rectangular frames; 50×160 cm were incorporated in the structure at the height of 80 cm above the ground. The frame 1.2 m heights was constructed to accommodate 3 plastic storage boxes with outside dimension of 52.7×38.1×14 cm and capacity of 22.7 liters. It was sufficient to enable exposure times of the end of about 14 days free from attention to be obtained. The top of each storage box was fitted with a Styrofoam block measuring 53×15×38 cm in which slots were cut to accommodate the plastic pots containing the test plants. Two rows of five holes, which were cut to closely, fit the pots and a lip to fit closely on the top of the water reservoir. The pots were rectangular in outline and approximately 500 ml capacity. A fiberglass wick of 3cm width and 2.5 mm thick was fitted to each pot, passing from the base of the pot, up the side and then between the pot and Styrofoam block into the waterfilled plastic storage box. On the top and the upper 80 cm of four sides of the metal frame, shade cloth of 80cm width, and with a shade factor of 50% was stretched. The shading was essential to dampen the extreme variations in the radiation climate in the exposure unit, although the reaction of most indicator plants to photo oxidants is much less under shade than under direct sunlight
Biological Monitoring Methods A monitoring program can be carried out in two different ways: Passive monitoring method:
Observation and analysis of local flora, may it be wild, culture or forest plants is called passive monitoring. In this method, the bioindication for emission load was at plants’tissues and organs level (Steubing and Jager, 1982). The plants of around the following QEPA sites were carefully studied. Deception Bay, Queensland University of Technology, Zillmere, Eagle Farm, Fortitude Valley, Mount Warren Park, Flinders View, Mutdapilly. Since there were no susceptible plants to air pollution for bioindication purposes, this method was considered as inappropriate. Therefore, the Portable Exposure Benches System was employed. 60
Biological indicators of air ...
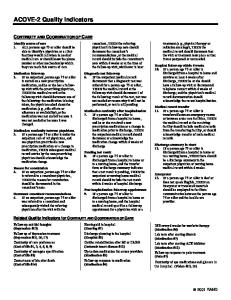
Figure 1: Desighn details of portable plant growth structures
(Arndt, et al., 1985). Figure 1 shows the construction details. Normally, during the biomonitoring period, plants were checked weekly or biweekly. The time interval depended on climatic conditions, availability and condition of the plants, and the ability to travel to all sites within one or two days. Consequently, the travel time between inspections varied, but in each case comparisons were made between plants conditions and the pattern of ozone concentration within that period.
-Nicotiana tabacum cv. Bel-B -Nicotiana tabacum cv. Weather fleck -Petroselinum crispum cv. Frizz -Allium porum cv. Vertina Among the above-mentioned plants, the susceptibility of ZZ100, Dynes and Weather fleck to ozone must be determined. Bel-W3 is very susceptible, and Bel-B is tolerant to ozone. Frizz and Vertina varieties are also sensitive to high concentration of nitrogen oxides. Plants were grown from seed in a standard soil mix under glasshouse conditions. After about four weeks the seedlings were transplanted into rectangular pots of 500ml capacity containing fresh soil mix. Five replicate plants of each variety (according to the experiments) were placed at selected field sites when about six to nine weeks old (four to seven leaf stage) and replaced by fresh (six to
Test plants material and cultivation method
Plants materials were divided into ozone and NOx test species. The plant materials (seeds), which were used, are as follows; -Nicotiana tabacum cv. ZZ100 -Nicotiana tabacum cv. Dynes -Nicotiana tabacum cv. Bel-W3 61
M. Azadi and D. Doley
determined. The injury rating scales for the field experiments are: 0: Less than 5% injury of leaves 1: Between 5%-15% injury of leaves 2: Between 15%-25% injury of leaves 3: Between 25%-35% injury of leaves
nine week old) plants at intervals (the duration of intervals varied during the experiment). This survey was carried out between 15 April 1997 and 5 January 1998. Locations of portable exposure benches in the suburbs
4: Between 35%-45% injury of leaves
Table 1 and Figure 2 show the location of Portable Exposure Benches. From eight air pollution monitoring sites which belong to Queensland Environmental protection Agency, four of them were selected as follows: Flinders View, Rocklea, Eagle Farm and Zillmere. These four sites at four directions around Brisbane were measuring the air pollution level in suburbs and for city centre a monitoring site was established at the University of Queensland.
Results and Discussions To make a standard size for this article, details about all figures of ozone and nitrogen oxides levels were not mentioned. Only the most significant figures, which caused foliar injury on test plants, were noted. If susceptible plants like Vertina and Frizz varieties are exposed to the dose of 212.8 pphm of nitrogen oxides for an hour, they will show damage on their leaves (Posthumus et al., 1989). No visible injury attributable to nitrogen oxides occurred in any of the species used in the survey, and the ambient concentrations of NOx were sufficiently low that parsley and leek plants were removed from the trial in July 1997. As mentioned in introduction section, susceptible plants were vastly used in some countries, but the application of them in Queens land was for the first time. In Addition to that, research on the Dynes, weather fleck and ZZ100 varieties of tobacco is new and previous works were mainly based on study regarding Bel-W3. On cultivation method, although plants were grown in the glasshouse environment, but they were fully checked and only plants with healthy leaves were exposed to the ambient. Mild chlorosis was common throughout the study, in all varieties of tobacco at all sites. The cause could not be determined with certainty, but could be attributed to nutritional limitations in the relatively small soil containers and to ageing of the plants during small exposure periods. Scattered necrosis occurred throughout the study, occasionally due to insect attack, but on some occasions the cause could not be indentified. If Bel-W3 variety is exposed to ozone with the dose of 7.65 pphm for an hour or 3.82 pphm for 8 hour, foliar injury will be appeared on plant (Posthumus et al., 1989). During ozone assessment, bleaching injury is the most effective diagnosis. For each location, a single installation containing five plants from each
Table 1: Location of Exposure Protable Benches in Queensland Environmental Protection Agency air pollution monitoring sites Site Flinders View (FLV.) Rochlea (Roc.) Eagle Farm ( Eag.) Zillmere (Zil.) University of Qld (UQ)
Addresses Telstra Exchange Rief Street, Flinders View Animal Husbandry Research Farm, Rocklea Brisbane City Council, Fleet Garage Curtin avenue and Holtz street, Eagle Farm Qfleet Garage Pineapple street, Zillmere The University of Queensland, St.Lucia
Assessment of damage on test plants
Among the leaves of test plants on Portable Exposure Benches three categories of injuries were recorded during field experiments: • Chlorosis: an injury condition in green plants marked by yellowing and blanching. • Necrosis: is a localized death in living tissues, for instance in plants leaves. • Bleaching: is an injury condition in which the plant tissues (particularly leaves) lose their colors and become white. Certain air pollutants may appear these lesions but they more often occur with other pathogens. To increase the speed of assessment, the injury rating scales were subjectively and visually 62
Biological indicators of air ...
been analyzed statistically, but they do permit associations to be indicated between the occurrence of elevated ozone concentrations at some time during a survey period and the occurrence of visible injury. Limited bleaching (Injury category 1, between 5 and 15% of the affected leaf area) was observed at various periods and sites in tobacco varieties Bel-B, Weather fleck and Dynes (Figure 3). There was no clear relationship between maximum one-hour ozone concentration for the reporting periods and the extent of injury, suggesting that ozone was not the cause of this limited bleaching.
species was used for economic reasons. Injury was recorded as the category corresponding to maximum injury observed on any nonsenescent leaf carried on the five plants in sample. Even within cultivars of a species such as Nicotiana tabacum, there is a variation between plants and also between leaves of individual plants in their reponse to ozone. The sample size and frequency of observation that had to be adopted in the present study reduced the precision of observation to the point where it was not appropriate to undertake a statistical analysis. Consequently, the data with details have not
Figure 2: Location of air pollution monitoring sites in south –east of Queensland. Location of portable exposure benches were shown by cross. 63
M. Azadi and D. Doley
propensity for ozone injury in November than in September may be associated with the increased temperatures later in the year. Table 4 exhibits the monitoring sites temperatures during biological monitoring period. Table 2 indicates that there is a clearer threshold concentration for bleaching injury in tobacco cv. Bel-W3 when maximum one-hour mean concentrations are used, rather than 8-hour mean concentrations. This propsition was tested explicitly in experimental fumigations. In order to check the results and classify the susceptibility of studied varieties of tobacco, open cgamber fumigation method with a very powerful ozone generator was employed. During fumigation other environmental factors like temperature, humidity and sunlight were controlled. Plants were well watered before each experiment to optimize stomatal opening. Pots containing experimental plants should be enclosed in polyethylene bags in order to minimize ozone absorption by the soil in the pots. Test plants were inserted in the open chamber for fumigation and exposed to ozone concentrations between 7.5 pphm up to 26 ppmh. No injurious effects were observed when Bel-W3 plants were exposed to 7.5 pphm ozone, about 20% of leaf area showing injury at 16 pphm, also about 35% injury at 26 pphm. In this experiment, variation in symptom expression between the varieties was distinct. Tobacco cv.Bel-W3 was clearly the most sensitive to ozone, followed by variety also exuded a sticky resinous material when injured; some leaves developed a general silvery colour. These symptoms appeared after 16 pphm. Tobacco cv. Weather fleck, which had been suspected of being very sensitive to ozone injury, did not show the typical bleaching symptom under experimental conditions. The cause of the weather fleck symptom under field conditions could not be established by the present studies, but it can be concluded that the weather fleck symptom is not due to elevated oxidant concentrations in the Mareeba district farms of north Queens land (mild wilting appeared on some of the leaves of plants when the ozone concentration reached more than 16 pphm). The cvs.ZZ00 and Bel-B did not exhibit any injury symptoms during fumigation experiments.
No injury was recorded in tobacco variety ZZ100. The tobacco variety Bel-W3 showed either no injury or distinct injury but only at Flinders View and Rocklea (Table 2). Injury to about 25% of the leaf surface occurred during the two periods at Flinders View, 28 October to 10 November and 11 November to 1 December 1997(Figure 5 and 6) and in one period at Rocklea; 28 October to 10 November 1997 (Figure 4). The limited occurrence of injury and the clarity with each injury symptoms were expressed in the periods indicated, strengthens the conclusion that the injury was due to ozone. The lowest one-hour ozone concentration associated with the occurrence of visible injury was 8.8 pphm, at Rocklea on 8th November 1997. The corresponding 8-hour mean concentration for this day was 5.1 pphm, and the maximum onehour ozone concentration on the final seven days of the two-week exposure period was 3.5 pphm (Table 2). This indicates that a single exposure to ozone with a maximum one-hour concentration approaching 9 pphm is sufficient to cause injury between 15% and 25% of leaf area. During the following monitoring period; 11 November to 1 December 1997, there were four periods of elevated ozone concentration at Flinders View; 8, 13 & 26 November and 8 December. On each occasion the one-hour ozone concentration exceeded 10 pphm, and tobacco Bel-W3 leaves showed bleaching injury to between 25% and 35% of their area. At Rocklea during the same period, the maximum one-hour ozone concentrations on 8,16, 26 November and 1 December were 8.8, 7.7, 7.6 and 7.0 pphm, respectively (Table 2). There were some bleaching injuries to tobacco cv. Bel-W3 leaves during this period. The mean maximum eight-hour ozone concentration was 5.7 pphm. This evidence suggests that the maximum one-hour concentration may be more important in determining the extent of bleaching injury to tobacco cv. Bel-W3 leaves than the cumulative dose over several days. Further, the critical ozone concentration appears to be about 9 pphm. This concentration is not independent of other environmental conditions, as a onehour maximum concentration of 9.0 pphm was recorded at Rocklea on 27 September 1997 (Table 3), in the absence of bleaching injury to tobacco cv. Bel-W3 leaves. The greater 64
Biological indicators of air ...
Table 2: Occurrence of elevated ambient concentrations and bleaching injury to Nicotiana tabacum cv. Bel –W3 during the field monitoring period in 1997 (From 28.10.97 to 10.11.97 & From 11.11.97 to 1.12.97) Monitoring
Station
28.10.97 10.11.97
Flv Roc. Eag Zil
2 2 0 0
08.11.97 08.11.97 08.11.97 08.11.97
Ozone concentrations (pphm) 7 days 1h 8h (1h max) 9.8 5.7 4.12 8.8 5.1 3.5 7.6 4.5 3.2 5.3 4.1 3
11.11.97 01.12.97
Flv. Roc. Eag. Zil.
3 0 0 0
01.12.97 16.11.97 17.11.97 17.11.97
10.6 7.7 7.1 6.4
7.2 5.9 5.8 5.6
7.4 5.7 3.8 4
Flv. Roc. Eag. Zil.
3 0 0 0
26.11.97 26.11.97 01.12.97 01.12.97
10.2 7.6 6.1 5.6
6.2 5 5 5
7.4 5.7 3.8 4
Flv. Roc. Eag. Zil
0 0 0 0
13.11.97 01.12.97 16.11.97 13.11.97
8.3 7 5.3 5.3
5.6 5.1 4.1 4.3
5 4.7 4.1 4.2
Period
Injury
Date of max
Score
1h ozone
Table3: Occurrences of elevated ambient ozone concentrations and bleaching injury to Nicotiana tabacum cv. Bel-W3 during the field monitoring period in 1997 (From 29.7.97 to 16.9.97 & from 17.9.97 to 30.9.97) Monitoring Period
Station
Injury Score
Date of max 1h ozone
29.7.97 16.9.97
FLV Roc. Eag Zil
0 0 0 0
23.8.97 9.9.97 4.9.97 4.9.97
Ozone concentrations (pphm) 1h 8h 7 days (1h max) 4.1 3.3 3.6 5.5 3.7 4.25 5.1 3.8 3.38 5.3 4.2 3.37
17.9.97 30.9.97
Flv. Roc. Eag. Zil.
0 0 0 0
27.9.97 27.9.97 27.9.97 29.9.97
5.6 9 6.2 6.2
4.9 5.6 4.9 5
4.07 4.61 4.15 4.22
n.a.: not available Table4: Monthly average temperature (0C) in the air pollution monitoring sites for biological monitoring period (from April to December 1997 and January 1998). The data are based on the temperatures that recorded by the QEPA (Neale Ppers. Comn.2000) Eag. Flv. Roc. Zil. Total Av.
Apr. 20.7 20.5 n.a. n.a. 20.6
May. 17.9 17.3 n.a. n.a. 17.6
Jun. 14.9 13.5 n.a. n.a. 14.2
Jul. 14.5 13.7 n.a. n.a. 14.1
Aug. 15.2 14 15.5 n.a. 14.9 65
Sept 18.3 19 n.a. n.a. 18.6
Oct. 20.3 21.2 20.6 n.a. 20.7
Nov 23.6 22.8 22.8 n.a. 23
Dec. 25.6 25.3 25.4 n.a. 25.4
Jan. 27.2 25.3 25.4 n.a. 25.9
M. Azadi and D. Doley
Figure 3: Relationship between bleaching injury score in five varieties of Nicotiana tabacum and maximum one hour ozone concentrations in Brisbane area during two monitoring projects (From 18.10.97 to 10.11.97 and from 11.11.97 to 1.12.97)
Figure 4: Effects of O3 on the leaves of T. cv. Bel-W3 in rocklea (28 October to 10 November 1997)
Figure 5: Effects of ozone at the tip of Tobacco cv. Bel-W3 leaf in flinders view 66
Biological indicators of air ...
Figure 6: Effects of O3 on the leaves of T.cv. Bel-W3 in Flinders view (28 October to 10November 1997)
Bel-B is recognized as being resistant to ozone injury, and the locally grown ZZ100 can also be placed in this category.
Department of the Environment (DOE), Data Report, Ambient air quality and monitoring annual data summary. Brisbane.Australia, (1): 3, 1990
Conclusions
Department of the Environment (DOE), Data Report, Ambient air quality and monitoring annual data summary. Brisbane. Australia, (6): 5, 1991
The area around Brisbane which is affected by elevated concentrations of ozone appears relatively small compared with that associated with other cities experiencing photochemical air pollution. Furthermore, it is considered that within this area only the most ozonesusceptible vegetation would be liable to suffer injury. This situation exists mainly because of the rare occurrence of sustained periods (2-4 days) of stable weather conditions conducive to ozone formation and the exposed nature of Brisbane’s location on a coastal plain.
Department of the Environment (DOE), Data Report, Ambient air quality and monitoring annual data summary. January-December Brisbane, Australia, (7): 4, 1992 Department of the Environment (DOE), Data Report, Ambient air quality and monitoring 1993 annual data summary. Brisbane.Australia, (8):6, 1993 Department of the Environment (DOE), Data Report, Ambient air quality and monitoring 1994 annual data summary. Brisban, Australia, (9), 1994 Department of the Environment (DOE), Environmental technical report, Ambient air quality and monitoring annual summary and trend report, Brisbane. Australia, (16): 8, 1995
Acknowledgements The authors are indebted to Drs. R. Riese, V.A. Sisson, A.E.G. Tonneijck, D. Neale for their scientific supports and Mr.D.Wainwright, P. kingston and G. Andrews for their skillful technical assistance.
Department of the Environment (DOE), Environmental technical report, Ambient air quality monitoring annual summary and trend report, Brisbane, Australia, (19): 7, 1996 Department of the Environment (DOE), Issues and options for managing air quality in southeast Queensland SEQRAQS Discussion paper. Brisbane. Australia, 3-10, 15-18 and 21-26, 1997
References Arndt U., W. Erhardt, A. Keitel, W. Nobel, C. Schulter, Standardisierte exposition Von pflanzlichen reaktionsindikatoren. Staub-Reinh. Luft 45: 481-483,1985
Department of the Environment (DOE), Draft strategy for managing air quality in southeast Queensland, 4-42, 73-77, 1998
67
M. Azadi and D. Doley
Heggestad, H.E., Origin of Bel-W3, Bel-C and Bel-B tobacco varities and their use indicators of ozone. Environmental Pollution 74: 264-291, 1991
Steubing L., H.J. Jager, Monitoring of air pollutants by plants. Junk W., Publishers, The Hague, 7377,1982
Horsman, D.C., A survey of ozone in Melbourne using tobacco as an indicator plant. Environmental Pollution Ser.B, 69-77,1981
Treshow M., N.L. Lacasse, Diagnosing Vegetation Injury Caused by Air Pollution, Applied Science Associates INC.U.S.A. (Developed for Environmental Protection Agency of U.S.A.), 1976
Posthumus A.C., A.E.G. Tonneijck and L.J Van Der Eerden, Exposure-effect relationship for plants in relation to several air pollutants. In man and his ecosystems. Proceedings of the 8th World Clean Air Congress, 13-18 1989; The Hague, The Netherlands, 11-15 September 2,1989; Elsevier Science Publishers B.V.Amsterdam, 1989
68