Available online www.jocpr.com
Journal of Chemical and Pharmaceutical Research, 2013, 5(8): 188-194
Research Article
ISSN : 0975-7384 CODEN(USA) : JCPRC5
Simultaneous estimation of phenylephrine hydrochloride and guaifenesin in bulk drug and pharmaceutical dosage forms by RP-HPLC-PDA method CH. Suma, K. Vasantha, A. Prabhakar Reddy, CH. Ajay Kumar and Buchi N. Nalluri* Department of Pharmaceutical Analysis, KVSR Siddhartha College of Pharmaceutical Sciences, Vijayawada, AP, India _____________________________________________________________________________________________ ABSTRACT The aim of the present work was to develop and validate a simple, efficient and economical method for the analysis of Guaifenesin and Phenylephrine hydrochloride in bulk drug and pharmaceutical dosage forms by reverse phase high pressure liquid chromatography. A Zorbax reverse phase C18 column (150 x 3.0mm, 3.5µm) with mobile phase containing 5mM ammonium acetate: acetonitrile (80:20% v/v) was used at isocratic mode and eluents were monitored at 222nm. The retention time of Phenylephrine hydrochloride was 1.62 min and Guaifenesin was 2.28 min and showed a good linearity in the concentration range of 1-5µg/mL for Phenylephrine hydrochloride and 1575µg/mL for Guaifenesin with a correlation coefficient >0.999. The validation characteristics included specificity, linearity, and limit of detection, limit of quantification, precision, assay, accuracy, robustness and stability. Validation acceptance criteria were met in all cases. The percent recoveries ranged in between 98-102 (RSD < 2). The method was successfully used for the simultaneous analysis of Phenylephrine hydrochloride and Guaifenesin in bulk drug and pharmaceutical dosage forms. Keywords: Guaifenesin, Method Validation, Phenylephrine hydrochloride, PDA Detection, Zorbax column _____________________________________________________________________________________________ INTRODUCTION Phenylephrine hydrochloride (PHY), a synthetic sympathomimetic agent, chemically it is Benzenemethanol, 3hydroxy-α [(methylamino) methyl]-hydrochloride (R) [1] is a vasoconstrictor and pressor drug and is used in the treatment of sinusitis and bronchitis [2]. Guaifenesin (GFN) is an expectorant, chemically it is 1, 2-propanediol, 3(2-methoxy phenoxy)-1, 2-propanediol [1] the action of which promotes or facilitates removal of secretions from respiratory tract and is used in the treatment of cough and congestion caused by common cold and bronchitis [2]. Various analytical methods have been reported in the literature for quantitative determination of PHY and GFN individually and in combination with other drugs by HPLC [3-12], TLC [12], UPLC [13] and by UV [14] methods. However, there were no validated RP-HPLC/PDA methods reported for the simultaneous estimation of PHY and GFN in bulk drug and pharmaceutical dosage forms. Moreover, the reported HPLC methods for the estimation of PHY and GFN in combination with other drugs used phosphate buffers in mobile phases with high percent of organic solvents. Hence, the present investigation was aimed at developing a validated RP-HPLC-PDA method for the simultaneous analysis of PHY and GFN in bulk drug and pharmaceutical dosage forms which is LC-MS compatible and economical. EXPERIMENTAL SECTION PHY and GFN drugs were gift sample from Hetero Drugs Ltd, India. Ammonium acetate, water, acetonitrile and methanol were purchased from E. Merck, Mumbai, India. All the solvents and reagents were of HPLC grade.
188
Buchi N. Nalluri et al J. Chem. Pharm. Res., 2013, 5(8): 188-194 ______________________________________________________________________________ Tablet formulation containing Phenylephrine hydrochloride 40mg and Guaifenesin 600mg was punched by direct compression technique, due to the unavailability of tablet formulation in Indian market. Instrumentation A Shimadzu Prominence HPLC system provided with DGU-20A3 degasser, LC-20AD binary pumps, SIL-20AHT auto sampler and SPD-M20A PDA detector was used. Data acquisition was carried out using LC solutions software. The chromatographic analysis was performed on Zorbax- C18 reverse phase column (150 × 3mm, 3.5µm). Chromatographic Conditions Mobile phase consisting of 5mM ammonium acetate: acetonitrile (80:20% v/v) was used in isocratic mode and the mobile phase was filtered through nylon disc filter of 0.45µm (Millipore) and sonicated for 3 min before use. The flow rate was 1 mL/min and the injection volume was 10µL. PDA detection was performed at 222nm and the separation was achieved at ambient temperature. Preparation of stock and standard solutions The stock solution of PHY and GFN strength 1mg/mL each were prepared by dissolving 10 mg of each drug in methanol and volume was adjusted to the mark with the same. An appropriate volume of the stock solution for both drugs was then further diluted with ammonium acetate to get the required concentrations of standard solutions at a concentration range of 1-5µg/mL of PHY and 15-75µg/mL of GFN. Method validation The proposed method was validated as per ICH guidelines. Linearity A linear relationship was evaluated across the range of the analytical procedure with a minimum of five concentrations. A series of standard dilutions of PHY and GFN were prepared over a concentration range of 15µg/mL of PHY and 15-75µg/mL of GFN and injected in triplicate. Linearity is evaluated by a plot of peak areas as a function of analyte concentration, and the test results were evaluated by appropriate statistical methods where by slope, intercept, and regression (R2) correlation coefficients (R) were calculated and the data was given in Table-1. Precision Precision is the measure of closeness of the data values to each other for a number of measurements under the same analytical conditions. Repeatability was assessed by using a minimum of six determinations at 100% of the test concentration. The standard deviation and the relative standard deviation were reported for precision. Less than 2% RSD for peak areas indicates the precision of the developed method and the data was presented in Table-1. Specificity The specificity of the method was determined by comparing the chromatograms obtained from the drug substance with that obtained from the tablet solution. The overlay of diluent, placebo, standard and sample were presented in Figure-2. The retention times of drug substance and the drug product were observed. Absence of interference of excipients in the tablet indicates the specificity of the proposed method. Accuracy Accuracy was established across the specified range of the analytical procedure. To ascertain the accuracy of the proposed method recovery studies were performed by the standard addition method by spiking 80%, 100%, 120% of the known quantities of standard within the range of linearity to the synthetic solution of drug product (2µg/mL of PHY and 30µg/mL of GFN) and these solutions were analyzed by developed method in triplicate. The % recovery and the RSD were calculated at each level of addition and the data was given in Table-1. Limit of Detection (LOD) and Limit of Quantification (LOQ) LOD and LOQ were calculated based on calibration curves. They were expressed as LOD = (3.3 ×σ)/m; LOQ= (10.0×σ)/m; where, (σ is the standard deviation of the y-intercepts of the three regression lines and m is mean of the slopes of the three calibration curves). Robustness To determine the robustness of the method developed, the experimental conditions were deliberately altered and the chromatographic parameters viz., tailing factor, no. of theoretical plates and retention times were recorded. The flow rate of the mobile phase was 1mL/min. To study the effect of flow rate, the flow rate was changed by 10%, the effect of wavelength was studied by changing wavelength by ±2nm and the effect of mobile phase was studied by changing composition of the mobile phase by ±2% v/v and the data was given in Table-2.
189
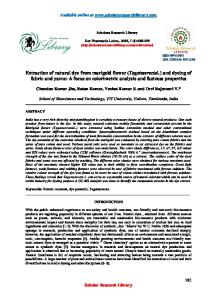
Buchi N. Nalluri et al J. Chem. Pharm. Res., 2013, 5(8): 188-194 ______________________________________________________________________________ System suitability System suitability was carried out by injecting a standard concentration (2µg/mL of PHY and 30µg/mL of GFN) at different injection volumes in the range of 5-25µL. The system suitability test parameters were noted and RSD was calculated. Assay Twenty tablets were weighed and finely powdered, the powder equivalent to 1.3mg of PHY and 20mg of GFN were accurately weighed and transferred into a 10mL volumetric flask and dissolved in methanol and vortexed for 5min and volume was adjusted up to the mark with methanol. The above solution was centrifuged and then filtered using Nylon disposable syringe filter (13mm, 0.45µm). An aliquot of filtrate was diluted with ammonium acetate and analyzed in triplicate. The amount present in the each tablet was quantified by comparing the area of standard PHY and GFN with that of the sample and the data was presented in Table-1. Preparation of PHY and GFN Tablets by Direct Compression Technique Due to the unavailability of marketed tablet formulation for PHY and GFN combination in Indian market, tablets were prepared in house by direct compression method using microcrystalline cellulose, colloidal silicon dioxide and sodium starch glycollate (SSG) as excipients. All the ingredients were passed through sieve # 80 before mixing. Initially, drugs and filler were mixed thoroughly, followed by the addition of required amount of colloidal silicon dioxide and mixed thoroughly for 5min in a poly bag. Required amounts of SSG was then added and mixed thoroughly for 5 min. Finally, the resultant powder blend (for 20 tablets) of the required formulation was compressed on single punch tablet press (Cadmach, India) using 10 mm punches (round shape) maintaining a hardness range of compressed tablets between 4-5 kg/cm2. RESULTS AND DISCUSSION Various HPLC methods were published for the estimation of PHY and GFN in combination with other drugs like Ambroxol HCl, Chlorpheneramine maleate, Dextromethorphan and Terbutaline sulphate, but no methods were reported so far on the quantification of PHY and GFN combination in dosage forms. Hence, the present investigation was aimed to develop a simple, economical RP-HPLC-PDA method for the determination of PHY and GFN in bulk drug and pharmaceutical dosage forms. Method Development Mobile phase optimization was initially carried with Phenomenex C18 column (250 x 4.6 mm) using methanol and water (43:57 %v/v) as mobile phase in different ratios, PHY peak tailing was observed at 1 mL/min flow rate. In the second trial, using methanol and OPA (50:50 %v/v) as mobile phase in different ratios, there was mixing of PHY peak with solvent front. In other trial Develosil RP-aqueous column (250 x 4.6 mm) using 5mM ammonium acetate and methanol (50:50%v/v) as mobile phase was used and the peaks observed was not with good symmetry. Finally the mobile phase of 5mM ammonium acetate and acetonitrile at a ratio of (80:20% v/v) was selected using Zorbax C18 column, at a flow rate of 1mL/min using ammonium acetate as diluent, in this condition sharp peaks with good symmetry were obtained for both the drugs and tailing factor was within the limits and the peak eluted within 10 min run time. The retention time of PHY was 1.62min and GFN was 2.28min. For quantitative analytical purpose wavelength was set at 222 nm, which provided better reproducibility with minimum or no interference. The method was validated as per ICH guidelines. The peak purity index was found to be greater than 0.9999 and this indicating peak purity of the drug sample used in the analysis and shown in Figure-1 along with UV spectra. 2.284
m AU
222nm,4nm (1.00) 65 60 55
A
50 45 40 35 30 25 20 15
1.622
10 5 0 -5 -10 0.0
0.5
1.0
1.5
2.0
2.5
3.0
190
3.5
4.0
4.5
5.0
5.5
m in
Buchi N. Nalluri et al J. Chem. Pharm. Res., 2013, 5(8): 188-194 ______________________________________________________________________________ m AU Purity Curve 0.002 Zero Line
Peak
m AU
0.001
0.350
Purity Curve Zero Line
Peak
175.0 0.001
0.325
0.001
0.300
7.0 6.5 6.0
150.0
0.001
5.5
0.275
0.001
B (GFN)
0.001
125.0
0.250
5.0
B (PHY)
0.225
4.5
0.001 100.0
0.001
0.200
4.0
0.175
3.5
0.001 75.0
0.001
0.150
3.0
0.125
0.000 50.0
0.000
2.5
0.100 2.0 0.075
0.000 25.0
0.000
1.5 0.050 1.0
0.000
0.025 0.0 2.200
2.225
2.250
2.275
2.300
2.325
2.350
2.375
2.400
2.425
2.450
2.475
min
0.5
0.000
0.0 1.525
1.550
1.575
1.600
1.625
1.650
1.675
1.700
1.725
1.750
1.775
1.800
1.825 min
mAU m AU
20.0 1.62/ 1.00
700 2.31/ 1.00 650
17.5 600 550
C (GFN)
500
C (PHY)
15.0
12.5
450 400
300
7.5
214
10.0
350
200
223
250
5.0
2.5
273
100
273
150
323
50 0
0.0
-50 200.0
225.0
250.0
275.0
300.0
325.0
350.0
375.0
nm
200.0
225.0
250.0
275.0
300.0
325.0
350.0
375.0
nm
Fig 1: A - Chromatogram of PHY (2µg/mL) and GFN (30µg/mL) mixture; B - Peak purity index of GFN and PHY and C - UV spectrum of GFN and PHY
Method validation The method has been validated as per ICH-Guidelines for following parameters. Linearity The range of reliable quantification was set at the concentrations of 1-5µg/mL of PHY and 15-75µg/mL of GFN. This range was selected based on 80-120% of the standard concentration used for accuracy and were analyzed in triplicate. Peak areas and concentrations were subjected to least square regression analysis to calculate regression equation. The correlation coefficient (R) was found to be 0.998 for PHY and 0.997 for GFN indicating a linear response over the range used. The data from the calibration curve was given in Table-1. Precision Precision studies were carried out in terms of repeatability. Repeatability of standard application was assessed by using six replicates of concentration at 2µg/mL of PHY and 30µg/mL of GFN and the data was given in Table-1. The % RSD was found to be below 2 for peak areas, this shows the closeness of the data values to each other, indicating the precision of the method. Accuracy Accuracy of the proposed method was ascertained by performing recovery studies by standard addition method by spiking the known quantities of standard at 80%, 100%, 120% to the drug product solution of 2µg/mL of PHY and 30µg/mL of GFN and these solutions were analyzed in triplicate in each level of addition. The %RSD and the %Recovery were within the acceptable limit in all cases. It is evident from the results of accuracy study given in Table-1, that the proposed method enables very accurate for quantitative estimation of PHY and GFN. Specificity The specificity of the method was established by injecting the solutions of diluent, placebo, standard, sample (Formulation) individually to examine any interference, from the overlay of chromatograms as shown in (Figure-2) and from the 3D plots of placebo and formulation, it can be inferred that there were no co-eluting peaks at the retention time of PHY and GFN, which shows that peak of analyte was pure and the excipients in the formulation did not interfere with the analysis and the peak purity indices for sample and standard was found to be greater than 0.999 and this confirms specificity of the method.
191
Buchi N. Nalluri et al J. Chem. Pharm. Res., 2013, 5(8): 188-194 ______________________________________________________________________________ Table-1: Linearity, Precision and Accuracy data of PHY and GFN Validation data of PHY and GFN Parameters Linearity(n=3)
Range Regression equation Regression coefficient (R2) Correlation coefficient (R)
Accuracy(n=3)
%Level of Addition 80 100 120
Precision(n=6) System Precision Method Precision Assay in mg (n=3)
Average Peak area of the standard sample (RSD) Average peak area of the Assay sample (RSD) Mean ± SD
PHY 1-5µg/mL Y=11240x-92214 0.997 0.998 Mean Recovery (RSD) 101.26 (0.11) 101.48 (0.85) 100.01 (0.01) PHY 12271.4 (0.91) 13570.93 (1.57) 39.89 (0.63)
GFN 15-75µg/mL Y=21555x-11017 0.998 0.999 Mean Recovery (RSD) 98.06 (0.11) 102.06 (0.85) 101.80 (0.01) GFN 535873.7 (0.25) 476618.7 (0.03) 611.46 (0.81)
uV 70000
60000
50000
40000
30000
A 20000
B
10000
C
0
D
0.0
0.5
1.0
1.5
2.0
2.5
3.0
3.5
4.0
4.5
5.0
5.5
6.0
min
Fig. 2: Overlay of the Diluent (A), Placebo (B), Standard (C) and Sample (D) chromatograms
Limit of Detection (LOD) and Limit of Quantification (LOQ) LOD and LOQ were determined based on statistical calculation from the calibration curves, where LOD = (3.3 ×σ)/m; LOQ= (10.0×σ)/m (σ is the standard deviation of the y-intercepts of the three regression lines and m is mean of the slopes of the three calibration curves).The limit of detection for PHY was found to be 0.11µg/mL and 0.08µg/mL for GFN, the drug peak could be detected without any base line disturbances at this concentration. The limit of quantification for PHY was found to be 0.34 µg/mL and 0.26µg/mL for GFN. Robustness As part of the robustness, a deliberate change in the flow rate, mobile phase and wavelength was made to evaluate the impact on the method. Retention times were significantly changed with flow rate and mobile phase variation and no change in the retention time was observed in wavelength change and the results were given in Table-2. The parameters like retention time, tailing factor and theoretical plate number were not changed and were within the limits. These results indicated that the method is robust in terms of changed flow rate, mobile phase and wavelength. System suitability System suitability testing is an integral part of the analytical procedure. System suitability studies were carried out by injecting five times a solution of 2µg/mL of PHY and 30µg/mL of GFN standard concentration at different injection volumes ranging from 5µL to 25µL. The RSD values for system suitability test parameters like retention time [PHY -Rt = 1.622 (0.439), tailing factor, Tf= 1.4023 (1.10) and theoretical plate number, 3138 (1.82)] [GFN -Rt = 2.293 (0.583), tailing factor, Tf = 1.6458 (1.26) and theoretical plate number, 75592.2(0.122)] were less than 2% indicating the present conditions were suitable for the analysis of PHY and GFN in tablets.
192
Buchi N. Nalluri et al J. Chem. Pharm. Res., 2013, 5(8): 188-194 ______________________________________________________________________________ Assay Assay of tablets containing 40mg of PHY and 600mg of GFN was performed by the proposed method and the % assay was reported in Table 1. These results indicate that the present HPLC method can be successfully used for the assay of PHY and GFN in bulk drug and pharmaceutical dosage forms. Table-2: Robustness data of PHY and GFN
Drug
Composition
PHY
78-22 80-20 82-18 78-22 80-20 82-18
GFN
PHY
GFN
PHY
GFN
220 222 224 220 222 224 0.9 1.0 1.1 0.9 1.0 1.1
% Mobile phase composition Retention time Theoretical plates (N) (min) 1.58 3724 1.62 4418 1.67 5776 2.02 70030 2.28 70179 2.63 72432 Wavelength (nm) 1.62 3503 1.62 3418 1.62 3418 2.28 70181 2.28 70179 2.28 70179 Flow rate (mL/min) 1.79 3503 1.62 3218 1.48 3108 2.52 71706 2.28 66984 2.11 55687
Tailing factor
% Assay
1.30 1.33 1.40 1.49 1.58 1.62
98.7 99.7 98.5 101.1 101.9 101.5
1.33 1.33 1.33 1.58 1.58 1.58
99.4 99.7 99.8 101.6 101.9 101.7
1.36 1.33 1.50 1.50 1.58 1.59
99.4 99.7 100.4 100.6 101.9 101.4
Stability of the stock solution The stability of the stock solution was determined by analyzing the samples under refrigeration (8±1oC) at different time intervals up to 48hrs. The % variation in assay values at different time intervals were found to be less than 2 of the initial zero time interval solution, thus indicating that the solutions were stable for a period of 48hrs when stored at 8±1oC. CONCLUSION In this work, a simple and efficient RP-HPLC-PDA method was developed for the analysis of PHY and GFN in bulk drug and pharmaceutical dosage forms of PHY- GFN tablets. The method was validated fully as per International Conference on Harmonisation (ICH) Guidelines, and found to be applicable for routine quality control analysis for the estimation of PHY-GFY tablets using isocratic binary mode of elution. The results of linearity, precision, accuracy and specificity, proved to be within the limits. The method provides selective quantification of PHY-GFN without interference from diluents and placebo. Therefore, this method can be employed in quality control to estimate the amount of PHY- GFN in bulk drug and pharmaceutical dosage forms. Acknowledgements The authors are thankful to Hetero Drugs Ltd, India for providing gift sample and also to the Siddhartha Academy of General and Technical Education, Vijayawada, for providing necessary facilities to carry out the research work. REFERENCES [1] Maryadele, JO Neil; The Merck Index, 13th edition, Merck Research Lab publishers, White House Station. NJ. USA, 2001; 7370, 4571. [2] Sweetman; Martindale-The Complete Drug Reference, 33rd edition, Pharmaceutical press, The Royal Pharmaceutical Society, London, 2005; 1097, 1092. [3] WS Gary; EH David. J. Pharm Sci., 1983, 72(1), 55–59. [4] SM Amer; SS Abbas; MA Shehata; M Nahed. J. AOAC Int., 2008, 91(2), 276-284. [5] WS Gary; OS Warren; SL Gwen; GN Daniel. J. Pharm Sci., 1984, 73(12), 1856-1858. [6] D Nidhi; S Sandeep; GN Singh. Indian Journal of Chem., 2012, 51(B), 1633-1636. [7] R Hanimi; M Ravi Kumar; RU Seni; RG Harikishan; K Chandramohanrao; RP Viswanath. J Pharm Res., 2011, 4, 4117-4122. [8] V Galli; C Barbas. J. Chromatogr. A., 2004, 1048(2), 207-211. [9] V Das Gupta; P Jagdish. Drug Dev. Ind. Pharm., 1987, 13(3), 473-486.
193
Buchi N. Nalluri et al J. Chem. Pharm. Res., 2013, 5(8): 188-194 ______________________________________________________________________________ [10] H Rouhollah. Anal. Lett., 2008, 41(6), 965-976. [11] A Porel; A Sanjukta; M Kundar. Ind J Pharm Sci., 2011, 73, 46-56. [12] M Abdelkawy; F Metwaly; N ElRaghy; M Hegazy; N Fayek. J. Chromatograph. Seperat. Techniq., 2011, 2, 112. [13] G Suneetha; P Venkateswarlu; SS Prasad. Der PharmaChemica., 2012, 4(3), 1019-1025. [14] KM Patil; K Bhoir; M Sudarsan. Indian J Pharm Sci., 1998, 60, 407-409.
194