Available online www.jocpr.com
Journal of Chemical and Pharmaceutical Research, 2014, 6(4):1126-1134
Research Article
ISSN : 0975-7384 CODEN(USA) : JCPRC5
Study on effect of variation of NCO/OH molar ratio and PU/CDM weight ratio on thermal stability of IPNs derived from linseed oil based MEP-TDI-cardanol based DM of 2-chloroaniline S. Mohapatra1, N. Mohanty2, J. R. Satapathy1, B. N. Guru2 and N. C. Pal* 1
Laboratory of Polymers and Fibers, P.G. Department of Chemistry, Ravenshaw University, Cuttack, Odisha, India 2 Department of Chemistry, Ajay Binay Institute of Technology, Sector-I, CDA, Cuttack, Odisha, India * Department of Chemistry, Shailabala Women’s, College, Cuttack, Odisha, India _________________________________________________________________________________________________ ABSTRACT Interpenetrating polymer networks were prepared from glycerol modified linseed oil, toluene-2,4-diisocyanate and cardanol based dye monomer with 2-chloroaniline. The expected course of reaction and structural analysis of such polymers were investigated by FTIR spectroscopy. Thermal stability along with exothermic and endothermic behavior of the polymer degradation was studied by thermogravimetric analysis (TGA), derivative thermogravimetry (DTG) and differential thermal analysis (DTA). The isothermal Freeman-Anderson method was used to calculate the order of the reaction (n) and activation energy (Ea) of the degradation process. The effect of variation of NCO/OH molar ratio and PU/CDM weight ratio on the thermal stability was studied. Keywords: Mixed ester polyol; cardanol based dye monomers; polyurethanes; interpenetrating polymer networks. _________________________________________________________________________________________________ INTRODUCTION Polymeric products, the demand of which as it is experienced has been increasing day by day, prepared by using petrochemical raw materials may face problems to be adequately available in a competitive market from commercial point of view as the cost of production of these polymeric products is increasing due to less supply of petroleum which is caused by the depletion of petroleum stock. So, much stress has been imposed on synthesizing new monomers from agro-based renewable resources for the production of cost effective Interpenetrating Polymer Networks. The work with interpenetrating polymer networks from renewable resources was initiated by Sperling and co-workers [1-6]. A large number of articles have been published in this field relating to the work with the bio-monomers derived from cardanol, a component obtained from the cashew nut shell liquid (CNSL). This work involves the linseed oil (local name Alasi Tela) which is obtained from the Koraput District of Odisha, India. Linseed oil was modified with glycerol and the mixed ester polyol (MEP) so obtained was allowed to react with toluene diisocyanate in different NCO/OH molar ratios to give a series of polyurethanes (PUs). Cardanol obtained from the cashew nut shell liquid was allowed for diazoreaction with 2-choloaniline to convert it into a number of new dye monomers (CDMs) [7-8]. The glycerol modified linseed oil polyurethanes were allowed to react with these dye monomers in different weight ratios in presence of Benzoyl Peroxide (BPO) which acts as initiator and ethylene glycol dimethacrylate (EGDM) as cross-linker to give a number of interpenetrating polymer networks (IPNs). The IPNs have been characterized by Fourier Transform Infrared Spectra and thermal analysis techniques like Thermogravimetric Analysis (TGA), Derivative Thermogravimetry (DTG) and Differential Thermal Analysis
1126
N. C. Pal et al J. Chem. Pharm. Res., 2014, 6(4):1126-1134 _____________________________________________________________________________ (DTA). The kinetic parameters such as order of reaction and activation energy were calculated by using the Freeman - Anderson method. EXPERIMENTAL SECTION Preparation of Cardanol Cashew nut shell liquid (300 mL) was taken in a round bottomed flask fitted with a condenser and thermometer. The oil was vacuum distilled in the temperature range of 230oC - 240oC and 3-4 mm Hg pressure. The condenser was cooled by circulating cold water. Anacardic acid (2-carboxylic-3-pentadecadienyl phenol) is decarboxylated to cardanol [9]. Preparation of Cardanol Based Dye Monomer (CDM) 6.37 g (0.05 mol) of 2-chloroaniline was dissolved in 13 mL of conc. hydrochloric acid and 10 mL of water. The solution was cooled to 0-5 oC. An ice cold aqueous solution of sodium nitrite of about (0.05 mol) 3.45 g in 72 mL of water was slowly added to it with constant stirring for 3-4 min until a positive test for nitrous acid was obtained. An ice cold alkaline solution of 15 g (0.05 mol) of cardanol in 40 mL of 5% (w/v) NaOH solution was prepared. The ice cold diazonium salt solution was immediately added slowly with constant stirring to the cold alkaline cardanol solution. A brilliant red colored azo dye (CDM) was obtained [10]. Preparation of Mixed Ester Polyol (MEP) About 500 mL of linseed oil was taken in a 3-necked flask fitted with a thermometer, reflux condenser and mechanical stirrer. The oil was heated to 250-260OC in an inert nitrogen atmosphere. As the required temperature was attained, 0.1575 g of PbO i.e 0.05% litharge (oil basis) as catalyst and 80 mL of (1.5 times stoichiometric quantity) of glycerol were added to the hot oil with constant stirring. The temperature was maintained at 210O C until one volume of reaction mixture gave a clear solution in one volume of methanol. The reaction mixture was cooled and excess of glycerol was removed by thoroughly washing with 20% of acetone solution to obtain mixed ester polyol. Then it was dried under vacuum at 80OC for 6 h. Synthesis of Linseed Oil Based Polyurethanes (PUs) 0.354 g of mixed ester polyol was allowed to react with 0.208 g of toluene diisocyanate (TDI) to maintain the NCO/OH molar ratio at 1.2. The reaction was carried out in a small beaker at about 45OC in methyl ethyl ketone (MEK) with constant stirring for 45 min until a viscous prepolymer of pale yellow color polyurethane separated out. In a similar way by taking 0.354 g of mixed ester polyol was allowed to react with 0.278 g of toluene diisocyanate to maintain NCO/OH molar ratio at 1.6. Synthesis of Interpenetrating Polymer Networks (IPNs) The polyurethane (PU) and cardanol based dye monomer (CDM) in different weight to weight ratios (35:65, 50:50) were separately taken in methyl ethyl ketone (MEK) in a reaction vessel in presence of the initiator (BPO) and the crosslinker (EGDM). The mixture was constantly stirred at room temperature by means of a magnetic stirrer for 15 min to get a homogeneous solution. Thereafter, the temperature was increased to 75OC with constant stirring for about 1 h to get a viscous mass which was poured into a glass mould and kept in an oven at 75 OC for 24 h. The thin film thus formed was cooled and removed from the mould and labeled for characterization. The feed composition data of IPNs are furnished in Table 1. Table 1 Feed Composition Data of IPNs Sample code IPN-1 IPN-2 IPN-3
Composition MEP+ TDI + CDM of 2-chloroaniline MEP + TDI + CDM of 2-chloroaniline MEP + TDI + CDM of 2-chloroaniline
NCO/OH molar ratio 1.2 1.6 1.6
PU/CDM wt ratio 35:65 50:50 35:65
The probable schemes of reaction involved in the synthesis of interpenetrating polymer networks are given in Schemes 1 and 2.
1127
N. C. Pal et al J. Chem. Pharm. Res., 2014, 6(4):1126-1134 _____________________________________________________________________________ O H2C
CH
O
C C17H33(oleic)
O
CH2
C
CH
OH
CH2
OH
+2
C17H31(linoleic)
O H2C
O
OH
O
C C17H29(linolenic)
Triglyceride of linolenic (53%), oleic (18%) and linoleic acid (15%)
Litharge (PbO) (2100C, 1 h stirring)
CH2
OH
O
CH
O
C
CH2
OH
TDI R
MEK, 45OC, 45 min Stirring
PU
Mixed Ester Polyol(MEP)
Scheme 1
O H2 C
O
C
NH
(PU unit)
PU O
CDM (Dye Monomer) MEK,BPO,EGDM 75OC(1 h stirring)
CH
O
C
(CH2)7
CH
CH
CH
CH2
CH
(CH2)4
O H2C
O
C
NH
(PU unit)
O O
H2 C
C
C
CH2
CH3 CH3
OH H2C
O
C
C
CH2
CH
CH
O C H2
N
HC
HC
H2 C
CH2
CH
CH
(CH2)5 CH3
Dye Monomer Unit
N Cl
IPN of Cardanol based dye with 2-chloroaniline and Polyurethane of modified Linseed Oil with TDI
Scheme 2 : Expected Structure of IPN
RESULTS AND DISCUSSION FTIR Spectra The FT-IR spectra of the interpenetrating polymer networks were obtained using a Perkin Elmer FT-IR Spectrophotometer, model paragon 1000. A small amount of the finely powdered sample was mixed with about 100
1128
N. C. Pal et al J. Chem. Pharm. Res., 2014, 6(4):1126-1134 _____________________________________________________________________________ times its weight of powdered potassium bromide (KBr) and pressed into a small disc of about 1mm thick. Elmer FTIR spectra were analyzed by studying the intensity of the absorbance peaks and comparing with the control spectra. FT-IR spectra of the IPNs are given in Figures 1-3. The presence of component materials in the macromolecules was confirmed by the study of FT-IR spectra of the prepared samples. The characteristic absorptions of IPN-1 corresponding to N-H stretching of >NH group at 3285.65 cm-1, C-H stretchings (ss/as) of >CH2 and -CH3 groups at 2854.00 cm-1 and 2923.9 cm-1, N≡C stretching of –N=C=O group for the isocyanate terminating PU unit at 2361.54 cm-1, C=O stretching of urethane linkage at 1720.28 cm-1, N=N stretching of azo group at 1591.81 cm-1, O-H bending of –OH group at 1373.15 cm-1, C-O bending at 1222.91 cm-1, out of plane C-H bending at 818.38 cm-1 and out of plane O-H bending at 755.71 cm-1 were observed (Figure 1).
Figure 1 FTIR of IPN-1
The characteristic absorptions of IPN-2 corresponding to N-H stretching of >NH group at 3293.36 cm-1, C-H stretchings (ss/as) of >CH2 and -CH3 groups at 2862.74 cm-1 and 2967.52 cm-1, N≡C stretching of –N=C=O group for the isocyanate terminating PU unit at 2362.05 cm-1, C=O stretching of urethane linkage at 1725.72 cm-1, N=N stretching of azo group at 1597.69 cm-1, O-H bending of –OH group at 1372.44 cm-1, C-O bending at 1224.81 cm-1, out of plane C-H bending at 812.62 cm-1 and out of plane O-H bending at 760.60 cm-1 were observed (Figure 2).
Figure 2: FTIR of IPN-2
The characteristic absorptions of IPN-3 corresponding to >N-H stretching of =NH group at 3306.42 cm-1, C-H stretchings (ss/as) of >CH2 and -CH3 groups at 2855.81 cm-1 and 2924.51 cm-1, N≡C stretching of –N=C=O group for the isocyanate terminating PU unit at 2361.71 cm-1, C=O stretching of urethane linkage at 1723.59 cm-1, N=N stretching of azo group at 1593.53 cm-1, O-H bending of –OH group at 1372.50 cm-1, C-O bending at 1223.72 cm-1, out of plane C-H bending at 816.91 cm-1, out of plane O-H bending at 754.40 cm-1 were observed (Figure 3).
1129
N. C. Pal et al J. Chem. Pharm. Res., 2014, 6(4):1126-1134 _____________________________________________________________________________
Figure 3: FTIR of IPN-3
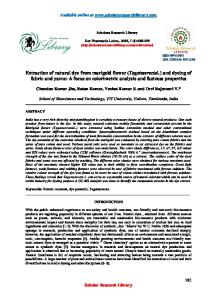
Thermal Analysis TGA, DTG and DTA measurements were carried out by a Perkin Elmer thermal Analyzer model PYRIS Diamond USA. First 5.511 mg of IPN-1 with 5.0 mg of alumina as reference material was scanned between 50 OC and 650 OC at a heating rate of 10 OC / min in an inert nitrogen atmosphere (N2 100 mL/min) (Figure 4). In a similar way IPN-2 and IPN-3 were scanned for thermogravimetric analysis (TGA), derivative thermogravimetry (DTG) and differential thermal analysis DTA (Figures 5, 6). TG Analysis The thermogravimetric analysis of IPN-1, IPN-2 and IPN-3 was carried out at a heating rate of 10oC/min in the nitrogen atmosphere. The samples have been analyzed with respect to the following variations taking into consideration. a. NCO/OH molar ratio
b. PU/CDM weight ratio
The Table 2 exhibits the percent of the mass loss of the IPN-1, IPN-2 and IPN-3 at various temperatures calculated from the TG curves (Figures 4-6). It is generally observed that the thermal decomposition of the tested samples is a three step process. All the IPNs under present study are thermally stable upto 100OC with 0.39% (IPN-1), 0.24% (IPN-2) and 0.57% (IPN-3) of weight losses due to loss of moisture retained in the samples. a. In the temperature range of 100 OC - 200 OC only 3.35% (IPN-1), 2.67% (IPN-2) and 4.14 % (IPN-3) of weight losses were observed due to evaporation of solvent molecules, elimination of smaller groups and other volatile materials, if any. b. Significant weight losses of about 42.37% (IPN-1), 42.63% (IPN-2) and 33.90% (IPN-3) were indicated in the temperature range of 300 OC - 500 OC which may be attributed to the decomposition of benzene ring as already known that the scission of main bonds in benzene occurs in the range of 400 OC to 450 OC along with main functional groups such as -OH, >NH and >C=O etc and also due to partial decomposition of crosslinkings with EGDM between PU and CDM units. c. Finally, weight losses of 25.52%, 23.49% and 19.16% for IPN-1, IPN-2 and IPN-3 respectively in the temperature range of 400OC - 600OC were observed which is due to the complete decomposition of crosslinkings with EGDM between PU unit and CDM unit leading to separation of two monomer units. Comparing the thermal stability of IPN-1 with that of IPN-3 (Table 2) it is observed that IPN-1 is thermally more stable than IPN-3 upto 400OC or something more at which major decomposition takes place. The enhanced thermal stability of IPN-1 having the same PU/CDM weight ratio as that of IPN-3 but with the smaller value of NCO/OH molar ratio is due to the increase in oil component of the PU unit in the IPN-1 leading to the greater degree of crosslinkings. Comparing the thermal stability of IPN-2 with that of IPN-3, it is observed that IPN-2 is thermally more stable than IPN-3 upto 400OC or something more at which major decomposition takes place. The enhanced thermal stability of
1130
N. C. Pal et al J. Chem. Pharm. Res., 2014, 6(4):1126-1134 _____________________________________________________________________________ IPN-2 having the same NCO/OH molar ratio as that of IPN-3 but with greater value of PU/CDM weight ratio is due to the increased amount of the PU content in the IPN leading to the greater degree of crosslinkings in the IPN-2. Table 2 Percentage of Mass Loss of IPNs at Various Temperatures (OC) Samples / Temp(OC) IPN-1 IPN-2 IPN-3
100 0.39 0.24 0.57
200 3.35 2.67 0.14
300 42.23 37.79 45.07
400 61.68 59.17 62.33
Figure 4 : TGA/DTG/DTA of IPN-1
Figure 5: TGA/DTG/DTA of IPN-2
1131
500 84.60 80.42 78.97
600 87.20 82.66 81.49
N. C. Pal et al J. Chem. Pharm. Res., 2014, 6(4):1126-1134 _____________________________________________________________________________
Figure 6 : TGA/DTG/DTA of IPN-3
Comparing the thermal stability of IPN-1 with that of IPN-3 it is observed that IPN-1 is thermally more stable than IPN-3 upto 400 OC and thereafter there is no noticeable change in the percentage of thermal decomposition of the above two IPNs. The enhanced thermal stability of IPN-1 having the same PU/CDM weight ratio as that of IPN-3 but with the smaller value of NCO/OH molar ratio is due to the increase in oil content of the PU unit in the IPN-1. Comparing of thermal stability of IPN-2 with that of IPN-3, it is observed that IPN-2 is thermally more stable than IPN-3 upto 400 OC and thereafter there is no noticeable change in the percentage of thermal decomposition of the above two IPNs. The enhanced thermal stability of IPN-2 having the same NCO/OH molar ratio as that of IPN-3 but with greater value of PU/CDM weight ratio is due to the increased amount of the PU content leading to increased crosslinkings in the IPN-2. DTG Study The DTG curves (Figures 4-6) show the rate of thermal decomposition in µg / min. The Table-3 shows the peak data of the thermograms of the IPNs. a. The DTG curve for IPN-1 shows 2 peaks at 276.33OC and 446.01 OC corresponding to the maximum decomposition rates of 394.04 µg/min and 204.19 µg/min respectively. b. The DTG curve for IPN-2 shows 3 peaks at 279.37 OC, 374.81 OC and 446.96 OC corresponding to the maximum decomposition rates of 341.11 µg/min, 119.01 µg/min and 197.12µg/min respectively. c. The DTG curve for IPN-3 shows 2 peaks at 270.25 OC and 444.28 OC corresponding to the maximum decomposition rates 406.05 µg/min and 147.02µg/min respectively. It is observed that the IPN-1 and IPN-3 undergo two step thermal degradation whereas the IPN-2 undergoes a three step thermal degradation with respect to rate of decomposition. Table 3 DTG Data of the IPNs Sample code
NCO/OH molar ratio
PU/CDM weight ratio
IPN-1
1.2
35:65
IPN-2
1.6
50:50
IPN-3
1.6
35:65
Temperature range(OC)
Peaks (µg/min)
Temp(OC)
200-400 400-600 200-400
394.04 204.19 341.11 119.01 197.12 406.05 147.02
276.33 446.01 279.37 374.81 446/96 270.25 444.28
400-600 200-400 400-600
DTA Study The differential thermal analysis (Figures 4-6) was performed to give information regarding the exothermic and endothermic behavior of the reactions associated with the thermal decomposition of the IPNs. The DTA data of the IPNs are given in Table-4.
1132
N. C. Pal et al J. Chem. Pharm. Res., 2014, 6(4):1126-1134 _____________________________________________________________________________ Table 4 DTA Data of the IPNs Sample code
NCO/OH molar ratio
PU/CDM weight ratio
IPN-1
1.2
35:65
IPN-2
1.6
50:50
IPN-3
1.6
35:65
Temperature range(OC) 200-400 400-600 200-400 400-600 200-400 400-600
DTA Peak (OC) Exo Endo 254.71 284.71 554.71 454.18 242.20 285.19 574.30 455.12 247.60 266.60 274.90 283.40 306.50 484.50 553.30
% Decomposition 58.33 25.52 56.50 23.49 61.19 19.16
Calculation of Kinetic Parameters The kinetic parameters of thermal decomposition process such as energy of activation (Ea) and order of reaction (n) in the temperature ranges of from 200OC to 300 OC and from 300 OC to 450OC were calculated from the thermograms by the Freeman -Anderson method (Figures7-8). The equation used for Freeman -Anderson method is where -dw/dt is the rate of decomposition (calculated from DTG measurements), is the residual mass (calculated from TG measurements) at constant difference in 1/T –3 (0.1x 10 ), ‘n’ is the order of reaction and Ea is the energy of activation. The order of a thermal degradation process of an interpenetrating polymer network gives an indication of the complexity of the degradation process. The activation energy of the thermal degradation process of an interpenetrating polymer network gives an indication of rate of thermal degradation process. The higher is the activation energy, the slower is the rate of thermal degradation process and the higher is the stability of the IPN. The kinetic parameters of the IPN-1, IPN-2 and IPN-3 given in the Table-5 are almost in agreement with experimental thermal data (Table-2). Table 5 Kinetic Parameters of the Thermal Decomposition of Interpenetrating Polymer Networks Sample code IPN-1 IPN-2 IPN-3
Temperature range ( OC) 200-300 300-450 200-300 300-450 200-300 300-450
Ea/ kJ 77.93 42.70 73.91 74.48 24.13 43.27
n 2.78 5.15 2.44 5.66 1.52 3.41
Figure 7: Freeman-Anderson plots for 200-3000C
1133
N. C. Pal et al J. Chem. Pharm. Res., 2014, 6(4):1126-1134 _____________________________________________________________________________
Figure 8: Freeman-Anderson plots for 300-4500C
CONCLUSION Nowadays, there is a growing interest to produce agricultural waste and natural oil based biopolymers, particularly after the shortage of petroleum based monomers. These polymers have many advantages compared with polymers prepared from petroleum based monomers and in many cases are cheaper than petroleum polymers. The present study is aimed at synthesizing cost effective, eco-friendly and highly crosslinked polymers with enhanced thermal property from agro-based renewable resources for various sustainable industrial applications. Acknowledgements The authors are thankful to the Ravenshaw University, Cuttack, Odisha and the Central Research Facility, IIT Kharagpur, India for providing facilities for synthesis and characterization of the samples. REFERENCES [1] L.H Sperling; Advances in Interpenetrating Polymer Networks (Lancaster: Technomic), 1981, 2, 284. [2] L.H Sperling; J. A. Manson, J. Am. Oil Chem. Soc. 1983, 60( 11), 1887-1892. [3] L. W. Barrett; L. H. Sperling, Polymer Engineering&Science,1993,33, 913–922,. doi: 10.1002/pen.760331408 [4] L. W Barrett; O. L. Shaffer; L. H. Sperling;. Appl. Polym. Sci. ,1993 ,48, 953–968. [5] D. G. Fradkin; J. N. Foster; L. H. Sperling; D. A. Thomas, Polymer Engineering & Science, 1986, 26,730–735. doi: 10.1002/pen.760261104. [6] G. M. Yenwo; J. A. Manson; J Pulido; L. H. Sperling; A. Conde; N Devia, J. Appl. Polym. Sci.,1977, 21, 1531– 1541. [7] D Praharaj; N.C Pal.; S Patra; S Lenka., Int J Plast Technol . 2004, 8, 172–179. [8] S. Biswal; P.G.R. Achary; N. Mohanty; N.C. Pal; Int. J. Plast. Technol., 2011, 15, 52-67. [10] P.P Kumar; R. Paramashivappa; P. J Vithayathil; P. V. Subba Rao; A.S. Rao; J. Agric. Food Chem., 2002, 50 (16), 4705–4708. [11] S Suwanprasop; T. Nhujak; S. Roengsumran; A. Petsom; Ind. Eng. Chem. Res. 2004, 43 (17), 4973–4978.
1134