Cyber Journals: Multidisciplinary Journals in Science and Technology, Journal of Selected Areas in Bioengineering (JSAB), September Edition, 2011
An Experimental Investigation of the Mechanical Properties of Bamboo and Cane Cyril Okhio Ph.D., C.Eng.; Jeroen Waning, B.Sc.; Yemeserach T. Mekonnen, B.Sc. Abstract – Bamboo and cane remain very valuable natural resources to mankind and are still used today for a multitude of engineering projects. Today the world seeks new and innovative methods for saving resources, and the abundant bamboo and cane have great merit for many possible uses. They include but are not limited to: scaffolding, wood flooring, fencing, bicycles, building construction, furniture fabrication etc. Renewable, natural resources, such as bamboo and cane, will rapidly become sources for inexpensive building materials in an increasingly eco-conscious world. The potential for bamboo and cane is extensive and requires proper testing to substantiate their utilization in other applications. The lack of standards and understanding of the mechanical properties of bamboo and cane has led to the following investigation. Many of the reported mechanical properties of bamboo and cane were derived from extensive sampling and analysis procedures. These properties are represented as the average mechanical properties of the selected species. Test results such as tension parallel to the grain are based on a more limited number of specimens that were not subjected to the same sampling and analysis procedures. The appropriateness of these results to represent the
average properties of bamboo and cane species is uncertain; nevertheless, these results currently represent the best reported test information. The presented mechanical properties of bamboo and cane were obtained from tests of small pieces defined as ‘clear’ and ‘uniform grained’. They were produced from pieces that contained no obvious flaws such as knots, splits, checks, and cross-grains. The test pieces did have anatomical characteristics such as fine glossy skin lines, growth rings, and hollows occurring consistently in each specimen. These specimens will be characterized as ‘homogeneous’ for the purposes of the reported test results. Variations in mechanical properties between samples are common to all materials because of unique external influences on their lattice structures. Because bamboo and cane are biological materials, and are subject to numerous constant variables such as moisture content, soil conditions, weather conditions, and growing space, it is conceivable that bamboo and cane properties may vary considerably, even in clear, standardized specimens. This research aims to provide documented information on the nature and magnitude of the deviation in the mechanical properties of bamboo and cane specimens. It is hoped that this research will inspire discussion on how these results can be implemented in engineering standards.
INTRODUCTION Orthotropic Nature of Bamboo and Cane Bamboo and cane may be described as orthotropic materials. They have independent mechanical properties in three mutually perpendicular planes: longitudinal, radial, and tangential. The longitudinal axis (L) is parallel to the grain, the radial axis (R) is normal to the growth rings, which are perpendicular to the grain in the radial direction, and the tangential axis (T) is perpendicular to the grain but tangent to the growth rings. These axes are shown in Figure I.
Figure I – Orthotropism Independent elastic properties in three different planes make bamboo and cane orthotropic materials. Elastic Properties of Fibrous Materials To describe the elastic behavior of any material such as bamboo and cane, twelve constants are needed. Nine of these constants are completely independent of the others. The twelve constants consist of three moduli of elasticity (E), three moduli of rigidity (G), 8
and six Poisson’s ratios (µ). The relationship between the moduli of elasticity and Poisson’s ratios may be represented in the form (Green, David. Winandy, Jerrold. Kretschmann, David. 1999):
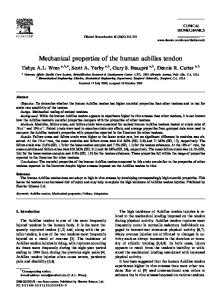
Bending - Test 1 5 Stress (MPa)
��� ��� = ; � ≠ ; �, = , , � − − − − − −(1) �� �� Modulus of Elasticity When a material is subjected to a load not to exceed its proportional limit, all deformations are recoverable. In a stress vs. strain diagram, this region of the curve of the material represents the linear elastic region of the material and Hook’s Law can be applied to calculate the desired modulus of elasticity (E) (see Nomenclature). E=
�� ��
4 3 2 1 0 0
0.02
0.04
0.06
0.08
Strain (mm/mm) Figure III - Bending Test 1 Data Table I - Elasticity for Various Species (Moisture content approximately 12%)
− − − − − − − − − − − − − − − − − (2)
Hardwoods
When the load the material is subjected to exceeds the proportional (or linear elastic) limit, plastic deformation begins to occur and permanent change in the material’s lattice structure results. The three moduli of elasticity are along the longitudinal, radial, and tangential axes of wood. They are denoted by EL, ER, and ET respectively. Average values of ER and ET for samples from a few species are presented in Table I as ratios with EL. The modulus of elasticity (EL) available for a species
Species Ash, white Balsa Basswood Birch, yellow Cherry, Black Cottonwood, eastern Mahogany, African Mahogany, Hondurras Maple, sugar Maple, red Oak, red Oak, white Sweet gum Walnut, black Yellow-poplar
ET/EL 0.08 0.015 0.027 0.05 0.086 0.047 0.05 0.064 0.065 0.067 0.082 0.072 0.05 0.056 0.043
ER/EL 0.125 0.046 0.066 0.078 0.197 0.083 0.111 0.107 0.132 0.14 0.154 0.163 0.115 0.106 0.092
GLR/EL 0.109 0.054 0.056 0.074 0.147 0.076 0.088 0.066 0.111 0.133 0.089 0.086 0.089 0.085 0.075
GLT/EL 0.077 0.037 0.046 0.068 0.097 0.052 0.059 0.086 0.063 0.074 0.081 n/a 0.061 0.062 0.069
GRT/EL n/a 0.005 n/a 0.017 n/a n/a 0.021 0.028 n/a n/a n/a n/a 0.021 0.021 0.011
Species Bald cypress Cedar, northern white Cedar, western red Douglas-fir Fir, subalpine Hemlock, western Larch, western Loblolly (pine) Lodge pole (pine) Longleaf (pine) Pond (pine) Ponderosa (pine) Red (pine) Slash (pine)
ET/EL 0.039 0.081 0.055 0.05 0.039 0.031 0.065 0.078 0.068 0.055 0.041 0.083 0.044 0.045
ER/EL 0.084 0.183 0.081 0.068 0.102 0.058 0.079 0.113 0.102 0.102 0.071 0.122 0.088 0.074
GLR/EL 0.063 0.21 0.087 0.064 0.07 0.038 0.063 0.082 0.049 0.071 0.05 0.138 0.096 0.055
GLT/EL 0.054 0.187 0.086 0.078 0.058 0.032 0.069 0.081 0.046 0.06 0.045 0.115 0.081 0.053
GRT/EL 0.007 0.015 0.005 0.007 0.006 0.003 0.007 0.013 0.005 0.012 0.009 0.017 0.011 0.01
Sugar (pine) Western white (pine) Redwood Spruce, Sitka Spruce, Engelmann
0.067 0.038 0.089 0.043 0.059
0.131 0.078 0.087 0.078 0.128
0.124 0.052 0.066 0.064 0.124
0.113 0.048 0.077 0.061 0.12
0.019 0.005 0.011 0.003 0.01
Softwood
120
Stress (Mpa)
100 σu = 108.31
80 60 40 20 0 0
0.02 0.04 0.06 Strain (mm/mm)
0.08
Figure II – Compression Test 1 Data may have been determined from a bending test rather than from a compression test. The difference in underlying data behind the calculations for EL is visualized in Figure II and Figure III.
This table is a courtesy of Wood Handbook: Wood as an Engineering Material (David et al 1999). Poisson’s Ratio During a compression test, the lateral deformation is proportional to the longitudinal deformation. The ratio of the perpendicular to parallel strain (with respect to the load) is called the Poisson’s ratio (mLR, mRL, mLT, mTL, mRT, and mTR). The letters of 9
the subscripts refer to direction of applied stress and the direction of lateral deformation respectively. Average values of Poisson’s ratios for samples of a few species of wood are given in Table II.
specimen having a ratio of length to least dimension of less than 11 (David et al 1999). Compressive strength perpendicular to grain Reported as stress at proportional limit. There is no clearly defined ultimate stress for this property (David et al 1999). Tensile strength perpendicular to grain – The resistance of wood to forces acting across the grains that tend to split a member. Values presented are the average of radial and tangential observations (David et al 1999). Tensile strength parallel to grain – The maximum tensile stress sustained in direction parallel to grain. Relatively few data are available on the tensile strength of various species of clear wood parallel to grain (David et al 1999). Research Motive Today wood (pine), steel, and concrete serve as the primary building materials for both residential and commercial construction. Bamboo and cane are predominantly used in decorative implementations in Western society, but the Chinese, Japanese, and other East and Southeast Asian countries have benefited from the structural properties of bamboo and cane for millennia. According to the International Network for Bamboo and Rattan (INBAR), over one billion people live in bamboo structures in non-compliance with local building codes. If proper standards are developed and enforced, bamboo and cane structures prove to have many advantages over traditional buildings. East and Southeast Asian countries experience typhoons, monsoons, earthquakes, landslides, tsunamis and other natural disasters frequently, and bamboo homes were evidently safer structures than concrete, steel, and traditional wood structures. This is in part due to the aforementioned and defined material properties where bamboo and cane have out-performed traditional building materials. The new focus in engineering and design is environmentalism and sustainability. Bamboo and cane are natural and highly renewable resources. Bamboo grows very quickly (over a meter per day), taking only 6 years to reach optimum maturity, and it grows in denser groupings than trees, making it abundant, sustainable, and relatively inexpensive. It can also grow in a very wide variety of environments, as long as it’s relatively warm and humid. Knowing how bamboo can be safely implemented in modern construction has the potential to facilitate sustainable building and reduce the carbon footprint of the global population growth. The International Organization for Standardization (ISO) already has three standards in place for the construction of bamboo structures (ISO 22156,
Table II - Poisson’s Ratios for Various Species (Moisture content approximately 12%) Species Ash, white Aspen, quaking Balsa Basswood Birch, yellow Cherry, Black Cottonwood, eastern Mahogany, African Mahogany, Hondurras Maple, sugar Maple, red Oak, red Oak, white Sweet gum Walnut, black Yellow-poplar
Hardwoods μLR μLT 0.371 0.440 0.489 0.374 0.229 0.488 0.364 0.406 0.426 0.451 0.392 0.428 0.344 0.420 0.297 0.641 0.314 0.533 0.424 0.476 0.434 0.509 0.350 0.448 0.369 0.428 0.325 0.403 0.495 0.632 0.318 0.392
μRT 0.684 n/a 0.665 0.912 0.697 0.695 0.975 0.604 0.600 0.774 0.762 0.560 0.618 0.682 0.718 0.703
μTR 0.360 0.496 0.231 0.346 0.426 0.282 0.292 0.264 0.326 0.349 0.354 0.292 0.300 0.309 0.378 0.329
μRL 0.059 0.054 0.018 0.034 0.043 0.086 0.043 0.033 0.033 0.065 0.063 0.064 0.074 0.044 0.052 0.030
μTL 0.051 0.022 0.009 0.022 0.024 0.048 0.018 0.032 0.034 0.037 0.044 0.033 0.036 0.023 0.035 0.019
Species Bald cypress Cedar, northern white Cedar, western red Douglas-fir Fir, subalpine Hemlock, western Larch, western Loblolly (pine) Lodge pole (pine) Longleaf (pine) Pond (pine) Ponderosa (pine) Red (pine) Slash (pine) Sugar (pine) Western white (pine) Redwood Spruce, Sitka Spruce, Engelmann
Softwood μLR μLT 0.338 0.326 0.337 0.340 0.378 0.296 0.292 0.449 0.341 0.332 0.485 0.423 0.355 0.276 0.328 0.292 0.316 0.347 0.332 0.365 0.280 0.364 0.337 0.400 0.347 0.315 0.392 0.444 0.356 0.349 0.329 0.344 0.360 0.346 0.372 0.467 0.422 0.462
μRT 0.411 0.458 0.484 0.390 0.437 0.442 0.389 0.382 0.469 0.384 0.389 0.426 0.408 0.447 0.428 0.410 0.373 0.435 0.530
μTR 0.356 0.345 0.403 0.374 0.336 0.382 0.352 0.362 0.381 0.342 0.320 0.359 0.308 0.387 0.358 0.334 0.400 0.245 0.255
μRL n/a n/a 0.036 n/a n/a n/a n/a n/a n/a n/a n/a n/a n/a n/a n/a n/a n/a 0.040 0.083
μTL n/a n/a n/a 0.029 n/a n/a n/a n/a n/a n/a n/a n/a n/a n/a n/a n/a n/a 0.025 0.058
This table is a courtesy of Wood Handbook: Wood as an Engineering Material (David et al 1999). According to studies by the USDA Forest Service (David et al 1999), values for mLR and mLT are less precisely determined than are those for the other Poisson’s ratios. Poisson’s ratios can vary within and between species and are known to be affected by moisture content and specific gravity. Common Material Strength Properties The following terminology attempts to define the desired mechanical properties of bamboo and cane as to which this research will relate. The range in these properties should be more clearly defined in the near future so that bamboo and cane building materials can adhere to ASTM and/or ISO standards. These properties are well regarded in engineering for classifying materials with respect to structural soundness and load carrying capacity. Compressive strength parallel to grain - Maximum stress sustained by a compression parallel-to-grain
10
2004), with more likely to come in the next few years.
This research aims to contribute in the development of building standards for bamboo and cane. 1.3 Modulus of Elasticity (Ε) ��
•
1. NOMENCLATURE
o
The following is a list of the equations used in the calculations referenced in this report. The notation is clarified following each equation. It should be noted that the engineering stress and strain values were obtained directly from the computer generated report (see §2). The ultimate tensile strength can also be obtained directly from observing the graphs.
o o o
Ε= � Ε or Young’s Modulus = Modulus of elasticity σ = Engineering stress ε = Engineering strain � = Change in…
1.4 Ultimate Strength ! • σu = "#$ ��
1.1 Engineering Stress (σ) � • �=
o o
��
o o o o
σ = Engineering stress F = Average uni-axial tensile force A� = Original cross-sectional area of specimen Measured in Megapascals (MPa) (N/mm2)
o
1.2 Engineering Strain (ε) ℓ�ℓ • �= � ℓ�
o o o
ε = Engineering strain ℓ = Final length of specimen ℓ� = Original length of specimen
2. TESTING EQUIPMENT The Tinius Olsen Universal Testing Machine (serial # 208314) was the main piece of equipment used in collecting measurements and data for these experiments in testing the mechanical properties of bamboo and cane. The Tinius Olsen Universal Testing Machine’s force transducer relayed real-time data to a handheld computer for manual recording and was also connected to a computer for computergenerated graphs.
%�& = Ultimate Tensile Strength '()* = Maximum load carried by specimen +� = Original cross-sectional area of specimen
Sample
Outer Diameter (cm)
Inner Diameter (cm)
Load Speed (cm/min)
1
1.8669
1.40716
0.254
2
1.8288
1.39446
0.127
3
1.89484
1.44526
0.0635
4
1.85928
1.39192
0.0635
5
1.7399
1.31064
0.1016
6
1.87452
1.45034
0.0508
7
1.77292
1.36652
0.127
8
1.82372
1.3716
0.0762
9
1.9431
1.42748
0.0508
testing. Finally, a modified three-point bending fixture was used to carry out the bending tests. Due to the fact that the two lower anvils of the fixture were not of the same height, a standard vise grip was used as a replacement. Furthermore, it must be noted that the upper anvil of this fixture was partially inoperable; a piece was missing which caused substandard performance. The approach was modified to avoid erroneous results. The procedural modifications are discussed in §3. Before every official test, an unrecorded test was done on some samples that would otherwise be discarded. This was done to ensure the equipment was properly assembled and functional.
In addition to the Tinius Olsen testing machine, several other pieces of equipment were used to carry out the testing. Some examples of the other pieces of equipment include two sets of slip clamps, or chucks, and shims, which were used to conduct the tensile testing. A compressive sub-press device, (serial # PS2-1052) was used in conjunction with the testing machine, to test the cane specimens for compression
3. TESTING PROCEDURES Several material samples were extracted from a single culm (or stalk) of both cane and bamboo. The nine cane specimens acquired for compression testing were each cut to a length of approximately 2.54 cm,
while the two bending test samples, also cane, were cut to approximately 10.16 cm in length. The tensile specimen was extracted from a single section of bamboo. It was cut into a long strip by taking a 11
section approximately 30.48 cm in length and making a lateral cut along the plant’s longitudinal axis. While preparing this bamboo sample, the width was minimized in order to reduce geometrical impact of the natural radius of curvature of the strip. 3.1 Compression
Figure V – Bending Test Configuration
The first set of tests conducted involved compressive axial loading, in which nine specimens were stressed
Due to certain non-critical, faulty bending test equipment, an unknown amount of force had to be applied to the specimen prior to the actual starting of the test. This unknown amount of force applied could not be included in the recorded data and graphs. Accuracy of the data to be obtained was of highest priority, thus unrecorded tests were conducted to ensure the modified procedure would yield usable results.
Sample
Outer Diameter (cm)
Inner Diameter (cm)
Load Speed (cm/min)
1
2.01422
1.4605
0.127
2
2.0828
1.39954
0.127
to beyond fracture (as seen in Figure IV). Table IV – Preliminary Measurements Bending Test
3.3 Tension The final test conducted was the tensile test, in which one specimen of bamboo was put under stress until failure. Because this specimen was cut into a strip, the width and thickness was measured instead of the diameter. These measurements were then and entered into the software program. Additionally, the effective gauge length was also measured and recorded. The effective gauge length is the length of the exposed portion of the specimen, rather than the full length of it.
Figure IV – Compression Fracture Mechanics The specimens’ inner and outer diameters were measured (see Table III) with digital calipers and entered into the computer. Based on these inputs and the Tinius Olsen’s force transducer data, the computer produced the desired graphs. Table III – Preliminary Measurements Compression Test
Table V – Preliminary Measurements
3.2 Bending
Tension Test
The second set of tests comprised of the specimens being subjected to lateral loading with three points of contact. The specimens were placed on two supporting chucks at each end, and a downward force was applied at the center point of the specimen (see Figure V). Like the compression tests, stress and strain were plotted. The specimen’s inner and outer diameters were once again measured and logged (see Table IV).
12
Sample
Length (in)
Width (in)
Thickness (in)
Load Speed (in/min)
1
1.05664
0.38608
0.5588
0.5588
EXPERIMENTAL RESULTS 4.1 Compression For the six compression tests performed, the largest amount of stress recorded for any of the specimens was 129.90 MPa, while the lowest recorded value was 99.63 MPa. The six specimens had a mean of 115.08 MPa with a standard deviation of 11.73 MPa. The standard deviation is 10.19% percent of the mean value. When the highest and lowest stress measurements are discarded, the highest value of stress is 127.30 MPa, and the lowest value of stress is 109.28 MPa. Figure VI – Figure X illustrate the trends of stress versus strain in the latter five compression tests1 (the first plot can be found in the introduction in Figure II).
140 σu =
120
116.04
Stress (Mpa)
100 80 60 40 20 0 0
140
0.05 0.1 Strain (mm/mm)
0.15
σu = 109.28
120
Figure VII – Compression Test 4 Data 140
80 60
120
40
100
σu = 127.30
Stress (Mpa)
Stress (Mpa)
100
20 0 0
0.02
0.04
0.06
80 60 40
Strain (mm/mm)
20
Figure VI – Compression Test 2 Data
Stress (Mpa)
0 160 140 120 100 80 60 40 20 0
0
σu = 129.90
0.05 0.1 Strain (mm/mm)
Figure IX – Compression Test 5 Data
0
0.05 0.1 0.15 Strain (mm/mm)
0.2
Figure VII – Compression Test 3 Data
1
The data tables were too large to incorporate into this document. 13
0.15
The observed double peak can be explained because of the fact that cane is a hollow material. The double peak may be explained by the combination of compressive and tensile stress observed in bending. A visible bending moment results in the circular cane becoming elliptical until the point where failure occurs. The point of maximum bending moment at failure, or the moment of rupture, the specimen flattens. The stress continues to act on the flat piece until failure occurs again, and ultimately all practical structural integrity is absent.
120 σu = 99.63
Stress (Mpa)
100 80 60 40 20
4.3 Tension Only one tensile test was performed for bamboo. The ultimate stress for the specimen was 315.09 MPa, where the strain was 0.0902 mm/mm. The response of the specimen subjected to a tensile load is depicted in the stress versus strain plot in Figure XI.
0 0
0.05 0.1 Strain (mm/mm)
0.15
Figure X – Compression Test 6 Data
4.3.1 Discussion of Tensile Trend
The strain measured in the specimen was relatively consistent across the six samples tested. The largest recorded strain was 0.0274 mm/mm, and the lowest was 0.021 mm/mm. The mean value of strain across the six tests was 0.0237 mm/mm with a standard deviation of 0.0019 mm/mm, which is 8.00% of the mean. When the largest and smallest values of strain are discarded, the highest strain is 0.0254 mm/mm, and the lowest strain is 0.0226 mm/mm.
From Figure XI, it is obvious where failure occurred, however, a second linear trend (downward) is visible after failure has occurred (at the peak). As the strip of bamboo was subjected to a tensile load, fracture occurred when the ultimate tensile stress (UTS) was reached. The stress trend shoots straight down, yet then the specimen continues to deform with increased stress. This phenomenon may be attributed to the fact that bamboo (like wood) is a fibrous material, and certain fibers within the sample are more elastic than others. As the majority of the structural integrity is lost during failure, certain auxiliary structural fibers in the sample continue to resist tensile load and fail in a linear fashion with increased deformation.
4.1.1 Discussion of Compression Test Three of the nine tests conducted yielded unusable data and were discarded. The trends observed in the six successful tests are consistent with each other and produced straightforward results.
400 Stress (Mpa)
4.2 Bending Two bending tests were performed on samples of cane. Due to equipment failure, only one of two tests yielded usable data. During the test, the specimen peaked, dropped off suddenly, peaked again and dropped off suddenly again. The first peak had a maximum stress of 4.30 MPa with a strain of 0.0617 mm/mm, and the second peak had a maximum stress of 4.41 MPa with a strain of 0.0685 mm/mm. The stress versus strain plot for bending can be found in the introduction in Figure III.
σu = 315.09
300 200 100 0 0
4.2.1 Discussion of Bending Trend
Figure
14
XI
0.1 0.2 Strain (mm/mm) –
Tensile
Test
0.3 1
Data
Bamboo and cane are natural materials and consistency cannot be guaranteed, thus these documented results should only supplement frequent future testing with larger sample sizes. When sufficient testing has taken place, a standardized relationship of diameter, wall thickness, length, and failure stress can be established. This standardization may lead to revised building codes in areas of the world (typically Asia) where bamboo and cane are frequently used for structural support.
CONCLUSION The experiments heavily focused on compression because of the type of material being tested. A fibrous material, such as wood, bamboo, or cane, usually serves a practical utility as an axial load bearing member of a structure. Nonetheless, a tensile test and bending test were included for reference and comparison.
Gerhards, C.C. Effect of Moisture Content and Temperature on the Mechanical Properties of Wood: An Analysis of Immediate Effects. Wood and Fiber. 14(1): 4-36. Green, David. Winandy, Jerrold. Kretschmann, David. Wood Handbook: Wood as an Engineering Material, 1999. Madison, WI: USDA Forest Service. Pages 4-1 – 4-45 Kretschmann, D.E., and Bendtsen, B.A. Ultimate Tensile Stress and Modulus of Elasticity of Fast-grown Plantation Loblolly Pine Lumber. Wood and Fiber Science, 1992. 24(2): 189-203. Mallory, M.P., and Cramer, S. Fracture Mechanics: A Tool for Predicting Wood Component Strength. Forrest Products Journal, 1987. 37(7/8): 39-47.
REFERENCES Acceptance Criteria For Structural Bamboo. AC162, 2000. Whittier, CA. ICBO Evaluation Services, Inc. Pages 2-5. Arce-Villalobos, Oscar. Mechanical Properties of Bamboo. 10 Sept 2002. Accessed 18 Nov 2010. http://www.bambus.com/new/eng/reports/m echanical_properties/referat2.html>. ASTM. Standard Methods for Testing Small Clear Specimens of Timber. ASTM D143-94. West Conshohocken, PA. Forest Products Journal. 26(11): 51-56. Chudnoff, M. Tropical Timbers of the World. Agricultural Handbook, 1987. Washington DC: US Department of Agriculture. Pages 13–20. Fracture Properties of Bamboo. Composites Part B: Engineering. Volume 32, Issue 5, 2001, Pages 451-459.
15