For reprint orders, please contact:
[email protected]
REVIEW
Adiposopathy: sick fat causes high blood sugar, high blood pressure and dyslipidemia Harold Bays MD, FACP†, Nicola Abate MD, Manisha Chandalia MD †Author
for correspondence Medical Director/President L-MARC Research Center Louisville KY, USA
[email protected]
Keywords: adipose autodysharmonia, adiposopathy, diabetes, Food and Drug Administration, hypertension, obesity metabolic cycle, metabolic syndrome, obesity, regulatory
Adiposopathy is defined as pathological adipose tissue function that may be promoted and exacerbated by fat accumulation (adiposity) and sedentary lifestyle in genetically susceptible patients. Adiposopathy is a root cause of some of the most common metabolic diseases observed in clinical practice, including Type 2 diabetes mellitus, hypertension and dyslipidemia. The most common term for the metabolic consequences of adiposopathy is currently ‘the metabolic syndrome’. Drug usage to treat the metabolic syndrome has focused on the safety and efficacy of treatments directed towards individual components of the metabolic syndrome, and not so much upon adiposopathy itself. However, enough is known about the pathophysiology of adiposopathy to propose diagnostic criteria. Regulatory issues are important obstacles to the research and development of new drug treatments for the metabolic syndrome. It is hoped that these obstacles can, to some extent, be addressed and overcome by clearly defining and increasing our understanding of adiposopathy.
It is well known amongst clinicians that genetically predisposed patients who acquire excess body fat and maintain a sedentary lifestyle are at increased risk of developing a number of disease states [1], many which constitute important atherosclerotic coronary heart disease (CHD) risk factors that may lead to CHD events (Figure 1). Among the more common metabolic disorders often associated with excessive body fat are abnormalities of glucose metabolism (such as diabetes mellitus), hypertension and dyslipidemia. However, the relationship between excessive body fat and adverse metabolic consequences is not absolute. Obesity alone does not always result in clinical metabolic disease, and not all patients with these metabolic diseases are overweight. Recent and ongoing research into adipose function and dysfunction seem to be confirming these basic and common clinical observations. Studies are now supporting the concept that it is not the presence of excess adipose tissue alone, adiposity, that is causally related, but rather it is the dysfunction of adipose tissue, here termed ‘adiposopathy’, that should be identified as the root mechanistic etiology of disorders of glucose metabolism, blood pressure and lipid metabolism. The implications of this alteration in emphasis is certainly of significance for mechanistic research, and is also of great practical significance for the clinician. Adiposopathy: replacing the term ‘metabolic syndrome’
Many authors and scientific organizations have characterized and applied terminology to the constellation of metabolic abnormalities often 10.1517/14796678.1.1.39 © 2004 Future Medicine Ltd ISSN 1479-6678
associated with the accumulation of excessive body fat. Unfortunately, not everyone agrees on any particular characterization, nor do they always agree upon the definition. For example, the most common current term that refers to the cluster of metabolic abnormalities associated with disorders in glucose metabolism, hypertension and dyslipidemia is the ‘metabolic syndrome’. A similar clinical presentation has also been termed atherothrombogenic syndrome, beer-belly syndrome, cardiovascular metabolic syndrome, chronic cardiovascular risk factor clustering syndrome, deadly quartet (obesity, hyperinsulinemia, hypertension and dyslipidemia), disharmonious quartet, dysmetabolic syndrome, dysmetabolic syndrome X, insulin resistance syndrome, insulin resistance-dyslipidemia syndrome, metabolic cardiovascular syndrome, metabolic syndrome, metabolic syndrome X, multiple metabolic syndrome, plurimetabolic syndrome, Reaven’s syndrome, and syndrome X [2–4]. The variety of different terms for a similar or related condition reflects the difficulty in applying one name to a constellation of related, and sometimes unrelated metabolic abnormalities, and reflects an unsatisfying attempt to identify one root pathophysiologic cause of all of these. Futher complicating the matter is that differing organizations have different definitions for the same condition. The National Cholesterol Education Program, Adult Treatment Panel III (NCEP ATP III) [5] and the World Health Organization (WHO) [6] have established the most widely used definitions of the metabolic syndrome (Table 1). The criteria differ in many Future Cardiology (2005) 1(1), 39–59
39
REVIEW – Bays, Abate & Chandalia
Figure 1. Adiposity and adiposopathy in the development of atherosclerotic coronary artery disease [2].
Genetic predisposition Positive caloric balance
Sedentary lifestyle
Adiposity and adiposopathy
Insulin resistance:
Increased release of FFA Release of adipocyte hormones, adipokines, and other factors
Decreased release of insulin§:
Insulin resistance: (3) Pancreatic β-cells (genetically predisposed)
(1) Skeletal muscle (genetically predisposed)
Hyperglycemia
(2) Liver (genetically predisposed)
Hyperglycemia
Hyperglycemia dyslipidemia
Vascular damage
Lumen
Atherosclerotic plaque
Damaged vessel
§Short-term
release of free fatty acids (FFAs) may increase pancreatic insulin release. Chronic, long-term FFA exposure may result in decreased insulin secretion.
respects; for example, while waist circumference is a criteria included in the NCEP ATP III definition, waist:hip ratio or body mass index (BMI) ratio is used in the WHO definition. The NCEP ATP III definition does not include glucose intolerance or insulin resistance, while these are important criteria in the WHO definition. The NCEP ATP III does not include albuminuria, while this is a criteria recommended by WHO. The differing nomenclature and criteria for diagnosis is not without consequence. Obesity is the most common metabolic disease in developed nations. According to the WHO, over 1 billion adults are overweight on a worldwide 40
basis, with at least 300 million being obese [101]. In the USA, the unabated epidemic of obesity is now such that over 30% of adults are obese and over 60% of adults are either overweight or obese [7]. Of equal concern is that the high prevalence of obesity among children and adolescents continues to increase – a trend that suggests that the obesity epidemic will continue to increase in the future [8]. Largely as a consequence of the obesity epidemic, the increased prevalence of the metabolic syndrome might also be considered an epidemic in that it has been estimated that at least 47 million adults (22% of the population) in the USA are affected [9]. Future Cardiology (2005) 1(1)
Adiposopathy – REVIEW
Table 1. Comparison of NCEP ATP III and WHO criteria for Metabolic Syndrome. NCEP ATP III Three or more of the following must be present: Waist circumference§
Men Women
> 102 cm (>40 inches) > 88 cm (>35 inches)
Plasma TG
Men/women
≥ 1.7 mmol/L (≥ 150 mg/dL)
Plasma HDL cholesterol
Men Women
< 1.0 mmol/L (< 40 mg/dL) < 1.3 mmol/L ( 30 kg/m2
Men/women
≥ 20 µg/min
Men/women
≥ 30 mg/g
§
In Asian populations, these values are commonly revised to a waist circumference in men and women of 90 cm and 80 cm, respectively.
§§ See
Lancet 363, 157–163 (2004) for the WHO BMI definition for Asians. BMI: Body Mass Index; HDL: High-density lipoprotein; NCEP ATP: National Cholesterol Education Program Adult Treatment Panel; TG: Triglyceride; WHO: World Health Organization. (Reprinted with permission from [2] by permission of Cambridge Medical Publications, all rights reserved).
Given the enormity of this disease burden and the known public health consequences, it would seem reasonable that extraordinary efforts be made towards preventing, treating, and potentially curing the metabolic syndrome. However, the conduct and reporting of clinical trials to demonstrate efficacy in the treatment of the www.futuremedicine.com
metabolic syndrome have been hampered by the lack of consistent terminology, the lack of uniform diagnostic definitions and the different criteria reported in different clinical studies. For example, in recognition that increased body fat is often directly related to the development of the metabolic syndrome, investigators have often substituted BMI for measurement of waist circumference, which is a listed criteria according to the NCEP ATP. Sometimes, the substitution cutoff value has been greater than 30 kg/m2, while at other times greater than 25 kg/m2 has been used [2]. This is because from a practical standpoint, BMI is routinely obtained in clinical trials, while waist circumference is not. Further complicating the matter is that not all clinicians are clear on the similarities and differences between the metabolic syndrome and other associated conditions. Not all clinicians are aware that patients with Type 2 diabetes may or may not have metabolic syndrome, and patients with metabolic syndrome may or may not have diabetes. Moreover, even researchers are not certain whether insulin resistance syndrome and metabolic syndrome are the same, or have the same treatment goals [3]. In addition, the criteria to define the metabolic syndrome is largely based on epidemiological and cross-sectional observations mainly obtained in European descent population, and were subsequently generalized to various ethnic groups. Subsequent studies have revealed that aspects of the metabolic syndrome profoundly differ among ethnic groups. Even within the European descent populations, there are additional features of the metabolic syndrome that could be a better predictor of risk of metabolic and CHD risk. It is also noteworthy that the scientific organizations that have defined metabolic syndrome have not required that the components of the metabolic syndrome be due to any unifying and underlying metabolic process. Yet an increase in abdominal girth, hypertriglyceridemia, low high-density lipoprotein cholesterol (HDL-C) levels, high blood pressure and elevated glucose can all individually be the result of diseases and conditions that are entirely unrelated to one another, and thus not reasonably be connected to any one causality or syndrome. This may help to explain why the diagnosis of the metabolic syndrome may not be a predictor of 11 year CHD mortality among patients with Type 2 diabetes mellitus, and its diagnosis may not provide further predictive value compared with knowledge of its 41
REVIEW – Bays, Abate & Chandalia
single components [10]. In fact, even in patients without diabetes mellitus, diagnosis of the metabolic syndrome appears to be inferior to established prediction models for either Type 2 diabetes or CHD, such as the Diabetes Predicting Model and Framingham Risk Score [11]. The bottomline is that most clinicians know from their clinical practice experience that select patients with the metabolic syndrome are at high risk for development of atherosclerotic CHD and diabetes mellitus. To some extent, these consequences are supported in the medical literature [12]. Clinicians also have the intuitive sense that a long-term commitment towards treating these multiple metabolic risk factors improves the health of their patients, which is again supported by the medical literature [13]. However, while regulatory agencies such as the US Food and Drug Administration (FDA) recognize the existence of the metabolic syndrome, they have yet to establish criteria in order to grant an indication for its treatment. This lack of indication criteria for the treatment of the metabolic syndrome impairs the development of pharmaceutical agents to treat the underlying root cause and/or pathophysiology, and instead promotes continued research efforts focusing on drug treatment for the components of the metabolic syndrome. In other words, while specific regulatory criteria exists for granting approval for an indication for treatment of the components of the metabolic syndrome (such as Type 2 diabetes mellitus, hypertension and dyslipidemia), no such approvable ‘indication’ criteria exists for treatment of the metabolic syndrome itself, that often reflects underlying metabolic processes that may promote these conditions. Accumulating scientific data suggest that in most patients, it is the dysfunction of adipose tissue (adiposopathy) that is the root mechanistic aetiology of abnormalities of glucose metabolism, blood pressure and lipid metabolism (Figure 1). These scientific data are substantiated by the common clinical observation that many patients who gain weight develop these metabolic abnormalities, and if these same patients subsequently lose weight, then these metabolic abnormalities improve or may potentially resolve. If it becomes generally accepted that dysfunction of adipose tissue is the root mechanistic pathophysiologic etiology of the metabolic abnormalities that compose the metabolic syndrome in the majority of patients, then it may be time to replace the term metabolic syndrome (a term largely reflective of sometimes unrelated consequence), and replace it with ‘adiposopathy’ (a term more focused on 42
unified underlying causality). It may then be time to focus on adiposopathy as a primary treatment target, and to establish clear criteria for its diagnosis, and for granting an indication for its treatment. It may be time to acknowledge that adiposopathy is not only a disease, but a genetic disease state of a specific organ that: • Can be worsened by poor dietary and lifestyle habits, concurrent diseases, and perhaps certain drugs, such as corticoid steroids and some psychotropic drugs [1]; • A disease that leads to significant morbidity and mortality; • A disease that can be improved with favorable dietary and lifestyle habits and pharmaceutical agents; and • A disease whose correction will decrease morbidity and mortality Subsequently, clinical trials can be better designed and directed towards establishing a more rational direction of treatment compared with the current focus upon the often unrelated components of the metabolic syndrome. Sick fat (adiposopathy) causes Type 2 diabetes mellitus
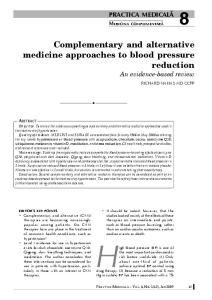
Overall, only approximately 12% of US adult patients with a BMI ≥ 27 kg/m2 have Type 2 diabetes mellitus [102]. Conversely, 67% of US patients diagnosed with Type 2 diabetes mellitus have a BMI ≥ 27 kg/m2, while 46% have a BMI greater than 30 kg/m2 [103]. Thus, not all patients who are overweight have Type 2 diabetes mellitus, in fact only a minority do, (Figure 2) and not all patients with Type 2 diabetes mellitus are overweight, although the majority are. Therefore, while excessive body fat clearly increases the risk of Type 2 diabetes mellitus, excess body fat alone is not sufficient towards development of Type 2 diabetes mellitus. Admittedly, adiposopathy is not the only cause of Type 2 diabetes mellitus. Other causes would include metabolic disorders that affect pancreatic function, such as some cases of hemochromatosis and chronic pancreatitis. Known metabolic abnormalities that might directly promote insulin resistance include hypercortisolism, excessive growth hormone and hyperthyroidism. Furthermore, certain populations exist that may have an inherent decrease in pancreatic function. However, for the majority of patients it is reasonable to conclude that it is the combination of adiposity, genetic predisposition and perhaps a sedentary lifestyle that leads to fat dysfunction, Future Cardiology (2005) 1(1)
Adiposopathy – REVIEW
Figure 2. Prevalence of common weight-related metabolic diseases based upon body mass index [102,104].
Comorbidities increase with increasing BMI % of adults by BMI category
60 50 40 30 20 10 0 18.5–24.9
25.0–26.9
27.0–29.9
30.0–34.9
35§§
2
BMI (kg/m ) Type 2 diabetes
§
Hypertension§§
Hypercholesterolemia§§§
§ Tested
fasting plasma glucose of equal to or greater than 126 mg/dl or self-reported as having responded positively to "Have you ever been told by a doctor that you have diabetes or sugar diabetes?" Excludes gestational and Type 1 diabetes. §§ Tested BP of equal to or greater than 140 mmHg systolic or 90 mmHg diastolic or selfreported as having responded positively to "Have you ever been told by a doctor or health professional that you had hypertension, also called high blood pressure?" §§§ Tested total cholesterol of 240 mg/dl or self-reported as having responded positively to "Have you ever been told by a doctor or health professional that your blood cholesterol level was high?" BMI: Body mass index.(Reprinted with permission from [2] by permission of Cambridge Medical Publications, all rights reserved).
and it is this adiposopathy that results in Type 2 diabetes mellitus (Figure 1). While in the past adipose tissue was thought to mainly function as an inert storage organ, adipose tissue is now known to be a very active organ from many metabolic standpoints (Table 2) [14]. Several fat-derived metabolites, hormones, enzymes, cytokines and other factors may have varying degrees of effects upon the activity of insulin, including the induction of insulin resistance (Table 3) [15,16]. One of the most well-described consequences of adiposopathy, if not one of the most welldescribed results of abnormal fat function, is the abnormal increase in the fasting and postprandial release of nonesterified or free fatty acids (FFAs) [15]. Short-term (2 to 6 h) elevations in FFA levels may enhance insulin secretion. However, longer term FFA exposure is detrimental, and may result in insulin resistance in the liver and muscle, as well as diminished pancreatic β-cell insulin production – which has sometimes been termed ‘lipotoxicity’ [15]. The www.futuremedicine.com
excessive release of FFA from fat cells appears to be more prevalent in patients genetically predisposed to development of Type 2 diabetes mellitus, and a reduction in FFA levels has been shown to improve insulin activity [15]. In addition to the abnormal release of FFA, adiposopathy is also manifest by the abnormal release of cytokines and other factors that contribute to diminished insulin activity (Table 3). Finally, adiposopathy often appears to be manifested by not only abnormalities in fat function, but also abnormalities in fat distribution. Patients with visceral, upper body fat (android) distribution tend to have more insulin resistance and hyperinsulinemia compared with those with more lower body fat (gynoid) [15]. In fact, it might be argued that the accumulation of visceral and subcutaneous truncal fat reflects a dysfunctional adipose organ, and is a gross anatomical manifestation of adiposopathy. Just as there is great variance in the functionality and dysfunctionality of adipose tissue, there is also variance in the distribution of 43
REVIEW – Bays, Abate & Chandalia
body fat among individuals and populations, and adipose tissue function and distribution are Table 2. Examples of endocrine and metabolic factors released from fat cells [1,15,18]. Examples of hormones/adipokines released from adipose tissue Leptin Adiponectin (adipoQ or adipocyte complement-related protein of 30 kDa/Acrp30) Interleukin-6 Resistin (FIZZ3 or Serine/cysteine rich adipocyte-specific secretory factor/ADSF) Tumor necrosis factor Examples of other enzymes, molecules, or factors described as being released from adipose tissue Acylation-stimulating protein (ASP) Adipophilin Adipsin Agouti protein Angiotensinogen Apolipoprotein E Calumenin Calvasculin Cholesteryl ester transfer protein (CETP) Collagen type VI alpha 3 Complement factor C3 Endothelin Entactin/nidogen Estrogen Fasting-induced adipose factor (FIAF) Free fatty acids Gelsolin Galectin-12 Haptoglobin Hippocampal cholinergic neurostimulating peptide (HCNP) Insulin-like growth factor (IGF-1) Lactate Lipocalins Lipoprotein lipase Macrophage inhibitory factor (MIF) Metalloproteases Metallotionein Monobutyrin Nitric oxide synthase Osteonectin (Secreted protein, acidic and rich in cysteine / SPARC) Perilipins Phospho-enolpyruvate carboxykinase (PEPCK) Phospholipid transfer protein Pigment epithelium-derived factor Plasminogen activator inhibitor (PAI-1) Pref-1 Protease inhibitors (such as cystatin C and colligin-1) Prostaglandins I2 & F2 prostacyclins Retinol-binding protein Serine protease inhibitors Stromal cell-derived factors, such as stromal cell-derived 1 precursor (SDF-1 or pre-B growth stimulating factor) Tissue factor Transforming growth factor beta (TGF-β)
44
related. For example, some obese patients are metabolically healthy, and have been characterized as ‘metabolically healthy, but obese’ (MHO). [17]. These obese patients appear to be ‘protected’ or ‘resistant’ [17] to the typical metabolic consequences often associated with excess body fat. It has been suggested that MHO is not an unusual presentation, accounting for as much as 20% of the obese population [17]. While it may initially seem counterintuitive that so many obese patients could present with the absence of impaired glucose intolerance, hypertension or dyslipidemia, one might speculate that those with MHO simply represent individuals who have little to no genetic predisposition to adiposopathy. In other words, irrespective of their increased body fat, MHO patients are likely to maintain normally functional adipose tissue as their fat mass increases. In fact, the additional adipose tissue in these individuals may provide additional “healthy” fat functionality, and thus account for a protective effect. As such, it has been suggested that weight loss in these patients might be ‘counterproductive’ and potentially harmful [17,19]. By maintaining favorable fat function and avoiding the adverse metabolic consequences of adiposopathy, MHO patients do not develop high blood pressure, or abnormalities of glucose and/or lipid abnormalities. With regard to fat distribution, it is interesting that MHO patients have been shown to have less visceral fat than obese patients with obesity-related metabolic abnormalities, such as those found with the metabolic syndrome [17]. Thus, a significant percentage of the general population appears not to be predisposed to adiposopathy, irrespective of the onset of obesity. This lack of adiposopathy predisposition is manifested by a lack of obesityrelated pathological fat dysfunction, a lack of obesity-related high blood pressure and metabolic abnormalities of glucose and lipid metabolism and a relative lack of accumulation of visceral fat. Another subgroup of patients that underscores the need to focus on fat function and/or dysfunction includes those who are ‘metabolically obese, but normal weight’ (MONW). These individuals are often young, ‘normal’ weight individuals with premature signs of insulin resistance, hyperinsulinemia and dyslipidemia [17]. It has been suggested that the fat dysfunction of these individuals correlates to an increase in intra-abdominal, or visceral fat, and that increased visceral fat (relative to subcutaneous peripheral fat) is dysfunctional Future Cardiology (2005) 1(1)
Adiposopathy – REVIEW
Table 3. Examples of adipose tissue-derived hormones, enzymes and other factors that have been associated with changes in insulin activity§ (adapted from [16]). Factor
Selected functions
Associated insulin activity
Examples of adipocyte hormones Leptin
Signals CNS to decrease appetite/nutrient intake Signals the CNS to increase caloric expenditure Increases insulin sensitivity
↑
Adiponectin
Increased adiponectin increases insulin sensitivity Associated with decreased hepatic glucose production
↑
Resistin
May increase insulin resistance
↓
Examples of adipocyte cytokines TNF-α
Increases tissue resistance to insulin, particularly during sepsis and cancer
↓
IL-6
Regulates T- and B-cell function Increases insulin resistance
↓
Examples of other select adipocyte proteins or factors ↓
Angiotensinogen
Converted in the circulation to angiotensin II, resulting in vasoconstriction and subsequently: - May increase blood pressure - May increase insulin resistance - May decrease pancreatic insulin secretion
Plasminogen activator inhibitor-1
Inhibits tissue plasminogen activator Inhibits activation of fibrinolytic cascade May increase the risk of thrombosis May interfere with insulin signaling
↓ (?)
Adipsin and acylation stimulating protein
Increases clearance of circulating free fatty acids, triglyceride synthesis and glucose uptake in adipose tissue.
↑
§ These effects upon insulin activity are largely based upon animal studies, and not always definitively known to occur, nor be of significance in humans. IL: Interleukin; TNF: Tumor necrosis factor. (Reprinted from [2] by permission of Cambridge Medical Publications, all rights reserved).
and metabolically harmful [17,20,21]. It has also been suggested that fat dysfunction may correlate with subcutaneous truncal, but not subcutaneous peripheral fat accumulation [20–23]. Thus, adiposopathy appears to be not only associated with abnormalities in secretion of adipocyte hormones, cytokines, factors, and other molecules, but also associated with an increase in intra-abdominal or possibly subcutaneous truncal fat which all leads to an increased risk of. high blood pressure, and abnormalities of glucose and lipid metabolism. www.futuremedicine.com
Taken together, MHO and MONW patients demonstrate the point that it is not simply the abnormal increase in normal adipose tissue that reliably predicts subsequent adverse metabolic consequences of adiposopathy. Instead, it is the sufficient presence of or sufficient increase in inadequately functional or blatantly dysfunctional adipose tissue that is the essential, underlying pathology. Emerging from this paradigm are two other concepts: the ‘obesity metabolic cycle’ and ‘adipose autodysharmonia’. As noted above, the predisposition to dysfunctional adipose tissue is largely genetic, and in many cases exacerbated by adiposity and sedentary lifestyle (Figure 1). One of the more important consequences of adiposopathy is the promotion of insulin resistance and hyperinsulinemia. In an environment where adipose tissue remains relatively sensitive to insulin (a growth factor) while other organs such as skeletal muscle and liver become more and more insensitive to insulin, hyperinsulinemia may ensue, which in turn may lead to increased adipose tissue and subsequent worsening of adipose function. This worsening adiposopathy may cause yet further insulin resistance among other body organs. Adiposopathy, followed by insulin resistance and hyperinsulinemia, followed by worsening adiposity and adiposopathy, followed by even greater insulin resistance has been termed the ‘obesity metabolic cycle’ [1]. The fact that increased insulin levels may increase adipose tissue mass may help to explain why antidiabetes drugs that lower blood sugar through increased insulin levels may further increase body weight, while antidiabetes drugs that lower blood sugar through increasing insulin sensitivity (without increase or perhaps decrease in insulin levels) are often associated with no weight gain, or perhaps modest weight loss [1]. Also as noted above, the location of adiposity may provide clues as to when adipose dysfunction is most likely to occur. Indeed, studies of human fat depots (abdominal subcutaneous, mesenteric and omental) have shown that even after multiple doublings, preadipocytes retain the characteristics of the fat depots from which they had originated [24]. This suggests that subcutaneous and visceral fat may be genetically predisposed to have significantly different functions. Thus, within the same individual, various fat depots may exhibit functional conflicts in which well-functioning subcutaneous peripheral fat may be providing favorable metabolic benefits, while at the same time, malfunctioning subcutaneous truncal and visceral fat may be 45
REVIEW – Bays, Abate & Chandalia
Table 4. Mean plasma lipid levels at diagnosis of Type 2 diabetes in the UK Prospective Diabetes Study [25]. Men
Women
Lipid variable
Type 2 diabetes (n = 2139)
Nondiabetic control (n = 52)
Type 2 diabetes (n = 1574)
Nondiabetic control (n = 143)
TC mg/dL (mmol/L)
213 (5.5)
205 (5.3)
224 (5.8)
217 (5.6)
(3.9)§§
LDL-C mg/dL (mmol/L)
139 (3.6)
132 (3.4)
151
HDL-C mg/dL (mmol/L)
39 (1.0)§
43 (1.1)
43 (1.1)§§
55. (1.4)
TG mg/dL (mmol/L)
159 (1.8)§§
103 (1.2)
159 (1.8)§§
95 (1.1)
§p
135 (3.5)
§§p
< 0.02; < 0.001 versus control. HDL-C: High-density lipoprotein cholesterol; LDL-C: Low-density lipoprotein cholesterol; TC: Total cholesterol; TG: Triglyceride. (Reprinted from [2] by permission of Cambridge Medical Publications, all rights reserved).
inciting detrimental metabolic effects, a fracas situation that might be termed ‘adipose autodysharmonia’. An extreme clinical example on how dysfunction of adipose tissue may result in diabetes mellitus, even in absence of obesity, is demonstrated in patients with lipodystrophy, a disease where lack of adipose tissue and leptin deficiency results in excessive caloric intake, increased plasma nonesterified free fatty acids and elevated triglycerides concentrations. In many individuals who lack sufficient functional fat, ‘ectopic’ fat is deposited in skeletal muscle and liver, with post-receptor defects in insulin action at the level of skeletal muscle [26]. In other words, lipodystrophy is an example of how the metabolic abnormalities of fat metabolism in absence of obesity may result in similar consequences on glucose disposal typically seen in many obese patients. Yet another illustrative example of how abnormal function of fat tissue (adiposopathy) results in metabolic consequences leading to an Table 5. LDL subclass phenotypes in Type 2 diabetes [30,31]. LDL subclass (%) Population
n
A
Intermediate
B
Diabetic Nondiabetic
29 87
28 47
21 29
51 24
Diabetic Nondiabetic
54 543
34 85
30 9
36 6
Men
Women
Patterns A, Intermediate and B were determined by LDL diameter measurement Pattern A: larger, potentially less atherogenic particles. Patten B: small, dense, potentially more atherogenic particles LDL: Low-density lipoprotein.(Reprinted from [2] by permission of Cambridge Medical Publications, all rights reserved).
46
increased predisposition to Type 2 diabetes and CHD can be found amongst Asian Indians. Many persons originating from the Indian subcontinent manifest insulin resistance, even in the absence of obesity [27–29]. A study of this population has revealed that FFA levels are higher and insulin-mediated FFA suppression is impaired in Asian Indian men compared with Caucasians [27]. In addition, leptin levels are higher and adiponectin levels are lower in Asian men compared with Caucasians [27]. Furthermore, non-obese Asian Indians typically exhibit high levels of C-reactive protein [29]. From these scientific observations, it has been proposed that the increased genetic predisposition to adiposopathy, coupled with increasing body fat (adiposity), that accounts for the increased prevalence of Type 2 diabetes mellitus and CHD in this ethnic group [27]. Thus, this is an illustrative example of how adiposopathy (not necessarily adiposity) has been shown to be the root mechanistic cause of many of the same metabolic abnormalities found with the metabolic syndrome in a specific ethnic group. In fact, it has even been suggested that the metabolic syndrome may not be so uncommon even among the general US population of mildly overweight adults [32]. Some estimate that the prevalence of the so-called MONW patients may be as high as 13–18% [17]. Sick fat (adiposopathy) causes high blood pressure
Among overweight adult patients with a BMI between ≥ 25 kg/m2 and less than 30 kg/m2, 22–33% have hypertension, and among patients with BMI ≥ 30 kg/m2, greater than 40% have hypertension [103]. Conversely, the prevalence of hypertension among adults who are not overweight (BMI less than 25 kg/m2), is less than Future Cardiology (2005) 1(1)
Adiposopathy – REVIEW
Table 6. The atherogenic effect of diabetes dyslipidemia. Potential atherogenic effects of small dense LDL: • Increased susceptibility of LDL particles to undergo oxidation • Increased permeability of arterial endothelia to LDL particles • Conformational change in apolipoprotein B in small, dense LDL particles leading to decreased affinity for LDL receptor. • Present in association with insulin resistance syndrome • Present in association with high TG and low HDL cholesterol Abnormalities associated with elevated TG levels and thus potential for increased CHD risk: • Accumulation of lipoprotein (chylomicron and VLDL) remnants • Association with presence of small, dense LDL particles • Association with presence of low HDL cholesterol levels • Increased risk of thrombosis coagulability: - Increased PAI-1 - Increased Factor VIIc - Activation of prothrombin to thrombin Abnormalities associated with low HDL cholesterol levels and potential for increased CHD risk: • Reduction of direct antioxidant/anti-inflammatory effects on the vessel wall via impaired HDL-mediated: - Stabilization of prostacyclin production and/or prolongation of prostacyclin half-life. - Decrease in endothelial expression of cell adhesion molecules in response to cytokines and otherwise restoration of endothelial dysfunction. • Reduced endothelial nitric oxide production and reduce antiplatelet and anticoagulant effects • Reduced peripheral cholesterol transport/flux. CHD: Coronary heart disease; HDL: High-density lipoprotein; LDL: Low-density lipoprotein; PAI-1: Plasminogen activator inhibitor-1; TG: Triglyceride.VLDL: Very-lowdensity lipoprotein. (Reproduced from [2] by permission of Cambridge Medical Publications, all rights reserved and adapted with kind permission from Baylor College of Medicine, Houston, TX, USA [106]).
25%, yet hypertension is still found in these nonoverweight individuals [102,103,105]. So while BMI is directly associated with high blood pressure, particularly among patients less than 60 years of age [33], not all patients who are overweight have hypertension (although many do) (Figure 2), and not all patients with hypertension are overweight. Therefore, while excessive body fat clearly increases the risk of hypertension, excess body fat alone is not sufficient towards development of hypertension. Admittedly, adiposopathy is not the only cause of hypertension. Other causes would include pheochromocytoma, primary hyperaldosteronism, hypercortisolism, hyperthyroidism, renal artery stenosis and various kidney diseases. Furthermore, certain familial or genetic syndromes exists that strongly predispose individuals to hypertension. However, the majority of patients (> 90%) with high blood pressure have what is called ‘essential hypertension’. Adiposity is perhaps the www.futuremedicine.com
greatest risk factor for essential hypertension. Excessive body fat may lead to promoters of increased blood pressure, such as fat cell secretory products that result in increase mineralocorticoid release [34], and effects upon the renin–angotensin system (Table 2), and sympathetic nervous system, all which represent adipose dysfunction (adiposopathy). Furthermore, independent of adipose function or dysfunction, excess body fat may physically compress the kidney and increase the incidence of sleep apnea associated with obesity – which also may increase the risk of hypertension. Sick fat (adiposopathy) causes dyslipidemia
Among US adult patients with a BMI between ≥ 25 kg/m2 and 30 kg/m2, 19–30% have hypercholesterolemia (≥ 240 mg/dl). Among patients with a BMI > 30 kg/m2, greater than 20–30% have hypercholesterolemia [103,105]. Conversely, among US adults who are not overweight (BMI < 25 kg/m2), less than 25% have hypercholesterolemia, although hypercholesterolemia is still present in these nonoverweight individuals [102,103,105]. So while BMI is directly associated with dyslipidemia, particularly among patients less than 60 years of age [33], not all patients who are overweight have hypercholesterolemia, although many do (Figure 2), and not all patients with hypercholesterolemia are overweight. Therefore, while excessive body fat increases the risk of hypercholesterolemia, excess body fat alone is not sufficient towards development of hypercholesterolemia. Furthermore, while there does appear to be a linear relationship between adiposity and blood pressure, glucose levels and waist circumference (with an inverse linear relationship with HDL-C levels), this relationship appears to peak within a BMI range of 30–40 kg/m2 for alipoprotein B, low density lipoprotein cholesterol (LDL-C) and triglycerides, with subsequent decreased levels with increasing obesity. This suggests that morbidly obese patients may have some lipid risk profiles more favorable than less obese patients [35], and again underscores the complexity of the relationship of adiposity with fat function. Admittedly, adiposopathy is not the only cause of dyslipidemia. Other secondary causes would include hypothyroidism, diabetes mellitus and certain types of liver or kidney diseases. Furthermore, specific genetic abnormalities may be present, such as familial hypercholesterolemia, which is due to defective or absent LDL particle 47
REVIEW – Bays, Abate & Chandalia
Figure 3. Fasting atherogenic lipid profile associated with metabolic syndrome and Type 2 diabetes mellitus (elevated TG, decreased HDL-C and increased prevalence of small dense LDL particles).
Renal clearance
Adiposopathy
TG
HDL Cholesterol ↑ FFA
CETP
Small dense HDL
TG
TG
VLDL Lipases TG CETP Cholesterol Fatty liver LDL
Lipases
Small dense LDL TG
Adapted from [37]. This figure does not depict the important contribution of postprandial hypertriglyceridemia, which often occurs in these same patients wherein elevated postprandial chylomicrons (from the intestine) may also contribute to hypertriglyceridemia, the atherogenic lipid profile described above, and the creation of chylomicron remnant particles, which may be significantly atherogenic [38].
receptors, and results in severe hypercholesterolemia irrespective of body fat. Although hypercholesterolemia may be associated with adiposity, the type of dyslipidemia most associated with the metabolic syndrome and Type 2 diabetes mellitus is fasting hypertriglyceridemia, low HDL-C levels (Table 4), and abnormalities of lipoprotein particle size and subclass distribution (Table 5) [2,36]. Figure 3 illustrates how adiposopathy may lead to increased FFA release, fatty liver, and then to fasting hypertriglyceridemia as the result of increased verylow-density lipoprotein (VLDL) particle production. The subsequent exchange of cholesterol with triglycerides between VLDL and HDL particles through cholesteryl ester transfer protein, as well as LDL particles, results in triglyceride-rich HDL and LDL particles. This process also leads to cholesterol-rich VLDL and IDL-atherogenic remnant particles. Once the triglyceride-rich 48
HDL particles undergo lipolysis through various lipases, the HDL particle becomes smaller and more dense, leading to increased renal clearance and decreased HDL blood levels; this is associated with an increased risk of CHD. Once the triglyceride-rich LDL particles undergo lipolysis through various lipases, the LDL particle becomes more small and dense, leading to what is termed ‘pattern B’; this is also associated with an increase risk of risk of CHD (Table 6). Thus, it is reasonable to conclude that it is the combination of adiposity, genetic predisposition, and perhaps sedentary lifestyle that leads to fat dysfunction, and it is this adiposopathy that results in an atherogenic dyslipidemia [39]. Adiposopathy: treatments
Current treatments for adiposopathy include those that treat obesity (as it is obesity that often exacerbates the root cause of the metabolic Future Cardiology (2005) 1(1)
Adiposopathy – REVIEW
Table 7. Effects of antidiabetes agents upon lipid levels. Treatment
Triglycerides
High-density lipoprotein cholesterol
Low-density particle size
Low-density particle number
Lifestyle changes
Potential decrease
Potential increase
Potential decrease
Potential decrease
Insulin secretagogues
No change
No change
No change
No change
Metformin
Inconsistent; occasionally decreased
Inconsistent; occasionally increased
No change or minimal increase
No change or minimal decrease
α-Glucosidase inhibitors
No change
No change
No change
No change
Thiazolidinediones
No change with rosiglitazone; 15–20% decrease with pioglitazone
5–10% increase
Probable to substantial increase
5% increase with rosiglitazone; no change with pioglitazone
Insulin
Decrease
No change
Probable increase
No change
(Reproduced from [16,40]).
syndrome) and those that treat the metabolic consequences, such as drug treatments for Type 2 diabetes mellitus, hypertension and dyslipidemia. Antiobesity agents
Adiposity, along with sedentary lifestyle in genetically susceptible individuals, leads to worsening adiposopathy. It has been theorized that enlargement of fat cells alone might largely account for fat cell dysfunction [15]. In fact, it is the enlargement of fat cells that best correlates with insulin resistance as compared with other measures of adiposity, and enlarged fat cells are a strong, independent predictor of the development of Type 2 diabetes mellitus [15]. Current antiobesity agents such as orlistat (Xenical®) and sibutramine (Reductil®, Merida®) have both been shown to reduce body weight and also improve many metabolic abnormalities of glucose and lipid metabolism that are otherwise associated with increased CHD risk [1]. This illustrates an important principle that: ‘the development of any effective antiobesity agent must not only reduce fat mass (adiposity), but must also correct fat dysfunction (adiposopathy) in order to maximize metabolic health’ [1]. Some investigational antiobesity agents in development have already demonstrated reduction in the incidence of the metabolic syndrome [1]. In order to gain approval for clinical use, other antiobesity agents in development will likely have to demonstrate similar improvements in metabolic function. Antidiabetes drugs
Antidiabetes drugs may also improve glucose metabolism, and thus improve the hyperglycemia consequence of adiposopathy. www.futuremedicine.com
Current antidiabetes agents have little impact upon blood pressure, and varying effects upon lipid levels (Table 7) [40]. It is with special interest that some antidiabetes agents may improve fat differentiation and function, while at the same time, paradoxically increase body weight. Through a large number of DNA microarrays, it has been shown that large differences exist between lean and obese mice in expression of genes. Specifically, the expression of many genes normally associated with adipocyte differentiation appeared to be downregulated with obesity [41]. Recruitment of functional fat cells through differentiation is one potential treatment option towards improving glucose metabolism through improved fat function and reduction of the metabolic consequences of adiposopathy. Peroxisome proliferator-activated receptor (PPAR) γ agonists [16], such as thiazolidinediones (TZDs), represent antidiabetes agents that improve glycemic control, enhance hepatic and muscle insulin sensitivity, and improve β-cell function. TZDs are associated with weight gain directly proportional to the reduction in hemoglobin A1c (HbA1c) [15]. Additionally, obese individuals appear to respond better to TZDs than lean subjects. This may be attributable to the fact that PPARγ is a critical transcription factor in the differentiation of preadipocytes into adipocytes [42]. Thus, by recruiting more functional fat cells, TZDs cause a marked reduction in plasma FFA concentration and inhibit lipolysis in patients with Type 2 diabetes mellitus [15]. TZDs may also: • Inhibit the expression of the leptin gene in adipocytes with a decline in leptin levels; • Improve fat distribution with a decrease in intra-abdominal fat; 49
REVIEW – Bays, Abate & Chandalia
Table 8. Prevention trials of lipid-altering therapy including patients with diabetes. Trial
Diabetic number
Total number in study
Lipid-altering drug (mg/day)
CHD risk versus placebo in diabetic patients (%)
CARDS*
2838
2838
Atorvastatin 10
-37 (p = 0.001)
AFCAPS
155§
6605
Lovastatin 40‡
-44 (p = NS)
HPS
2912
7150
Simvastatin 40
-33 (p = 0.0003)
ASCOT
2532
10,305
Atorvastatin 10
-16 (p = NS)
PROSPER
623
5804
Pravastatin 40
+27 (p = NS)
HHS
135
4081
Gemfibrozil 1200
-68 (p = NS)
Primary prevention
Secondary prevention 4S Re-analysis¶
202 483
4444
Simvastatin 20–40
-55 (p = 0.002) -42(p = 0.001)
CARE
586
4159
Pravastatin 40
-25 (p = 0.05)
LIPID**
1077
9014
Pravastatin 40
-19 (p = NS)
LIPS
202
1677
Fluvastatin 80
-47 (p = 0.04)
HPS
3051
13,386
Simvastatin 40
-18 (p = 0.002)
4D§§
1255
1255
Atorvastatin 20
-8 (p = NS)
VA-HIT‡‡
769
2351
Gemifbrozil 1200
-32 (p0.004)
DAIS§§
418
418
Fenofibrate 200
-23 (p = NS)
Diabetes trials in progress FIELD
9795
9795
Fenofibrate 200
ASPEN
2200
2200
Atorvastatin 10
Prevention trials of lipid-altering therapy including patients with metabolic syndrome. Primary WOSCOPS
1691§§§
6595
Pravastatin 40
27% Reduction in CHD risk
4S post hoc analysis
458§§§
4444
Simvastatin 20–40
52% reduction (p = 0.00009) in major coronary events
CDP
563§§§
8341
Niacin 3000
9% reduction in total 5-year mortality 25% reduction in risk of nonfatal myocardial infarction in metabolic syndrome patients without HDL-C criterion An additional analysis noted that the most pronounced benefits of treatment were seen in metabolic syndrome patients with low HDL-C (< 40 mg/dl)
Secondary
*CARDS was the only primary prevention trial in this group that was prospective. ‡Mean dose was 30mg. §The figure of 155 in AFCAPS/TexCAPS includes subjects with diagnosis of diabetes (n = 71 placebo and 84 drug treated). However, an alternative figure often cited is a 239 figure that included subjects with diagnosis of diabetes mellitus or fasting glucose ≥ than 126 mg/dL (n = 113 placebo and n = 126 drug treated). ¶The 483 patients represented a re-analysis wherein diabetes was defined according to fasting glucose ≥126 mg/dl. **782 patients identified themselves as having diabetes, with another 295 having probable undiagnosed diabetes based upon fasting glucose levels for a total of 1077. ‡‡Of the patients on this study, 627 had history of diabetes, with another 142 found to have fasting glucose levels ≥ 126 mg/dl at baseline. This gives the total of 769 patients. §§These were prospective trials, and not post hoc analysis (as were the rest of the studies in this secondary prevention group. §§§ Number of patients with the metabolic syndrome). NS: Not significant (Reprinted from [2] by permission of Cambridge Medical Publications, all rights reserved).
• Decrease hepatic fat content associated with an improvement in hepatic insulin sensitivity; and • Decrease in intracellular concentration of metabolites of muscle triglycerides that best 50
predicts the improvement in muscle sensitivity to insulin. Although some of the weight gain associated with TZDs is due to an increase in fluid retention, it is Future Cardiology (2005) 1(1)
Adiposopathy – REVIEW
Table 9. Regulatory considerations for granting approval of a treatment indication for a new metabolic drug [45]. General principles for approval of a new drug • Must have reasonable clinical trial data conducted through adequate and applicable methods that demonstrate the drug is safe and effective under the conditions of use when prescribed, recommended or suggested in the proposed labeling. Specific principles for metabolic drugs • Although in most cases, no minimum level of efficacy is established for approval of metabolic drug treatments [45,46], in general, these drugs usually require certain objective minimum improvement in target metabolic parameters as weighed against potential risk. • Approved antihypertensive drugs have generally achieved > 4–5 mm/Hg reduction in blood pressure [47,48]. • Approved antidiabetes drugs have generally achieved at least about a 1% reduction in hemoglobin A1c. • Approved systemic lipid-altering drugs must generally achieve an LDL-C lowering of at least 15%, and perhaps lower (12%) for non-systemic lipid-altering drugs [45]. • Approved anti-obesity drugs must generally achieve mean placebo-subtracted weight loss ≥ 5% at the end of 1 year, with the proportion of subjects who lose ≥ 5% of baseline body weight is greater in drug- vs placebo-treated group [49]. • The mechanism of action and known experience of the metabolic drug must be scientifically and reasonably expected to improve patient outcomes, and in cases of new drugs with novel mechanisms of action, demonstrate at least surrogate outcome benefits irrespective of the efficacy on the metabolic treatment target. For example, a novel HDL-raising drug would require at least ≥ 2 different imaging modalities to obtain an initial approved indication for HDL-raising, possibly with postapproval confirmatory clinical endpoint studies.
also true that through the successful recruitment of preadipocytes into adipocytes, some of the resulting fat weight gain is an indicator of the efficacy of the TZD. Other indicators of improvement in adiposopathy with the creation of ‘healthier’ fat with TZDs are: • The reduction in FFA levels; • Inhibition of resistin, tumor necrosis factor, and plasminogen activator inhibitor (PAI)-1 gene expression in adipocytes and reduction in their circulating levels; • Stimulation of adiponectin gene expression in adipocytes and increase in adiponectin levels; • Improvement in pancreatic β-cell function with a reduction in islet fat content and preservation of islet cell histology and β-cell mass. In addition to TZDs, investigational antidiabetes drugs are in development, such as dual PPAR α/γ agents (e.g., tezaglitazar, muraglitazar) [16,43,44] that likewise, have actions upon molecular targets with the potential to improve glucose metabolism, improve dyslipidemia, reduce ‘lipotoxicity’, and generally improve adiposopathy [16,50]. Antihypertensive drugs
Antihypertensive drugs have been shown to reduce CHD events in patients with diabetes mellitus, as well as reduction in other www.futuremedicine.com
complications of diabetes mellitus [51], with the best choice of first agents being those that might improve endothelial dysfunction (such as with angiotensin-converting enzyme inhibitors and aldosterone receptor antagonists), followed by the liberal use of addition antihypertensive agents in order to maximize blood pressure control [52]. Lipid-altering drugs
Lipid-altering drugs are also one of the few drug treatments that have been shown to reduce CHD outcomes in patients with glucose abnormalities [16] (Table 8). Thus, lipid-altering drugs will continue to be recommended for high risk metabolic syndrome patients [5], and will continue to be an important treatment option to reduce CHD events in patients with adiposopathy. Conclusion
Abnormal fat function, termed adiposopathy, is a major contributing factor in the development of the most common metabolic diseases encountered in the clinical practice of medicine. Through a better understanding of the pathophysiology, and through established criteria for its diagnosis, the treatment of adiposopathy holds promise for the reduction in morbidities and mortality – particularly through a reduction in CHD, and a reduction in the presence or onset of Type 2 diabetes mellitus, hypertension and dyslipidemia. 51
REVIEW – Bays, Abate & Chandalia
Table 10. The 1982 revised criteria for classification of systemic lupus erythmatosis. Criterion§ definition 1. Malar rash a) Fixed erythema, flat or raised, over the malar eminences, tending to spare the nasolabial folds 2. Discoid rash a) Erythematous raised patches with adherent keratotic scaling and follicular plugging; atrophic scarring may occur in older lesions 3. Photosensitivity a) Skin rash as a result of unusual reaction to sunlight, by patient history or physician observation 4. Oral ulcers a) Oral or nasopharyngeal ulceration, usually painless, observed by physician 5. Arthritis a) Nonerosive arthritis involving 2 or more peripheral joints, characterized by tenderness, swelling, or effusion 6. Serositis a) Pleuritis convincing history of pleuritic pain or rubbing heard by a physician or evidence of pleural effusion or b) Pericarditis documented by ECG or rub or evidence of pericardial effusion 7. Renal disorder a) Persistent proteinuria > 0.5 g/day or > 3+ if quantitation not performed or b) Cellular casts may be red cell, hemoglobin, granular, tubular, or mixed 8. Neurologic disorder a) Seizures in the absence of offending drugs or known metabolic derangements, e.g., uremia, ketoacidosis, or electrolyte imbalance or b) Psychosis in the absence of offending drugs or known metabolic derangements, e.g., uremia, ketoacidosis, or electrolyte imbalance 9. Hematologic disorder a) Hemolytic anemia with reticulocytosis or b) Leukopenia < 4000/mm3 total on 2 or more occasions or c) Lymphopenia < 1500/mm3 on 2 or more occasions or d) Thrombocytopenia < 100,000/mm3 in the absence of offending drugs 10. Immunologic disorder a) Positive LE cell preparation or b) Anti-DNA: antibody to native DNA in abnormal titer or c) Anti-Sm: presence of antibody to Sm nuclear antigen or d) False positive serologic test for syphilis known to be positive for at least 6 months and confirmed by Treponema pallidum immobilization or fluorescent treponemal antibody absorption test 11. Antinuclear antibody a) An abnormal titer of antinuclear antibody by immunofluorescence or an equivalent assay at any point in time and in the absence of drugs known to be associated with "drug-induced lupus" syndrome §The classification is based on 11 criteria. For the purpose of identifying patients in clinical studies, a person shall be said to have systemic lupus erythematosus if any 4 or more of the 11 criteria are present, serially or simultaneously, during any interval of observation [53].
Adiposopathy: future perspectives & regulatory considerations
While regulatory indications exist for treatment of the components of metabolic syndrome (e.g., diabetes mellitus, hypertension, and dyslipidemia), an indication for the treatment of the metabolic syndrome itself remains elusive. The approval of drugs for treatment of adiposopathy and the metabolic syndrome present special challenges. No clinical trial has demonstrated patient outcomes that benefit from a single drug which improves multiple CHD risk 52
factors, and thus regulatory agencies have not found global risk factor reduction as an acceptable criterion to grant drug approval, labeling or promotion [45]. Examples of suggested regulatory criteria that must be met in order to grant approval of a specific indication for a new drug are listed in Table 9. As can be seen from this table, other metabolic disease drugs (such as antihypertensive drugs, antidiabetes agents and lipid-altering drugs), have fairly clear criteria to obtain an approvable indication. The main reason as to why these drug Future Cardiology (2005) 1(1)
Adiposopathy – REVIEW
Table 11. Proposed diagnostic criteria for the diagnosis of adiposopathy. Criterion§ definition Major criteria 1. Adiposity • Body mass index (BMI) ≥ 30 kg/m2§§ or • Waist circumference > 102 cm (> 40 in) in men, or > 88 cm (> 35 in) in women or • Waist:hip ratio > 0.9 in men, or > 0.85 in women 2. Abnormalities in glucose metabolism • Fasting glucose blood levels ≥ 100 mg/dl (6.0 mmol/l) or • 1 h post oral 75 g glucose load glucose blood level ≥ 140 mg/dl (mmol/l) or • Use of antidiabetes drug treatment in Type 2 diabetes mellitus 3. Hypertension • Systolic blood pressure ≥ 130 mm/Hg or diastolic blood pressure ≥ 85 mg/Hg or • Use of antihypertensive drug treatment for high blood pressure 4. Dyslipidemia • Fasting triglyceride level > 150 mg/dl (>1.7 mmol/l) or • Fasting HDL-C level < 40 mg/dl (