ADHD Classification Using Bag of Words Approach on Network Features Berkan Solmaza , Soumyabrata Deya , A. Ravishankar Raob and Mubarak Shaha a University
b IBM
of Central Florida, Orlando, FL, USA; T.J. Watson Research Center, Yorktown Heights, NY, USA ABSTRACT
Attention Deficit Hyperactivity Disorder (ADHD) is receiving lots of attention nowadays mainly because it is one of the common brain disorders among children and not much information is known about the cause of this disorder. In this study, we propose to use a novel approach for automatic classification of ADHD conditioned subjects and control subjects using functional Magnetic Resonance Imaging (fMRI) data of resting state brains. For this purpose, we compute the correlation between every possible voxel pairs within a subject and over the time frame of the experimental protocol. A network of voxels is constructed by representing a high correlation value between any two voxels as an edge. A Bag-of-Words (BoW) approach is used to represent each subject as a histogram of network features; such as the number of degrees per voxel. The classification is done using a Support Vector Machine (SVM). We also investigate the use of raw intensity values in the time series for each voxel. Here, every subject is represented as a combined histogram of network and raw intensity features. Experimental results verified that the classification accuracy improves when the combined histogram is used. We tested our approach on a highly challenging dataset released by NITRC for ADHD-200 competition and obtained promising results. The dataset not only has a large size but also includes subjects from different demography and edge groups. To the best of our knowledge, this is the first paper to propose BoW approach in any functional brain disorder classification and we believe that this approach will be useful in analysis of many brain related conditions. Keywords: ADHD, functional MRI, network features, bag-of-words
1. INTRODUCTION Attention Deficit Hyperactivity Disorder (ADHD) is one of the most commonly found behavioral disorders among children. Almost 3-5% of school aged children are diagnosed with ADHD. At present, no well known biological measure exists to diagnose ADHD. Instead people rely on the behavioral symptoms to identify it. To understand the cause of the disorder more fundamentally, researchers are using new structural and functional imaging tools. fMRI has been widely used to study the function of brain.1 fMRI can give high quality visualization of location of activity within the brain. Thus, it allows a comparison of the functions of control and disordered brains. fMRI has been used to study and diagnose different functional disorders of brain. In some analyses, taskrelated fMRI data is used where the test subjects perform some conscious tasks depending on the input stimuli. On the other hand, some studies use resting state brain fMRI data. Even when the brain is in the resting state, a network region, known as default mode network (DMN) of brain, remains active. The DMN was first identified by Raichle et al.2 It is believed that the DMN may be responsible for synchronizing all parts of the brain’s activity; and disruptions to the network may cause a number of complex brain disorders.3 Researchers have studied neural substrates relevant to ADHD related behaviors such as attention lapses, and associated DMN as a key area for observation for a better understanding of the problem.4 In this study we use the resting state brain Further author information: B.S.: E-mail:
[email protected], Telephone: 1 407 823 4733 S.D.: E-mail:
[email protected], Telephone: +1 407 823 4733 A.R.R.: E-mail:
[email protected], Telephone: +1 914 945 3553 M.S.: E-mail:
[email protected], Telephone: +1 407 823 5077
fMRI data and hypothesize that the difference of ADHD conditioned and control brains lies in the variation of DMN structural connections. fMRI data can be viewed as 4-D video such that the 3-D volume of brain is divided into small voxels and imaged for a certain duration. This in turn provides us the time-series of intensity values for each voxel. The correlation of these intensity time-series can be an indication of how synchronous the activities of two voxels are, and higher correlation values suggest that two voxels are working in synchronization. By computing correlations for all possible voxel pairs within a subject and establishing the connections between the voxel pairs based on high correlation values, a functional network structure is generated for each brain. A BoW approach is used to capture the network features such as degree of connectivity of each voxel, and to represent each network by a histogram. These histograms can be fed to a SVM for automatic classification of ADHD. In addition, raw intensity timeseries of the voxels can be clustered and represented as a histogram using the same approach. Experimental results verified that using combination of network features and raw intensity time-series histograms result in a better classification accuracy. The details of our approach is explained in Section 3 and the experimental results including the description of the used dataset are presented in Section 4.
2. RELATED WORK Many studies have been proposed to identify ADHD related defects. Most of them are group label analysis to deduce statistical differences between ADHD conditioned and control groups. Structural MRI analysis suggested that there are abnormalities in ADHD brains specifically in the brain areas such as frontal lobes, basal ganglia, parietal lobe, occipital lobe and cerebellum etc.5–8 In another set of studies, ADHD brains were analyzed using task-related fMRI data. Bush et al9 found significant low activity in the anterior cingulated cortex when ADHD subjects are asked to perform the Counting Stroop during fMRI. Durston et al10 showed ADHD conditioned children have difficulties in performing go/nogo task and have decreased activity in frontostriatal regions. Teicher et al11 showed boys with ADHD have higher T2 relaxation time in putamen which is directly connected to child’s capacity of sitting still. A third set of works was done using the resting state brain fMRI to find out the abnormalities in the DMN if any. Castellanos et al12 performed Generalized Linear Model based regression analysis on the whole brain with respect to three frontal foci of DMN and found low negative correlated activity in precuneus/anterior cingulated cortex in ADHD subjects. Among other studies, Tian et al13 found functional abnormalities in dorsal anterior cingulated cortex, Cao et al14 showed decreased regional homogeneity in the frontal-striatal-cerebellar circuits but increased regional homogeneity in the occipital cortex among the boys with ADHD. Zang et al15 verified decreased Amplitude of Low-frequency fluctuation (ALFF) in the right inferior frontal cortex, left sensorimotor cortex, bilateral cerebellum and the vermis as well as increased ALFF in the right anterior cingulated cortex, left sensorimotor cortex and bilateral brainstem. While group level analysis can suggest statistical differences among two groups, it may not be that useful for clinical diagnosis of individual level. There is not much work done on the individual level classification of ADHD subjects. Zhu et al16 used a PCA-FDA based classifier to separate ADHD subjects from control subjects. Unlike our network connectivity feature, which can connect all the synchronous regions of the whole brain, they used a regional homogeneity based feature for classification. Also the experiments were performed on only 20 subjects, which is not conclusive. In our work we have performed experiments on a large challenging dataset which includes subjects from different demography age groups and datasets capture in different test centers. We propose a new approach for the automatic classification and believe that our work will be helpful to the community.
3. METHOD The BoW approach, originated from natural language processing, allows a dictionary-based modeling of documents, and each document can be considered as a bag containing some words from the dictionary. This type of approach has also been popular in the Computer Vision area and has been applied to many problems such as image or video representation.17–19 In this paper, we introduce the BoW approach to the biomedical imaging community, specifically for processing functional brain networks.
1 N voxels
time Arranged into 2D matrix
4D data (fMRI)
Correlation Matrix ( NxN ) 0 Threshold
SVM Cross Validation
Clustering (BOW) Represent each subject by a Histogram
Feature Computation - 4-tuples: [x y z d] Degree Count per Node Position in 3D -Raw intensity time series
Adjacency Matrix (NxN)
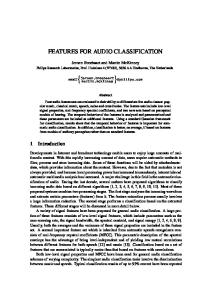
Figure 1. Overview of our approach: First from 4-D fMRI data, we compute an N-by-N matrix of correlation values between each pair of voxel time series (N is the number of voxels inside anatomical brain mask) Next, we compute the adjacency matrix of the voxels by thresholding the high correlation values. The features such as node degree and cycle for each node are used for BoW codebook generation. Finally, classification is done with a SVM.
Following the BoW representation, we treat each subject as a document. Features, which can be considered as words, are extracted from each voxel of the resting state fMRI scans of these subjects. A codebook is generated using the K-means clustering algorithm.20, 21 After the generation of the codebook, as the last step of the BoW method, we represent each subject with a histogram based on network features. The overview of our approach is depicted in Figure 1. As the first step of implementation, for each subject, we extract the time series of each voxel within the anatomical skull mask. For any two voxels, if the time series are u and v respectively, the correlation can be computed by, P P P (T Ti=1 ui vi ) − ( Ti=1 ui )( Ti=1 vi ) , (1) r=q P PT PT PT T [T i=1 u2i − ( i=1 ui )2 ][T i=1 vi2 − ( i=1 vi )2 ] where T is the length of the time series. For N number of voxels, a correlation matrix of size NxN is computed, where ith row of the matrix corresponds to the pairwise correlation values of the ith voxel with all other voxels within the subject. Setting the high correlation values to one and rest of the entries to zero, an adjacency matrix can be generated, where ith voxel is connected to all the voxels for which non-zero values are present in the it h row of the matrix. As the next step, a 3-D degree map is computed for these voxels,22 which captures how many voxels a given voxel is connected to. Basically, the value of the degree map at voxel i will be the number of voxels that voxel i is connected to. In order to reduce the volume of the computed data for each brain, we perform quantization using the BoW approach. Our feature vector is a 4-tuple [x, y, z, d], which consists of the 3-D spatial coordinates of a voxel and its degree that is defined by the degree map. Here, the x, y, z and d are normalized to have values between 0 and 1. For generating the codebook for BoW approach, we perform K-means clustering (K=100) of the 4-tuples across all the subjects and obtain the cluster centers, which form our histogram bins. The number of the clusters is the codebook size. After generation of the codebook, each 4-tuple feature of a subject is mapped to a certain
Features xy z d . . . . . . . . . . . . . . . . . . . . . . . .
Subject 2
xy z d . . . . . . . . . . . . . . . . . . . . . . . .
. . .
Subject 1
Subject M
K-Means Codebook 1 Clustering
xy z d . . . . . . . . . . . . . . . . . . . . . . . .
xy z d . . . . . . . . . . . . . . . . . . . . . . . . time series . . . . . . . . . . . . . . . . . . . . . . . . . . . . . . . . . . . .
Subject 2
time series . . . . . . . . . . . . . . . . . . . . . . . . . . . . . . . . . . . .
. . .
Subject 1
Subject M
Feature Quantization
Query Subject
Histogram 1
Combine Histograms
Final Histogram
time series . . . . . . . . . . . . . . . . . . . . . . . . . . . . . . . . . . . . K-Means Codebook 2 Clustering
Feature Quantization
Histogram 2
time series . . . . . . . . . . . . . . . . . . . . . . . . . . . . . . . . . . . .
Figure 2. Overview of our BoW approach.
cluster center, which should be the nearest neighbor of that feature. After all features of a subject are mapped to the cluster centers, the subject can be represented by a histogram of the codewords. The fMRI scan of a subject consists of a large number of intensity values. Therefore, we also apply the BoW approach on time series data of raw intensity values. Following the same steps as in the network features, we generate a codebook of 75 elements and we represent each subject by a histogram of 75 bins. The generation of histograms using BoW approach are shown in Figure 2. By normalizing and simply concatenating the two computed histograms for each subject as the final feature vector (175 dimensions), a Support Vector Machine (SVM)23 is trained for classification of ADHD conditioned and control subjects.
4. EXPERIMENTAL RESULTS We tested our approach on all 83 subjects from KKI center of ADHD-200 Global Competition Test Dataset. The preprocessed fMRI data, which was written into MNI space at 4 mm x 4 mm x 4 mm voxel resolution, nuisance variance removed, filtered using a bandpass filter (0.009 Hz < f < 0.08 Hz) and blurred with a 6-mm FWHM Gaussian filter, was provided by NITRC ADHD 1000 connectome project organizer. In the sample set, 22 subjects were diagnosed with ADHD and 61 subjects were healthy. We performed leave-one-out cross-validation, which involves using a single subject from the dataset for testing, and the remaining subjects for training our SVM classifier. Repeating this process as many times as the number of subjects; we used each subject in the dataset once as the validation data, and we obtained a classification accuracy of 65% (78% true positive and 39% false positive rate). The Receiver Operating Characteristic (ROC), which is obtained by varying the confidence of detection, is shown in Figure 3. For the comparison of classification accuracies using network features, raw intensity time series and the combined features, we performed a similar experiment on a larger subset of the ADHD-200 Global Competition Test Dataset, including 506 subjects. The brief description of the included subjects in this experiment is shown in Table 1. Using the combined features resulted in a performance improvement; we obtained 64% overall detection at the cost of 50% true positives and 72% true negatives as depicted in Figure 4. The classification accuracies for both experiments are illustrated in Table 2.
Receiver Operating Characteristics 100 90
True Positives Rate
80 70 60 50 40 30 20 10 0
0
10
20
30
40
50
60
70
80
90
100
False Positives Rate
Figure 3. Receiver Operating Characteristics (ROC) for our approach using degree map feature. Table 1. Description of the test subjects of the larger dataset.
Test
Number of
Number of ADHD
Number of
Female
Male
Center
Subjects
conditioned subjects
control subjects
KKI
83
22
61
37
46
Neuro Image
48
25
23
17
31
NYU part 1
55
31
24
19
36
NYU part 2
67
32
35
22
45
OHSU
79
37
42
36
43
Peking 1
85
24
61
49
36
Pittsburgh
89
0
89
43
46
5. CONCLUSION In conclusion, the Bag-of-Words, with a good performance of classification of ADHD diagnosed and control subjects, is a promising approach and it can be combined with different types of features for analysis of different brain disorders. Receiver Operating Characteristics 100
True Positives Rate
80
Degree Map Time Series
60
Combined (Degree Map + Raw Intensity Time Series)
40
20
0
0
20
40
60
80
100
False Positives Rate
Figure 4. Receiver Operating Characteristics curves for different combinations of features on 506 subjects.
Table 2. Results for ADHD classification.
Used Feature
Number of Subjects
Accuracy
Degree Map
83
65%
Degree Map
506
61%
Raw Intensity Time Series
506
56%
Degree Map+Raw Intensity Time Series
506
64%
ACKNOWLEDGMENTS We thank The Neuro Bureau, the ADHD 200 consortium, and Virginia Tech’s ARC for the released dataset.
REFERENCES [1] Smith, S. M., “Overview of fMRI analysis.,” Br J Radiol 77 Spec No 2 (2004). [2] Raichle, M. E., MacLeod, A. M., Snyder, A. Z., Powers, W. J., Gusnard, D. A., and Shulman, G. L., “A default mode of brain function,” Proceedings of the National Academy of Sciences of the United States of America 98(2), 676–682 (2001). [3] Raichle, M. E., “The brain’s dark energy.,” Scientific American 302(3), 44–49 (2010). [4] Weissman, D. H., Roberts, K. C., Visscher, K. M., and Woldorff, M. G., “The neural bases of momentary lapses in attention,” Nature Neuroscience 9(7), 971–978 (2006). [5] Castellanos, F. X., Giedd, J. N., Marsh, W. L., Hamburger, S. D., Vaituzis, A. C., Dickstein, D. P., Sarfatti, S. E., Vauss, Y. C., Snell, J. W., Lange, N., and et al., “Quantitative brain magnetic resonance imaging in attention-deficit hyperactivity disorder.,” Archives of General Psychiatry 53(7), 607–616 (1996). [6] Overmeyer, S., Bullmore, E. T., Suckling, J., Simmons, A., Williams, S. C., Santosh, P. J., and Taylor, E., “Distributed grey and white matter deficits in hyperkinetic disorder: Mri evidence for anatomical abnormality in an attentional network.,” Psychological Medicine 31(8), 1425–1435 (2001). [7] Sowell, E. R., Thompson, P. M., Welcome, S. E., Henkenius, A. L., Toga, A. W., and Peterson, B. S., “Cortical abnormalities in children and adolescents with attention-deficit hyperactivity disorder.,” Lance 362(9397), 1699–1707 (2003). [8] Seidman, L. J., Valera, E. M., Makris, N., Monuteaux, M. C., Boriel, D. L., Kelkar, K., Kennedy, D. N., Caviness, V. S., Bush, G., Aleardi, M., and et al., “Dorsolateral prefrontal and anterior cingulate cortex volumetric abnormalities in adults with attention-deficit/hyperactivity disorder identified by magnetic resonance imaging.,” Biological Psychiatry 60(10), 1071–1080 (2006). [9] Bush, G., Frazier, J. A., Rauch, S. L., Seidman, L. J., Whalen, P. J., Jenike, M. A., Rosen, B. R., and Biederman, J., “Anterior cingulate cortex dysfunction in attention-deficit/hyperactivity disorder revealed by fmri and the counting stroop.,” Biological Psychiatry 45(12), 1542–1552 (1999). [10] Durston, S., “Differential patterns of striatal activation in young children with and without adhd,” Biological Psychiatry 53(10), 871–878 (2003). [11] Teicher, M. H., Anderson, C. M., Polcari, A., Glod, C. A., Maas, L. C., and Renshaw, P. F., “Functional deficits in basal ganglia of children with attention-deficit/hyperactivity disorder shown with functional magnetic resonance imaging relaxometry.,” Nature Medicine 6(4), 470–473 (2000). [12] Castellanos, F. X., Margulies, D. S., Kelly, C., Uddin, L. Q., Ghaffari, M., Kirsch, A., Shaw, D., Shehzad, Z., Di Martino, A., Biswal, B., and et al., “Cingulate-precuneus interactions: a new locus of dysfunction in adult attention-deficit/hyperactivity disorder,” Biological Psychiatry 63(3), 332–337 (2008). [13] Tian, L., Jiang, T., Wang, Y., Zang, Y., He, Y., Liang, M., Sui, M., Cao, Q., Hu, S., Peng, M., and et al., “Altered resting-state functional connectivity patterns of anterior cingulate cortex in adolescents with attention deficit hyperactivity disorder.,” Neuroscience Letters 400(1-2), 39–43 (2006). [14] Cao, Q., Zang, Y., Sun, L., Sui, M., Long, X., Zou, Q., and Wang, Y., “Abnormal neural activity in children with attention deficit hyperactivity disorder: a resting-state functional magnetic resonance imaging study.,” NeuroReport 17(10), 1033–1036 (2006).
[15] Zang, Y.-F., He, Y., Zhu, C.-Z., Cao, Q.-J., Sui, M.-Q., Liang, M., Tian, L.-X., Jiang, T.-Z., and Wang, Y.-F., “Altered baseline brain activity in children with adhd revealed by resting-state functional mri.,” Brain & Development 29(2), 83–91 (2007). [16] Zhu, C.-Z., Zang, Y.-F., Cao, Q.-J., Yan, C.-G., He, Y., Jiang, T.-Z., Sui, M.-Q., and Wang, Y.-F., “Fisher discriminative analysis of resting-state brain function for attention-deficit/hyperactivity disorder,” NeuroImage 40(1), 110 – 120 (2008). [17] Leung, T. and Malik, J., “Representing and Recognizing the Visual Appearance of Materials using Threedimensional Textons,” International Journal of Computer Vision 43, 29–44 (June 2001). [18] Fei-Fei, L. and Perona, P., “A Bayesian hierarchical model for learning natural scene categories,” in [Computer Vision and Pattern Recognition, 2005. CVPR 2005. IEEE Computer Society Conference on ], 2, 524 – 531 vol. 2 (June 2005). [19] Liu, J. and Shah, M., “Learning human actions via information maximization,” in [Computer Vision and Pattern Recognition, 2008. CVPR 2008. IEEE Conference on ], 1 –8 (June 2008). [20] Ahrens, H., “Seber, G. A. F.: Multivariate Observations. J. Wiley & Sons, New York 1984, xx, 686 s. 48, 50,” Biometrical Journal 28(6), 766–767 (1986). [21] Spath, H., [The Cluster Dissection and Analysis Theory FORTRAN Programs Examples], Prentice-Hall, Inc., Upper Saddle River, NJ, USA (1985). [22] Cecchi, G. A., Rao, A. R., Centeno, M. V., Baliki, M., Apkarian, A. V., and Chialvo, D. R., “Identifying directed links in large scale functional networks: application to brain fMRI.,” BMC Cell Biol 8 Suppl 1 (2007). [23] Chang, C.-C. and Lin, C.-J., “LIBSVM: A library for support vector machines,” ACM Transactions on Intelligent Systems and Technology 2, 27:1–27:27 (2011). Software available at http://www.csie.ntu.edu.tw/ cjlin/libsvm.