ORGANIZACIÓN: ESTRATEGIA
A STRATEGIC ANALYSIS OF THE NATURAL GAS MARKET IN PORTUGAL Paula Varandas Ferreira (
[email protected]) M. Isabel R T. Soares (
[email protected]) M. Madalena T. Araújo (
[email protected]) Minho University Department of Production and Systems Azurém 4800-058 Guimarães Portugal Faculdade de Economia do Porto Rua Dr. Roberto Frias 4200-464 Porto Portugal RESUMEN/ ABSTRACT The relative prices of the different energy forms is, without any doubt, essential in the strategic decision making process of the industrial sector. In the domestic sector, this is also a fundamental matter due to the increasing demand for better life quality, allied to a continuous search for cost minimisation. The natural gas market in Portugal is still protected and monopolistic but, most of the other European countries have already liberalised their natural gas markets, at le ast partially. This work analyses the natural gas prices strategies followed by Portuguese companies, and a comparison to the liberalised Europe is also attempt. Special attention is given to the United Kingdom, as an example of a complete liberalised market. Following these results, possible future scenarios for Portugal in a liberalisation context are presented. PALABRAS CLAVES/ KEY WORDS: Natural gas, price strategies, liberalisation 1. INTRODUCTION Natural gas is nowadays the primary energy source with the highest growing potential worldwide. Its recent introduction in Portugal, was motivated by three strategic key factors (DGE, 2002): § § §
Supply security, allowing the diversification of energy suppliers and reducing the oil dependence. Competitiveness, allowing the access to new and more efficient technologies. Environmental concerns, since the combustion of natural gas is less polluting than coal or oil combustion.
By the end of 1997, the natural gas consumption in Portugal was initiated. As shown in figure 1, in 2000 it already represented 8.6% of total primary energy, overcoming all the government forecasts (Ministério da Industria e Energia, 1995). It is also important to notice that the electric energy production industry is the biggest natural gas consumer, and without any doubt, this sector still plays a major rule in the project viability.
477
Consumption of primary energy Coal 3845 Oil 15487 Electricity 1109 Natural gas 2034 Other products 1224 Total 23669
Consumption for electricity production Coal 3206 Oil 1789 Natural gas 1171 Other products 421 Renewable energy 1029 Total 8416
Other consumption of primary energy Coal 133 Oil 750 Natural gas 72 Other products -263 Total 662
Coal 506 Industry 3 Agri . & Fish. Construction Transportation Household Service Total 506
Consumption of final energy Coal 506 Oil 12948 Electricity 3300 Natural gas 791 Other products 1066 Total 18611
1
Oil 2 3947 632 706 6452 721 490 12948
Electricity 1266 61 48 40 865 1020 3300
Natural gas 659
1 73 58 791
Others 570
479 17 1066
Total 6948 693 754 6493 2138 1585 18611
1- Includes the production of new energy forms, the consumption and lost of the energy sector and statistical arrangements 2- Includes row material consumption of 1650 3- Agriculture and Fishery
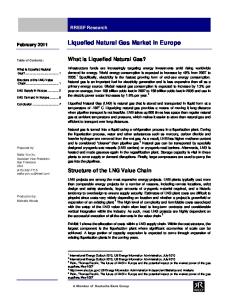
Figure 1- Energy balance 2000 (103 tones of oil equivalent- toe) (Source: DGE- Direcção Geral de Energia) The natural gas industry is composed by the following main elements: production, transportation, wholesale market, supply and distribution. Figure 2, represents the natural gas value chain in Portugal, presenting also the companies that operate in each of these industry elements. VALUE CHAIN Upstream Production External elements to National market
Production
Storage Transgás Transportation Transgás Distribution
Portgás
Lusitaniagás
Transgás Portgás
Distribution Setgás Lisboagás Tagusgás Beiragás
Lusitaniagás
Supply Setgás Lisboagás Tagusgás Beiragás
Supply
Domestic sector
Industrial sector
Energy production
Figure 2- Natural gas value chain in Portugal (Based on : Oxera, 2000) The natural gas is imported from Algeria (gaseous) and from Nigeria (liquefied) by Transgás, which also have the exclusive right to transport the high-pressure gas and to supply the distribution companies and the major national consumers. Each one of the distribution companies, operate in a regional monopoly distributing the lowpressure gas and supplying all the market sectors. Analysing the ownership structure of each of these privately owned independent companies, it is possible to conclude that the Galp Energia Group (formed in 1999 by the fusion of Petrogal and Gas de Portugal) is the largest stakeholder of all the distribution companies and the exclusive owner of the transport company. This way, Galp Energia effectively controls all the Portuguese natural gas market. It is also important to notice that, this group also dominates the oil sector, once it is the exclusive owner of Petrogal (company that operates in the
478
oil exploration, trading and supply) and has also some interests in the electricity field, once one of its stakeholders is EDP- Electricidade de Portugal (the largest electricity company in Portugal), operating also in the co-generation area. Following the European Union recommendations1 , most of the state members have already begin the liberalisation process of their energy markets. Portugal was no exception, at least in what electricity is concerned. This market sector has been opening progressively. October 2002, a 45% market opening was accomplished (Commission of the European Communities, 2002) 2 . Being the Portuguese natural gas market quite young it benefits from the possibility of derogations, predicted in Directive 98/30/EC for countries where the consumption has been initiated for less than 10 years ago. So, according to the present scheduling, the liberalisation of this market is predicted to begin by the end of 2007. Till then, the Portuguese market is characterized by a national monopoly for import and transportation and by regional monopolies for distribution and supply. The domestic prices are proposed by the companies, but they must be approved by the Ministry of Economy. The industrial prices are negotiated between the parts involved. It is then assumed, that the competition between the natural gas and the remaining energy forms assures that there will be no type of market power abuse by the monopolistic companies. The aim of this paper is to analyse the present pricing strategies of the natural gas companies. In the following section of this work a comparative analysis of the energy prices in Portugal is presented, including the domestic and the industrial consumers. In section 3 the natural gas market in Portugal will be compared with the European Union and especially with United Kingdom, as an example of a complete liberalised market. The main conclusions are summarised in section 4. 2. ANALYSIS OF THE NATURAL GAS PRICES IN PORTUGAL 2.1 DOMESTIC SECTOR For the domestic sector, this analysis includes the natural gas, the electricity and propane gas prices, considering the average prices on the 3rd quarter of 20013 . The average prices were calculated for consumers categories presented in Table 1. Table 1- Consumer categories for natural gas, electricity and propane gas in the domestic sector Natural gas 1 Consumer Total consumption (kWh/year)
D1 D2 D3
2324 4649 23244
Consumer
Da Db Dc Dd De
Electricity 2 Contracted Total Power consumption (kWh/year)
1,15 kVA 3,45 kVA 6,9 kVA 10,35 kVA 13,8 kVA
600 1200 3500 7500 20000
Night consumption (kWh/year)
--1300 2500 15000
Propane gas 3 Consumer Total consumption (kWh/year)
D1p D2p D3p
2332 4664 9328
1
This consumers categories and average prices were obtained in DGE site.4 This consumers categories were defined by the authors, based on Eurostat. The average prices were calculated by the authors using EDP price list. 3 This consumers categories were defined by the authors, and the average prices were calculated using the price list of one regional distribution company. 2
The average prices, for each of the listed consumer categories are presented in figure 3. The results indicate that the natural gas prices are inferior to the electricity prices and to the propane gas prices, for every consumer category. As it would be expected, the smallest prices are associated with the larger consumers for every energy source analysed, but it is worth noticing that the D1 prices (small gas consumers) are inferior to the De prices (large electricity consumers) and to the D3p prices (large propane gas consumers).
1
Directive 96/92/CE defines the basic rules for liberalisation of electricity markets and directive 98/30/CE defines the basic rules for liberalisation of the natural gas markets. 2 In January 2003 It is expected the complete integration of the Spanish and Portuguese electricity markets, and its full opening to competition. 3 Data analysis from 1998 till 2001 is available under request from the authors. 4 www.dge.pt
479
0.16
0.14 ELECTRICITY
NATURAL GAS
PROPANE GAS
0.12
Euro / kWh
0.1
0.08
0.06
0.04
0.02
0 Da
Db
Dc
Dd
De
D1
D2
D3
D1p
D2p
D3p
Figure 3- Average domestic energy prices in Portugal (2001) The higher propane prices, allied with the similar combustion efficiency of propane and natural gas and with the small conversion costs, have been leading to the quick residence conversion to natural gas, and consequent reduction of the propane consumption in the domestic sector (DGE, 2002). We can expect that the domestic propane consumption will be confined to the geographic areas with no access to the natural gas or to older residences lacking a gas pipe system. The conversion of electricity consumptions to natural gas is not as simple as it is from propane to natural gas. It involves high costs and some of the electricity consumptions can not be easily replaced by gas (see the example of lightning), meaning that the electricity have captive consumes. However, it is possible and worthwhile, to replace part of the electricity consumption, like water and environmental heating, especially in the case of small/medium electricity consumers and in new residences. 2.2 INDUSTRIAL SECTOR For the industrial sector, this analysis includes the natural gas, the electricity, the propane and the fuel oil prices, considering the average prices on the 3rd quarter of 20015 . The average prices were calculated for consumer categories presented in Table 2. The fuel oil prices are not available for several consumer categories, so the average price obtained in the Oil Bulletin published monthly by the European Commission6 was used. Table 2- Consumers categories for natural gas, electricity and propane gas in the domestic sector Natural gas 1 Electricity 2 Propane gas 3 Consumer Total Consumer Contracte d Total Consumer Total consumption Power consumption consumption (kWh/year) (kWh/year) (kWh/year) I1 116245 Ia 34,5 kVA 33000 I1p 116245 I2 1162452 Ib 50 kW 50000 I2p 1162452 I3 11624522 Ic 100 kW 160000 I3p 11624522 I4 116245220 Id 500 kW 1250000 I4p 116245220 Ie 500 kW 200000 If 2500 kW 1000000 Ig 4000 kW 2400000 Ih 10000 kW 5000000 Ii 10000 kW 7000000 1
These consumer categories and average prices were obtained in DGE site These consumer categories were defined by the authors, based on Eurostat . The average prices were calculated by the authors using EDP price list. 3 These consumer categories were defined by the authors, and the average prices were calculated using the price list of the industrial distribution company. 2
5 6
Data analysis from 1998 till 2001 is available under request from the authors. http://europa.eu.int/comm/energy/en/oil/bulletin_en.html
480
The average prices, for each of these consumer categories are presented in figure 4. The results indicate that the natural gas prices are inferior to the electricity prices or to the propane gas prices, for every consumer category, but they are higher than the fuel oil prices for most of the natural gas consumer categories. 0.14
0.12 ELECTRICITY
NATURAL GAS
PROPANE GAS
FUEL OIL
Euro / kWh
0.1
0.08
0.06
0.04
0.02
Heavy FO
Light FO
I4p
I3p
I2p
I1p
I4
I2
I3
I1
Ii
Ih
Ig
If
Ie
Ic
Id
Ib
Ia
0
Figure 3- Average industrial energy prices in Portugal (2001) As in the domestic sector, the propane prices are leading to a quick decay of its consumption in the geographic areas with access to natural gas (DEG, 2002). The industrial processes which need a clean energy source can, easily and with a small cost, replace the propane gas by natural gas, obtaining a substantial reduction of its energetic costs. In what concerns the electricity consumption, in spite of its prices being higher than the natural gas prices, the industrial conversion has the problem of high costs as well as the electrical captive consumptions. Only the heavy and light fuel oil present competitive prices in relation to the natural gas. The fuel oil prices are higher to the natural gas only in case of large gas consumers. However, it is likely that large fuel oil consumers have access to prices lower than the average ones used in this analysis; which would mean that the natural gas prices are higher than the fuel oil prices for all consumer categories. These liquid fuels, present not only this cost advantage, but also benefit from the fact of being on the market for many years, covering in 2000, 21% of the industrial energetic needs in Portugal (DGE, 2002). In the future, we can foresee an environmental tax imposition charging the most pollutant fuels, which would lead to the rise of the fuel oil prices. The fuel oil environmental and maintenance disadvantages coupled with the higher efficiency combustion of the natural gas, will be the key factors for the future natural gas entrance in the fuel oil market. The market liberalisation predicted to 2008, will allow the entrance of new competitors and it is possible that the incumbent companies will change theirpresent price strategies, namely reducing the natural gas prices to levels near the European average, as it occurred in the electrical sector7 . 3. COMPARATIVE ANALYSIS OF THE NATURAL GAS MARKET STRATEGIES Although in Portugal the liberalisation of the natural gas has been a delayed matter, most of the European countries are moving to the full opening of their markets. It is important to emphasise the United Kingdom (UK) market, which was pioneer in this processes and where the full opening has been already achieved. It is now possible in UK for every consumer of electricity or natural gas, to choose his supplier. The UK natural gas markets, evolved from a vertical integrated monopolistic structure, to the full competition on the production and supply stages, allowing in 2002 the existence of 93 natural gas licensed suppliers. The prices 7
In 1995, the average electricity prices in Portugal were 47% superior to the European average for the domestic sector, and 19% for the industrial sector. After the liberalisation, this difference was reduced to 10% for the domestic sector and 12% for the industrial sector in 2001 (Commission of the European Communities, 2001).
481
development seem to favour to the introduction of competition, since in UK natural gas prices tend to be inferior to the European average and have one of the higher levels of customer switching (Commission of the European Communities, 2002). This process also led to the development of new contractual mechanisms, with higher flexibility and shorter term, creating new spot markets for gas selling (Juris, 1998). It is however interesting to notice that the UK market opening, did not lead to vanish vertical integrated companies from the energy markets. Actually, companies like British Gas or BP (and others) take active part in several stages of the natural gas value chain. They can be producers, suppliers or shippers. Also, many companies participate in parallel activities like oil and natural gas prospecting, electricity generation, or natural gas and electricity supplying. However, there is a crucial difference between these integrated structures and the Portuguese one (present in the Galp Energia Group): the existence of true competition between all the companies in UK. Portugal can follow, in the future, a similar strategy to the one adopted in the UK. The production competition can be replaced by the competition on gas imports, especially in the liquefied form, once presently only Transgás is allowed to operate in the import and storage activities. The companies present in the future liberalised market, can also consider the possibility to participate in several stages of the natural gas value chain or, to operate with different energy forms. From the previous price analysis for Portugal, we concluded that the natural gas present high competitive prices, in relation to the electricity or propane gas but the fuel oil prices are still inferior to the natural gas ones. In the UK, the electricity prices are substantially higher than the natural gas prices, for both the domestic and the industrial sector. On average, the electricity prices are 309% higher than the natural gas prices in the domestic sector, and 284% higher than the industrial sector. Although the fuel prices were smaller than the natural gas prices during the beginning of the nineteen's, after 1994 this relationship was inverted and the fuel oil prices are now about 29% higher than the natural gas prices 8 . The price differences in Portugal, are lower than the ones in the UK. In Portugal, on average, the electricity prices are about 95% higher than the natural gas prices in domestic sector, and 155% in the industrial sector. This is especially relevant, when considering that the Portuguese electricity prices are among the highest in Europe. The fuel oil prices are higher than the natural gas prices in about 33%. Comparing the natural gas prices in Portugal with the average prices of the liberalised European markets, it is possible to conclude that the Portuguese prices are about twice the European value for the domestic sector, and about 65% higher than the European prices for the industrial sector9 . Analysing these results, we can conclude that the present gas companies seem to follow a strategy of profit maximisation, in the pre-liberalisation period. They practice prices sufficiently low to allow them to capture some clients from the electricity and propane market, but they still maintain their prices above the European ones. To capture clients from the fuel oil market, the natural gas companies do not seem to intend to follow a price reduction strategy. The clients will probably be attracted by the environmental and other technical advantages associated with the cleaner combustion process. In the future, the liberalisation of the natural gas market in Portugal will imply taking decisions, assuring the market power reduction of all the present companies and, in particular of the Galp Energia Group. We can expect to assist to a development similar to other European countries, such as the UK or more recently Spain. In the UK, for example it was necessary to impose in 1989, a maximum amount of natural gas that could be contracted by the British Gas company (90% of total deliveries from any field in UK continental shelf) and this company was also obliged to respect quantitative targets of loss of market share. More recently in Spain in June 2000, it was decided that no single operator could have a market share higher than 70% of total market consumption in 2004. In 2001 it was also established a gas release program for 25% of gas imported from Algeria (Dri Wefa, 2001). Considering these examples and the present market structure in Portugal, possible future liberalisation scenarios could include: 8 9
Values based on information from the Department of Trade and Industry for 2001 (www.dti.gov.uk) Values based on information from the Commission of the European Communities (2001).
482
§
§ § § §
The creation of a regulatory organism preventing situations like market power abuse that could affect not only the natural gas market, but also the petroleum market and the electricity market. This problem is especially important for the electricity due to the expected growing use of natural gas for electricity generation. The ownership unbundling of the natural gas industry, as it is recommended by some international organisms (Commission of the European Communities, 2002 and International Energy Agency, 2001). The imposition of maximum market shares for the dominant companies. A gas program release for the imported gas by Transgás and/or the loss of exclusivity in gas imports. A regulated Third Party Access to the transportation and distribution networks.
In relation to the future strategies of the present natural gas companies in a liberalised market we can expect a price reduction and an increase on the contractual flexibility, allowing a higher degree of costumer activity in terms of switching between natural gas suppliers or between different energy forms. We can also foresee the development of new market mechanisms, in case of the present companies committed with long term take-o rpay buying contracts, are obliged to re-sell their contracted gas (due to regulatory or competitive restrictions), as it occurred in the UK. The present companies can also follow a diversification strategy, acting in several activities of the energy market, following the example of the British Gas strategy. The electricity market will be increasingly associated with natural gas market, due to the expected development of power generation from natural gas, consolidating a gas-to-power strategy in Portugal. This will make the companies participation in both electricity and natural market specially advantageous, which can lead to future partnerships between the natural gas companies and EDP Group or other independent producers. 4. CONCLUSION Following these results, it is clear that the present monopolistic structure allows the Portuguese natural gas companies to practice a price strategy that would hardly be possible in a competitive market. Considering examples of other countries in the European Union, future possible scenarios for Portugal were defined. The effectiveness of the liberalisation process will depend on what will be the future State intervention. The regulatory system will have a fundamental role in the achievement of a reasonable number of competitors on the market. With the development of the Iberian Energy Market, Spanish companies can also be a significant active part, contributing to the Portuguese market dynamization and to the harmonisation of tariffs. Meanwhile, it seems obvious that the implementation of the Iberian Electricity Market and full liberalisation of the Spanish natural gas market will carry out the anticipation of the Portuguese natural gas market liberalisation. Due to its present market structure and to the liberalisation perspectives, Portugal is a very interesting case study. It is possible to analyse and monitor the development of the energy market, studying the pricing policies followed by the natural gas companies before and after the liberalisation and how it did affect the other energy prices. BIBLIOGRAPHY Commission of the European Communities (2002), "Second report on the implementation of the internal electricity and gas market”, Commission Staff Working Paper, SEC(2002) 1038 Commission of the European Communities (2001), "Completing the internal energy market”, Commission Staff Working Paper, SEC(2001) 438 DGE (2002), O gás natural em Portugal: Uma perspectiva integrada (www.dge.pt) Dri Wefa (2001) "Report for the European Commision to determine changes after opening of the gas market in August 2000", Vol II: Country Reports, July 2001 Ferreira, P. (2002) "O gás natural a caminho da liberalização: Uma contribuição através da metodologia VAR", Dissertação de Mestrado, Faculdade de Economia do Porto International Energy Agency (2001), Energy policies of Portugal. 2000 Review Juris, A. (1998), "Market development in the United Kingdom's natural gas industry", Policy Research Working Paper 1890, World Bank Ministério da Indústria e Energia (1995), "Energia 1995-2015. Estratégia para o sector energético", DGE, Lisboa
483
Oxera (2000), Energy liberalisation indicators in Europe, October 2000 (www.dti.gov.uk) http://europa.eu.int/comm http://europa.eu.int/comm/energy/en/oil/bulletin_en.html http://europa.eu.int/eur-lex/en/index.html www.dge.pt www.dti.gov.uk www.iea.com
484