A MULTI-OBJECTIVE GENETIC ALGORITHM TO SOLVE SINGLE MACHINE SCHEDULING PROBLEMS USING A FUZZY FITNESS FUNCTION
A thesis presented to the faculty of the Fritz J. and Dolores H. Russ College of Engineering and Technology of Ohio University
In partial fulfillment of the requirement for the degree Master of Science
David M. Allard June, 2007
This thesis entitled A MULTI-OBJECTIVE GENETIC ALGORITHM TO SOLVE SINGLE MACHINE SCHEDULING PROBLEMS USING A FUZZY FITNESS FUNCTION
by DAVID M. ALLARD
has been approved for the Department of Industrial and Systems Engineering and the Russ College of Engineering and Technology by
_____________________________________________________________ Gürsel A. Süer Professor of Industrial and Systems Engineering
______________________________________________________________ Dennis Irwin Dean, Russ College of Engineering and Technology
Abstract ALLARD, DAVID M., M.S., June 2007. Industrial Systems Engineering A MULTI-OBJECTIVE GENETIC ALGORITHM TO SOLVE SINGLE MACHINE SCHEDULING PROBLEMS USING A FUZZY FITNESS FUNCTION (103 PP.) Director of Thesis: Gürsel A. Süer This thesis tested the feasibility of using fuzzy membership functions to model the fitness in of the chromosomes in a genetic algorithm to solve multi-objective optimization problems. The problem domain chosen for this thesis was the single machine scheduling problem, and the performance measures investigated were number of tardy jobs, total tardiness, maximum tardiness and average flow time. Two fuzzy membership shapes and three fitness types were investigated, yielding a total of six possible fitness functions. The fuzzy fitness function proved to be a feasible method for modeling the performance of chromosomes in this genetic algorithm. The genetic algorithm obtained the highest average fitness value when the combination of linear shape and hybrid type were used to form the fitness function. However, there was no statistically significant difference between linear-hybrid and parabolic-hybrid or parabolic summation. This thesis also investigated a heuristic based block crossover technique. This technique proved to be a superior method of generating new solutions when compared to classic single point crossover. The new technique uses a heuristic to determine which genes are “good” and then passes those genes to the children of the next population. Finally, this thesis implements the fuzzy fitness concepts to model decision making in a multi-person environment. This was accomplished by defining a fitness function that reflects the priorities for each decision maker. Then each decision maker’s fitness function is used to obtain a solution set. Finally, the solution sets are pooled together and a final solution is obtained to minimize dissatisfaction amongst the decision makers. Approved: ______________________________________________________________ Gürsel A. Süer
Acknowledgements I would like to thank my family for all of their love, support and encouragement throughout my personal and academic life. None of the great achievements I have made would have been possible without your patients, love and support. I am eternally grateful for everything you have done for me. I would like to thank my advisor Dr. Gürsel A. Süer for the opportunity of working with him over the last few years. His support and guidance has allowed me to complete one of my goals in life. Without his help, completion of this goal would have been much more difficult. Working under Dr. Süer for the duration of my graduate studies has been a great experience. I have gained a great deal of insight to engineering which is invaluable. I would also like to thank all of the wonderful new friends I have made throughout my graduate school experience, especially Amanda Houchin, Royston Lobo and Vinay Patil. Your support and friendship has helped me through the tough times and I am very grateful. Thank you all very much and I hope the friendships we have formed will continue throughout our lifetimes.
5 Table of Contents Abstract……………………………………………………………………………3 Acknowledgements……………………………………………………………….4 List of Tables……………………………………………………………………..9 List of Figures……………………………………………………………………10 1
INTRODUCTION....................................................................................... 11 1.1
1.1.1
Single Machine Scheduling .............................................................. 11
1.1.2
Parallel Machine Scheduling ............................................................ 13
1.1.3
Flow Shop Scheduling ...................................................................... 13
1.1.4
Job Shop Scheduling......................................................................... 14
1.1.5
Manufacturing Cell Scheduling ........................................................ 14
1.1.6
Assembly Line Balancing ................................................................. 14
1.1.7
Scheduling Problem Objectives........................................................ 15
1.2
SINGLE-MACHINE SCHEDULING OBJECTIVES ................................................. 15
1.2.1
Mathematical Definitions.................................................................. 16
1.2.2
Example Problem.............................................................................. 17
1.3
2
MANUFACTURING SCHEDULING ..................................................................... 11
GENETIC ALGORITHMS ................................................................................... 18
1.3.1
Crossover .......................................................................................... 19
1.3.2
Mutation............................................................................................ 20
1.3.3
Selection............................................................................................ 20
1.3.4
Termination....................................................................................... 21
1.4
FUZZY THEORY ............................................................................................... 21
1.5
MULTI-OBJECTIVE OPTIMIZATION.................................................................. 23
1.6
OBJECTIVE....................................................................................................... 23
LITERATURE REVIEW .......................................................................... 25 2.1
SINGLE MACHINE SCHEDULING ...................................................................... 25
2.1.1
Total Weighted Tardiness ................................................................. 25
6 2.1.2
Minimizing nT with Non-zero Ready Times..................................... 26
2.1.3
Minimizing Favg with Non-zero Ready Times .................................. 27
2.1.4
Minimizing Tmax with Non-zero Ready Times ................................. 28
2.1.5
Total and Maximum Tardiness Pareto-Optima................................. 28
2.1.6
Fuzzy Parameters .............................................................................. 29
2.2
MULTI-OBJECTIVE GENETIC ALGORITHMS .................................................... 30
2.2.1
Pareto Sets......................................................................................... 30
2.2.2 MOGA VEGA Techniques............................................................... 31 2.2.3 2.3
3
FUZZY SETS ..................................................................................................... 32
2.3.1
Membership Functions...................................................................... 33
2.3.2
Fuzzy Multi-Criteria Decision Making............................................. 34
2.3.3
Fuzzy Aggregation Models............................................................... 34
PROBLEM STATEMENT ........................................................................ 36 3.1
FUZZY FITNESS FEASIBILITY........................................................................... 36
3.2
BLOCK CROSSOVER ........................................................................................ 36
3.2.1
Tardiness Heuristic ........................................................................... 37
3.2.2
Waiting Time Heuristic..................................................................... 37
3.3
4
Mixer Approach ................................................................................ 32
SIMULATION OF MULTI-DECISION MAKER ENVIRONMENT............................ 37
METHODOLOGY ..................................................................................... 39 4.1
GENETIC ALGORITHM ..................................................................................... 39
4.1.1
Chromosome Definition.................................................................... 39
4.1.2
Initial Population............................................................................... 40
4.1.3
Selection and Mating ........................................................................ 40
4.1.4
Crossover and Repair........................................................................ 41
4.1.4.1
Classical Crossover ......................................................................................... 41
4.1.4.2
Block Crossover ............................................................................................... 42
4.1.4.3
Gene Detection................................................................................................. 43
4.1.4.4
Repair............................................................................................................... 44
4.1.5
Mutation............................................................................................ 45
7 4.1.6 4.2
FUZZY FITNESS ............................................................................................... 45
4.2.1
Fuzzy Membership Shapes ............................................................... 46
4.2.1.1
Linear ............................................................................................................... 46
4.2.1.2
Parabolic.......................................................................................................... 47
4.2.2
Fuzzy Fitness Type ........................................................................... 47
4.2.2.1
Minimum .......................................................................................................... 47
4.2.2.2
Summation........................................................................................................ 48
4.2.2.3
Hybrid .............................................................................................................. 48
4.2.3
5
6
7
Replacement...................................................................................... 45
Fuzzy Fitness Example ..................................................................... 49
4.3
MULTI-DECISION MAKER SIMULATION .......................................................... 50
4.4
JAVA IMPLEMENTATION .................................................................................. 51
4.4.1
Main Window ................................................................................... 51
4.4.2
Experiment Window ......................................................................... 52
4.4.3
Execution Window............................................................................ 53
RESULTS .................................................................................................... 55 5.1
PHASE 1 – FUZZY FITNESS .............................................................................. 56
5.2
PHASE 2 – BLOCK CROSSOVER EFFECT .......................................................... 58
5.3
PHASE 3 – EFFECT OF FUZZY MEMBERSHIP SHAPE AND TYPE ....................... 60
5.4
PHASE 4 – MULTI-DECISION MAKER SIMULATION......................................... 62
5.4.1
Decision Maker Profiles ................................................................... 62
5.4.2
Experimental Results ........................................................................ 66
CONCLUSIONS ......................................................................................... 67 6.1
FUZZY FITNESS ............................................................................................... 67
6.2
BLOCK CROSSOVER ........................................................................................ 68
6.2.1
Tardiness ........................................................................................... 68
6.2.2
Waiting Time .................................................................................... 68
6.3
MULTI-DECISION MAKER SIMULATION .......................................................... 69
6.4
FUTURE WORK ................................................................................................ 69
REFERENCES............................................................................................ 71
8 8
APPENDIX.................................................................................................. 74 8.1
MAXIMUM GENERATION VERSUS POPULATION SIZE RESULTS ...................... 74
8.2
CROSSOVER VERSUS MUTATION RESULTS ..................................................... 79
8.3
BLOCK CROSSOVER RESULTS ......................................................................... 85
8.3.1
Without Block Crossover.................................................................. 85
8.3.2
Block Crossover Waiting Time Heuristic......................................... 87
8.3.3
Block Crossover Tardiness Heuristic................................................ 89
8.4
SHAPE VERSUS TYPE RESULTS........................................................................ 91
9 List of Tables Table 1-1 - Example Data ................................................................................................. 17 Table 5-1 - Job Data Sets .................................................................................................. 55 Table 5-2 - Mutation/Crossover Fitness Table ................................................................. 56 Table 5-3 – t-Test Results for Crossover versus Mutation ............................................... 57 Table 5-4 – Population Size/#Generations Fitness Table ................................................. 57 Table 5-5 – Block Crossover Effect Table ....................................................................... 58 Table 5-6 – Fuzzy Membership Results ........................................................................... 60 Table 5-7 – Fuzzy Membership Fitness Results ............................................................... 61 Table 5-8 - t-Test Results for Fitness Shape and Type..................................................... 61 Table 5-9 – Profile Set 1 ................................................................................................... 62 Table 5-10 - Profile Set 2.................................................................................................. 63 Table 5-11 - Profile Set 3.................................................................................................. 63 Table 5-12 - Profile Set 4.................................................................................................. 64 Table 5-13 - Profile Set 5.................................................................................................. 65 Table 5-14 - Profile Set 6.................................................................................................. 65 Table 5-15 - Multi-Decision Maker Results ..................................................................... 66
10 List of Figures Figure 1-1 – Solution Complexity Graph ......................................................................... 12 Figure 1-2 – Parallel Machine Layout .............................................................................. 13 Figure 1-3 - Example Gantt Chart .................................................................................... 18 Figure 1-4 – Tall Membership Function........................................................................... 22 Figure 4-1 – Chromosome Representation ....................................................................... 39 Figure 4-2 – Classical Crossover Description .................................................................. 41 Figure 4-3 - Block Crossover Example ............................................................................ 43 Figure 4-4 – Repair Operation .......................................................................................... 44 Figure 4-5 – Mutation Operation ...................................................................................... 45 Figure 4-6 – Linear Membership Function....................................................................... 46 Figure 4-7 – Fuzzy Membership Function........................................................................ 47 Figure 4-8 - Fuzzy Fitness Evaluation .............................................................................. 49 Figure 4-9 - Main Window Screenshot............................................................................. 51 Figure 4-10 - Experiment Window Screenshot ................................................................ 53 Figure 4-11 - Execution Window Screenshot................................................................... 54
11 1
INTRODUCTION In this chapter an overview of the topics is presented, as well as previous work
that is pertinent to the topics herein. This chapter provides background for the problem and shows why this research is relevant. Additionally, this chapter shows that this is a unique work in the field of Industrial Engineering. 1.1 Manufacturing Scheduling Scheduling is the process of assigning limited resources to a set of tasks over a period of time. The resources may be machines in a workshop, runways at an airport and crews at a construction site, as well as processing units in a computing environment, and so on. The tasks may be operations in the production process, take-offs and landings at an airport, stages in a construction project, executions of computer programs, and so on [1]. The goal of scheduling is to assign resources to the tasks such that one or more objectives are optimized. Scheduling becomes an important concern when resources are limited and need to be utilized to complete many competing tasks efficiently. Within manufacturing scheduling, there are many different types of problem classes. These include single machine, parallel machine, flow shop, job shop, manufacturing cells and assembly line scheduling problems. Each of these problem classes is unique, and each has its own constraints and objectives. A more detailed description of each problem class is given in the following sections. 1.1.1
Single Machine Scheduling
The single machine scheduling problem involves scheduling a set of tasks to a single resource. This is accomplished by determining a sequence that includes each task,
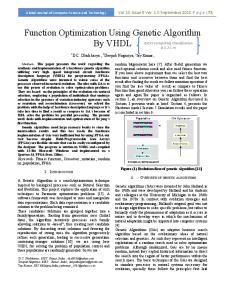
12 and then assigning the tasks to the resource. Each task can be given a priority, ready time, processing time and due date. The value of the performance measures can be computed based on this information and the sequence of tasks. This problem grows in complexity at an exponential rate as the number of tasks to be scheduled increases. For example, a problem of scheduling 3 tasks has 3! (6) candidate solutions, whereas a problem with 9 tasks has 9! (362,880) candidate solutions. A 3 fold increase in the number of tasks increased the solution space by over 60,000 times. This rapid growth in solution space size is shown graphically in Figure 1-1. Solution Complexity Graph 10000000 Number of Solutions
1000000 100000 10000 1000 100 10 1 0
1
2
3
4
5
6
7
Number of Jobs (N)
Figure 1-1 – Solution Complexity Graph
8
9
10
11
13 1.1.2
Parallel Machine Scheduling
Parallel machine scheduling involves scheduling a set of tasks on two or more machines that work in parallel with each other. The machines perform identical operations and may or may not operate at the same pace. An example layout is shown in Figure 1-2 – Parallel Machine Layout. In this type of problem, the tasks are assigned to either machine for processing, and flow between machines is not allowed.
Machine 1
Machine M
Figure 1-2 – Parallel Machine Layout 1.1.3
Flow Shop Scheduling
A flow shop scheduling problem consists of two or more machines and a set of tasks that must be processed on each of these machines. This arrangement is called a flow shop because products flow along a specific unidirectional path. Each product must be processed on each machine in the same order e.g. 1st - machine 1, 2nd – machine 2, …, mth – machine m. The processing times for each job can vary from machine to machine and the processing times on each machine can vary from job to job.
14 1.1.4
Job Shop Scheduling
A job shop consists of two or more machines that perform specific operations, and a set of tasks that must be processed on some or all of these machines. Unlike the flow shop problem, there is no fixed path that products must follow through the system therefore the order of operations is not fixed. This type of layout is typically used when product variety is high and product volume is low. 1.1.5
Manufacturing Cell Scheduling
Manufacturing cell scheduling consists of a set of jobs that are grouped into part families and a set of machines that are grouped into machine cells. These part families are based on production similarities; that is, the number of operations that are performed using the same machines. The machines in the system are then grouped into cells based on the part families. Some of the advantages of manufacturing cells include increased product variety, increased machine utilization, and reduced rework. Scheduling can be done based on the machine cell and the part family information. 1.1.6
Assembly Line Balancing
Assembly lines consist of a set of stations that produce one or many products. Each product must go through each station in the same order. In order for an assembly line to function properly the operations in the stations must be balanced with respect to cycle time. This means that each station should require the same amount of processing time.
15 1.1.7
Scheduling Problem Objectives
Some of the common objectives amongst scheduling problems are minimizing makespan, minimizing average flow time, minimizing the number of tardy jobs and maximizing the utilization of each machine. Minimizing makespan means that the goal is to reduce the amount of time it takes to complete all of the jobs, and minimizing average flow time means that the goal is to reduce the amount of time each job stays in the system. 1.2 Single-Machine Scheduling Objectives The objectives of the single machine scheduling problem that are considered in this thesis are Total Tardiness (TT), Average Flow-Time (Favg), Number of Tardy Tasks (nT) and Maximum Tardiness (Tmax). These are competing objectives because an improvement with respect to one objective usually results in a degradation of another objective. Total Tardiness is the amount of time by which the entire schedule is tardy. This number shows how well the schedule performs at a macro level. If total tardiness is zero, then it can be inferred that both nT and Tmax are zero. Average Flow-Time is the average amount of time that each job spends in the system. The best value that average flow-time could ever achieve is the value of the average processing time. In this case each job is ready and can be processed as soon as it arrives, this is also known as just-in-time manufacturing. The number of tardy tasks is the number of jobs that are completed past their due date. This is important from a scheduling aspect because it captures information from each job. Finally, maximum tardiness is the value of the tardiness that is greatest in
16 the schedule. This is the maximum amount of time that a customer will have to wait past their due date to receive their order. 1.2.1
Mathematical Definitions
In order to mathematically define the objectives mentioned above, we must first define the Lateness of a task (Li) as being the completion time of the task minus the due date. Tardiness (Ti) is then defined as the maximum of the lateness of the task and zero. Total Tardiness (TT) is the sum of the tardiness of each task to be scheduled, Maximum Tardiness (Tmax) is the maximum value of tardiness in the sequence, and Number of Tardy tasks (nT) is the number of tasks with tardiness greater than zero. Flow-Time (Fi) is the amount of time that a task spends in the system. This is defined as the completion time of the task minus the ready time. Average Flow-Time (Favg) is therefore the average of the flow times of all tasks. These are shown mathematically below. N = Number of Jobs.
si = Start Time of the ith Job.
pi = Processing Time of the ith Job.
ci = Completion Time of the ith Job.
ri = Ready Time of the ith Job.
Li = Lateness of the ith Job.
di = Due Date of the ith Job.
Ti = Tardiness of the ith Job.
The ith Job refers to the job in the ith position in the processing order, not the job with Job ID equal to i. For example, if the processing order of a four job problem were 2 Æ 4 Æ 1Æ 3, then p3 would refer to the processing time of Job 1. This is because Job 1 is the 3rd job in the processing order.
17 Using these variables, the formal mathematical definitions of the performance measures are as follows. s i = max(ri , c i −1 )
N
TT = ∑ Ti i =1
ci = s i + pi
Tmax = max(T1 , T2 ,..., T N )
Li = c i − d i
N
Ti = max(0, Li )
Favg =
∑ (c i =1
i
− ri )
N
1.2.2 Example Problem This section shows an example of a single machine scheduling problem and a single solution. This will give the reader an overview of how to solve a single machine scheduling problem and obtain the value of each performance measure. The data used for this example is shown below in Table 1-1 - Example Data. Job ID Processing Times: Ready Times: Due Dates:
1 4 0 4
2 5 4 9
3 2 9 11
4 7 11 18
Table 1-1 - Example Data
18 To determine the performance measures a candidate solution must be selected. A candidate solution is a feasible sequence in which the jobs can be processed in this case sequence 2Æ4Æ1Æ3 is selected. With the sequence information and scheduling data a Gantt chart for this candidate solution can be constructed. This Gantt chart is shown below in Figure 1-3 - Example Gantt Chart. Process Time
Ready Time
Due Date
Start Time
Completion Time
4 5 2 7
0 4 6 11
4 9 11 18
18 4 22 11
22 9 24 18
Job 1 Job 2 Job 3 Job 4
Sequence: 2→4→1→3 Gantt Chart 0
1
2
3
4
5
6
7
8
9
10 11 12 13 14 15 16 17 18 19 20 21 22 23 24 25
Job 2
Job 1 Job 2 Job 3 Job 4
Job 4
Tardiness
Flow Time
18 0 13 0
22 5 15 7
Job 1
Job 3
Performance Measures
nT Tmax TT Favg
2 18 31 12.25
Figure 1-3 - Example Gantt Chart 1.3 Genetic Algorithms Genetic algorithms are used for solving complex problems. Genetic algorithms use the process of simulated evolution to intelligently search a solution space of a problem. By using the Darwinian principles of classical biological evolution, genetic algorithms seek to produce better solutions based on past performance information. The advantages of using a genetic algorithm versus traditional solution approaches, such as
19 mathematical modeling, branch and bound, and hill climb, include the ability to avoid convergence on local optima, ability to search a large sample space, and comparably faster solution times. In order to implement a genetic algorithm, a chromosome definition, fitness function, and evolution strategy must first be defined. A chromosome is a representation of the independent variables that can be manipulated to determine how well the solution solves the problem (fitness) and to produce alternate solutions (reproduction). Typically a chromosome will consist of an array of values. The fitness function of a genetic algorithm evaluates each candidate solution, chromosome, to determine how well the solution performs with respect to the desired objectives. This information is used to choose which solutions to keep and which ones to discard (survival of the fit). The fitness of a candidate is used to determine how likely a solution is to reproduce (selection probability). The evolutionary strategy of a genetic algorithm defines how new solutions are formed from the previous solutions. The evolutionary strategy consists of the crossover, mutation, repair, selection, and termination operators. These are the core of the genetic algorithm, and their definitions vastly impact both computation time and solution quality. 1.3.1
Crossover
Crossover is the process of making new candidate solutions from previous candidate solutions. This process uses the principals of biological evolution to form children (new candidates) from parents (old candidates). The first step in crossover is to select a mating pair from the parent population. These solutions are chosen based on their
20 performance (fitness). Solutions that perform better have a greater chance of being selected for mating, this idea come from the Darwinian principle of “survival of the fit.” Once the parents have been selected, a cut point must be determined. This can be accomplished by choosing a random number. The first child is formed by using the all of the genes from the first parent up to the cut point, and all of the genes from the second parent after the cut point. The second child is then formed using the remaining genes from each parent. The idea here is that parents with high fitness values have good genes, and these good genes then can be used to form good children. 1.3.2
Mutation
Mutation is the process of manipulating individual genes in a candidate solution. This is a completely random process that does not use any information from the parent chromosomes or the fitness of the candidate solution. Mutation uses random numbers to select genes, and then modifies the selected genes according to the strategy applied by the developer of the algorithm. This is a local search technique that tries to improve candidate solutions by looking at other candidates nearby in the solution space. 1.3.3
Selection
The process of selection is used to form each subsequent population during the evolutionary process. This process is done by computing the fitness function of each candidate solution, and then selecting the individuals that will form the next generation’s parents. There are many techniques used in the selection process, some of which include tournament, elitist, and roulette wheel selection. During tournament selection a subsection of the population is randomly selected and the candidate with the highest
21 fitness value is passed to the next generation. This process is repeated until the parent population of the subsequent generation is formed. The elitist strategy selects the top N individuals from the current child and parent population to form the parent population of the next generation. Finally, roulette wheel selection involves constructing a cumulative probability distribution based on the fitness function of each candidate and then drawing random numbers to choose the parents of the next generation. 1.3.4
Termination
The termination operator is the mechanism for stopping the evolutionary process of a genetic algorithm. Termination can occur when the algorithm has reached a predetermined number of generations, an acceptable solution has been found, or when no solution improvement has occurred for a set period of time. Additionally it should be noted that manual termination can also be a termination operator, this occurs when the user stops the evolutionary process. 1.4 Fuzzy Theory Fuzzy sets are used for modeling uncertainty due to vagueness. These sets are used primarily when the uncertainty is due to semantic definitions rather than due to randomness. Fuzzy membership functions are used to define how well a value “fits” into a fuzzy set. A short example is presented to show this concept.
22 Consider a set of people defined as tall people. Anyone can be a member of this set, but the degree of membership is based upon the person’s height. An example membership function is shown below in Figure 1-4 – Tall Membership Function.
Tall Mem bership Function 1 0.9
Degree Of M embership
0.8 0.7 0.6 0.5 0.4 0.3 0.2 0.1 0 36
46
56
66
76
Height (Inches)
Figure 1-4 – Tall Membership Function According to this definition, anyone under a height of 46 inches would have a zero degree of membership in the set of tall people; whereas people over the height of 76 inches have a degree of membership of one. Furthermore, any person whose height is between 46 and 76 inches would have a partial degree of membership in the set of tall people. In the past, fuzzy scheduling research has primarily focused on applying fuzzy sets to model uncertainty in scheduling problem parameters or constraints [3] [4] [7]. Fuzzy sets have been used when job ready times, processing times, and due dates were not known in advance.
23 1.5 Multi-Objective Optimization Multi-objective optimization involves trying to simultaneously optimize two or more objectives. A solution that may optimize one performance measure may deteriorate other performance measures; this tradeoff in performance makes finding a globally optimal solution difficult. Much of the previous multi-objective single machine research has relied upon the use of Pareto sets of solutions to solve scheduling problems. This type of solution gives the user a number of competing solutions to choose from, each of which is optimal with respect to the Pareto front. The user must then decide what trade-offs in performance measure optimality are acceptable for the problem and choose the final solution from the set. This can result in a large number of solutions to choose from, and a good solution with respect to one performance measure may produce a poor result with respect to others. Techniques such as MOGA and VEGA (see section 2.2.2) have been developed to solve multi-objective optimization problems, and these algorithms have been refined so that they find the Pareto front in many problem instances. They have also been revised to target specific regions of the Pareto front in order to find more desirable solutions. However, this still leaves the final decision up to the decision maker. Additionally, targeting could result in the exclusion of promising solutions in the search space by giving preference to solutions near the target value. 1.6 Objective The objective of this thesis is to test the feasibility of a fuzzy fitness function to optimize multiple performance measures of a single machine scheduling problem using a
24 genetic algorithm. Past research on multi-objective optimization has focused on finding a Pareto set of solutions; however, in this thesis we are focusing on finding a single solution which optimizes all competing objectives simultaneously. This will eliminate the need for the decision maker to choose a final solution from a set. This thesis also tests the feasibility of good gene detection in the genetic algorithm, as well as a new crossover operation that takes advantage of the good gene information. In this process we not only use the overall fitness of the chromosome, we seek to capture the information about the genes that contribute most to the performance of the solution, and then pass this information on to the child population. The new blockcrossover and mutation operators will seek to preserve these good gene blocks in the offspring. The block crossover operation is similar to biological evolution in that traits exhibited allow a species to survive; however, it is the underlying good genes that produce the desired traits in the individual that make it strong. By detecting and utilizing these good genes, we not only use the biological concept of “survival of the fittest,” but we also capture why the solution is “the fittest.” This thesis seeks to satisfy these objectives simultaneously by implementing a genetic algorithm with fuzzy fitness function using the Java programming language. The software allows the user to input the Ready Times, Due Dates and Processing Times of each job to be scheduled, and also the minimum acceptable value, maximum acceptable value and the membership function for each performance measure. The user can then set the GA parameters and execute to obtain a solution.
25 2
LITERATURE REVIEW This chapter of the thesis reviews past research on single machine scheduling,
multi-objective genetic algorithms and fuzzy scheduling. This section explains previous scheduling procedures, how they worked and why this procedure is different. This shows how others have approached this problem and justifies why this solution is a unique research methodology. 2.1 Single Machine Scheduling This section contains recent papers that describe what solution approaches have been developed to solve single machine scheduling problems. This gives background into previous approaches used to solve similar problems, and it reports the results obtained from previous studies. This helps to justify that the methodology used in this thesis is a unique approach to solving single machine scheduling problems. 2.1.1
Total Weighted Tardiness
The total weighted tardiness approach seeks to optimize the objective of minimizing total weighted tardiness by finding a sequence using the Dileep Sule heuristic [1] to determine the sequence of jobs. The heuristic works by using a backward scheduling procedure to develop an initial sequence, and then improving this sequence using a forward phase. The results obtained from this approach were then compared to the results obtained from benchmark problems and their best known solutions. This procedure does not guarantee optimal results; however, it does provide an approximation within a 5% deviation of the best known solution for problems sets up to
26 100 tasks. The computational time for the Dileep Sule heuristic is less than one millisecond [1]. This paper shows that there are fast approximations for single objective single machine scheduling problems. The computational time for this procedure was very small because it used a simple two pass heuristic to develop the sequence. 2.1.2
Minimizing nT with Non-zero Ready Times
Süer et al. [9] present a genetic algorithm for minimizing the number of tardy jobs in a single machine scheduling problem when preemption (job splitting) is not allowed. The authors use Moore’s algorithm to find possible solutions for nT in single machine scheduling problems with non-zero ready times. The chromosome definition that was used consisted of (n) genes (jobs), where each gene was composed of a pair of parameters (X, Y). X represents the number of the assigned job [1 – N], and Y represents the scheduling strategy used [1 (delay), 2 (nondelay)]. The delay strategy keeps the machine idle until the job becomes available for processing, whereas the non-delay strategy assigns the next available job in the sequence to fill the idle time. A single cut point crossover strategy was used, and the mutation operator swapped the position of jobs and changed their strategy. The child population was repaired after crossover was performed by replacing the duplicate jobs with the missing jobs in the order that they appeared in the opposite parent (e.g. Child 1 used information from Parent 2). Test problems were developed using a uniform distribution U[1, 10] for processing times (pi), a uniform distribution U[0, m * 0.1 * ∑pi] where m is U[1, 4] for
27 ready times (ri), and ri + pi * k where k is U[1, 4] for due dates (di). Job data sets were generated for 10-job, 20-job and 30-job problems. In order to test the algorithm, the ready times were set to zero so that Moore’s algorithm could be used to find a known optimal solution. The algorithm found the optimal solution in all test problems. This research shows that genetic algorithms can be used to successfully solve single machine scheduling problems when ready times are non-zero. Additionally, this research presents a method for obtaining the optimal solution for nT when ready times are all zero (Moore’s algorithm). However, this research only considers one performance measure (nT). 2.1.3
Minimizing Favg with Non-zero Ready Times
Süer et al. [10] use a genetic algorithm to solve single machine scheduling problems. However, in this paper they seek to optimize only average flow time (Favg). According to the author, if the ready times of all of the jobs are zero then Favg can be optimized by using the Shortest Processing Time (SPT) rule. Additionally, when preemption is allowed and processing times are non-zero, Favg can be optimized using the Shortest Remaining Processing Time (SRPT) rule. The authors give a brief background of manufacturing scheduling, and then they describe the procedure used to solve the problem. The chromosome definition and evolutionary scheme were identical to the procedure described in [9]. The main difference was that instead of nT being minimized, Favg was the objective to minimize. The fitness function in this case was simply the value of Favg for the schedule produced by the chromosome.
28 This research shows that there are known optimization procedures for Favg in certain instances of the single machine scheduling problem. However, this paper also highlights the fact that many instances of the single machine scheduling problem cannot be optimized by using any known procedure. In these cases it is necessary to use solution techniques such as genetic algorithms. This research has shown that genetic algorithms can be used to optimize a single performance measure of the single machine scheduling problem, even when other heuristic methods fail. 2.1.4
Minimizing Tmax with Non-zero Ready Times
Süer et al. [11] uses a genetic algorithm to solve single machine scheduling problems, in this case to optimize Tmax. The authors state that when ready times are zero the Earliest Due Date (EDD) rule can be applied to find the optimal solution. Additionally, when ready times are non-zero and preemption is allowed the Modified Earliest Due Date (MEDD) rule can be applied to determine the optimal sequence. The evolutionary scheme is similar to the evolutionary scheme used in [9] [10]. The main difference being that Tmax was used as the fitness function. 2.1.5
Total and Maximum Tardiness Pareto-Optima
Tadei et al. [2] propose a procedure that takes advantage of an algorithm for finding the Pareto-optima set of a single machine scheduling problem by applying specially developed constraints to a branch and bound algorithm. By decomposing the problems, this procedure eliminates large regions of the search space thereby reducing the number of branches that need to be searched. By using this linear programming
29 approach, the procedure guarantees that a complete Pareto set can be found for each problem. This procedure was able to solve problems up to a size of 70 jobs, with computational time reaching a maximum of 8.5 hours. This shows that complete Pareto sets can be found for even large problem instances in a relatively short amount of time. Although this procedure requires much more computational time than heuristic approaches, a complete Pareto set is guaranteed [2]. 2.1.6
Fuzzy Parameters
Fuzzy sets are used in scheduling problems because most of the parameters in real-world scheduling problems are stochastic in nature and not known a priori [3]. Sung and Vlach propose a general algebraic modification of Jackson’s lemma and Moore’s algorithm that obtain optimal solutions under uncertainty [4]. These works show that the effects of parameter uncertainty on single machine scheduling problems have been investigated. Using modified heuristics for deterministic scheduling problems optimal solutions were obtained in the stochastic problem. These works show that fuzzy sets have been used to model uncertainty in the single machine scheduling problem; however, this thesis assumes deterministic scheduling parameters. The fuzzy set concept is used to model how well a sequence of jobs performs as a schedule by determining how well the performance measures fit into fuzzy sets. To my knowledge, fuzzy sets have not been used in this way.
30 2.2 Multi-Objective Genetic Algorithms This section discusses previous research that has been conducted using genetic algorithms to optimize multiple objectives. The goal of multi-objective optimization is to find a solution that optimizes competing objectives simultaneously. The most common approach to multi-objective optimization is to obtain a set of non-dominated Pareto solutions. Genetic algorithms are used to optimize problems that become too complex for traditional methods such as linear programming. 2.2.1
Pareto Sets
Pareto sets have been used extensively to show the solutions to multi-objective optimization problems. Deb has studied the problem features that may cause a multiobjective genetic algorithm difficulty to converge on the true Pareto-optimal front [5]. This research has focused on determining problem features that would make finding the Pareto set difficult for the genetic algorithm when all of the objectives are of the minimization type. The various reasons for non-convergence were Multimodality, Deception, Isolated Optimum and Collateral noise. Multimodality refers to the existence of multiple Pareto-optimal fronts, Deception causes the genetic algorithm to get stuck in a local optima, Isolated Optimum occur when most of the solution space is flat and yields little evidence of optimal solutions, and Collateral noise occurs when the genetic algorithm discards a partially good solution due to poor performance in another part of the solution. Test problems of each case were developed and discussed. This research has enabled researchers the opportunity to test multi-objective algorithms on problems that are specifically designed to be difficult to solve.
31 There has also been research conducted by Sbalzarini, Müller and Koumoutsakos that uses the Strength Pareto Evolutionary Algorithm (SPEA) to map the Pareto-optimal front of multi-objective optimization problems. According to the authors, the SPEA has two major advantages when compared to other methods: it finds the whole Pareto-front and not just a single point on it, and it converges faster [6]. This research then introduces a new step in the algorithm that will allow the user to target a specific value in the solution space thereby eliminating the need for the user to consider all possible Pareto results. This is accomplished by introducing a weight or distance into the fitness function so that individuals close to the target solution get a higher fitness value and therefore higher probability of selection. This shows that research has been conducted on finding Pareto solutions that are close to a target value. This approach still relies upon the user to make the choice of the final solution from a set of solutions. 2.2.2
MOGA VEGA Techniques
The multi-objective genetic algorithm (MOGA) and vector evaluated genetic algorithm (VEGA) are two previous approaches that have been developed to solve multicriteria optimization problems. MOGA operates by assigning a rank value to each solution which indicates the number of solutions that it is dominated by, e.g. nondominated solutions are rank 1. Fitness values are then interpolated over the solutions, and the fitness is assigned to each solution based on rank. In the VEGA algorithm the population is divided in k subpopulation, where k is the number of performance measures to be optimized. The populations are divided during the selection phase of the algorithm. During this process each objective selects k/N
32 individuals, where N is the overall population size. This ensures that solutions that perform well with respect to each performance measure evolve to the next generation; however, it does not ensure that the solutions perform well with respect to all performance measures. 2.2.3
Mixer Approach
Süer et al. [12] present a genetic algorithm for optimizing two performance measures of a single machine scheduling problem simultaneously. In this approach two populations evolve separately, and the solutions from each individual evolver are fed into a mixed population. The mixed solution population then evolves for some time, and it is then back-fed into the original evolvers. The idea is that each individual evolver will find solutions which optimize each performance measure independently, and then the mixer will use these good solutions to find a solution which is optimized with respect to both performance measures. This research shows that genetic algorithms have been used to solve multi-criteria scheduling problems. 2.3 Fuzzy Sets This section of the thesis discusses how fuzzy sets have been used in scheduling problems to model uncertainty. Fuzzy sets can be used to model uncertainty in scheduling parameters such as processing times, ready times and due date. Fuzzy sets can also be used to model the fitness of a solution. A fuzzy set defines how “good” or “bad” a solution is based on where it falls in the fuzzy set based on the membership function. Although similar to probabilities, fuzzy sets are distinctly different. To show the difference between the two consider the following example. When considering a schedule
33 we can look at a performance measure derived from the schedule. Using probability, we can state with a certain degree of certainty that the schedule will perform better than a certain value for the performance measure. We cannot use probability theory to state whether the schedule performs “well” with respect to the performance measure, due to the vagueness inherent in the definition of the word “well.” However, with the use of fuzzy sets we can define a set of solution that we consider to perform well, and then determine the degree of membership the solution has in the set. 2.3.1
Membership Functions
Zimmermann [8] states that “fuzzy set theory provides a strict mathematical framework (there is nothing fuzzy about fuzzy set theory!) in which vague conceptual phenomena can be precisely and rigorously studied.” This means that fuzzy sets provide a solid mathematical foundation for dealing with concepts that are vague due to their semantic definitions. The fuzzy membership function is then used to determine by what degree each element of a set falls into the semantic category. Vlach [7] has presented research on how fuzzy membership functions can be used to model uncertainty in scheduling problem parameters. The scope of this research considered non-preemptive single machine scheduling problems without deadlines. The author reviews some general approaches that previous researchers have developed for dealing with both fuzzy due dates and processing times. Additionally, fuzzy precedence relations are discussed as well as research that has focused on providing solutions to problems with fuzzy constraints. When used to describe the parameters of the scheduling problem, fuzzy sets are used to determine how satisfied the decision maker is with the parameters value. For example, a fuzzy set describing due dates will have a membership
34 function that describes how the decision maker’s satisfaction is related to each possible value of the due date. The fuzzy membership function allows for partial satisfaction, whereas this is not allowed in the crisp domain. This research shows that previous research has been conducted to determine the feasibility of using fuzzy sets to model uncertainty of single machine scheduling problem parameters. 2.3.2
Fuzzy Multi-Criteria Decision Making
Zimmermann [8] explains the differences between multi-objective decision making (MODM) and multi-attribute decision making (MADM). The author states that, “the main difference between these two directions is that the former concentrates on continuous decision spaces…” Since the single machine scheduling problem has a finite, although very large, sample space, this problem falls under the category of multi-attribute decision making. The author also states that “the aim of MADM is to determine the optimal alternative with the highest degree of desirability with respect to all relevant goals.” The author then describes some procedures for MADM which involve determining the desirability with respect to each of the goals for each of the decision alternatives. This research shows that fuzzy sets have been used for MADM; however, when the number of alternative solutions is very large this procedure becomes infeasible. 2.3.3 Fuzzy Aggregation Models Sasikala and Petrou [15] state that “aggregation operations on fuzzy sets are operations by which several fuzzy sets are combined in a desirable way to produce a single fuzzy set. An aggregation operation on n fuzzy sets where n > 2 is formally defined by a function f : [0; 1]n Æ [0, 1].” Werners [16] suggests two aggregation models
35 to implement fuzzy concepts in linear programming models. The models proposed are fuzzy-and and fuzzy-or operators. This thesis builds upon this concept by aggregating the fuzzy sets which measure a candidate solution’s performance with respect to each performance measure into a fitness function to determine how well a candidate solution performs. In this thesis three fuzzy aggregation operators are investigated. The minimum, summation and hybrid aggregation operations are used to combine the individual fuzzy membership values from each performance measure into the fitness value for a candidate solution.. Süer et al. [13] propose using fuzzy operators to model vagueness in a mathematical model to solve cell loading problems in a labor intensive cellular manufacturing environment. The operators investigated in this research were min, fuzzy
and, fuzzy or, minimum bounded sum, add, and product. This research shows that fuzzy principles have been applied to mathematical modeling in order to solve industrial engineering problems. This thesis builds on this research by implementing some of these fuzzy operators in conjunction with a genetic algorithm.
36 3
PROBLEM STATEMENT This chapter describes the goals that this research seeks to accomplish. This
chapter includes a basic outline of the problems that are being investigated and the proposed solutions. A more detailed explanation of the proposed solutions is given in the methodology section of Chapter 4. 3.1 Fuzzy Fitness Feasibility This thesis will test the feasibility of using fuzzy membership functions to evaluate solutions in a multiple objective single machine scheduling problem. Though much research has been conducted using fuzzy concepts and genetic algorithms to solve scheduling problems, the literature review did not produce any previous works that used fuzzy membership functions to evaluate the performance of chromosomes in a genetic algorithm. Although this approach is similar to weighting, there are significant differences that make this investigation worthwhile. 3.2 Block Crossover This thesis also will investigate the feasibility of using good gene detection strategies to preserve good gene sequences during the evolutionary process. This is a unique approach to applying the crossover strategy in the genetic algorithm. Traditionally genetic algorithms have only relied on the fitness function to evaluate chromosomes. This research uses additional heuristics to identify and preserve why a particular chromosome achieves a high fitness value.
37 3.2.1
Tardiness Heuristic
The first heuristic that is used to perform block crossover relies upon the tardiness of the jobs in the sequence. All genes in the chromosome that have a tardiness value of zero are marked as good genes. The rationale for using this heuristic is that genes that have a tardiness value of zero contribute positively to the performance measures of nT, Tmax and TT; therefore, these genes contribute positively to the overall fitness of the chromosome. 3.2.2
Waiting Time Heuristic
The second heuristic for detecting good genes for performing block crossover utilizes both idle time and waiting time before a job. Genes that have idle time before the job are considered to be bad genes because there could possibly other jobs that may be processed during the machine idle time. Genes that have no idle time or waiting time are considered to be good genes because the jobs are processed as soon as they become available. Finally, genes that have exceptionally long waiting times are considered to be bad genes. 3.3 Simulation of Multi-Decision Maker Environment The third research objective of this thesis is to test the feasibility of using fuzzy sets to simulate decision making in a multi-decision maker environment. Many “realworld” scheduling problems consist of multiple decision makers each with their own competing objectives. A schedule that may appeal to one decision maker may be considered unsatisfactory with respect to another. Fuzzy membership functions are used
38 to model the fitness of the schedules with respect to the objectives of various decision makers in order to find solutions that are satisfactory to all parties. This research is important because most real world optimization problems are multi-objective problems, and solutions that are optimal with respect to one criterion often degrade others. Much research has been conducted in this area; however, this work is unique because fuzzy membership functions are used to form the fitness function of the genetic algorithm. Another unique aspect of this research is the development and application of the intelligent block crossover operator. Traditionally, genetic algorithms have relied upon randomness to perform cut-point crossover. Intelligent mating strategies have been utilized in the past; however, when crossover was performed it was still left to chance.
39 4
METHODOLOGY This chapter of the thesis describes the methods developed to satisfy the goals that
this research set out to accomplish. A discussion of the genetic algorithm, good gene detection strategies and fuzzy fitness function is presented. This will show that this procedure is a unique approach for solving multi-objective single machine scheduling problems. 4.1 Genetic Algorithm This section of the thesis describes the genetic operators used to achieve the final solution. It will discuss how the operators perform their tasks, and how the parameters can be altered to improve the search. This will give the reader an abstract view of how this genetic algorithm functions. 4.1.1
Chromosome Definition
The chromosomes used in this genetic algorithm are represented as an array of integers. The integers in the array are the job IDs of each of the jobs that are to be scheduled, and their position in the array indicates the order in which they will be processed. An example chromosome is shown below in Figure 4-1.
Figure 4-1 – Chromosome Representation In this chromosome the jobs would be processed in sequential order according to job ID. Hence; Job 1 Æ Job 2 Æ Job 3 Æ Job 4 Æ Job 5 Æ Job 6; would be the processing order of the jobs according to the previous chromosome. Using the sequence
40 determined from the chromosome, a schedule can be constructed from the job data, and finally the performance measures of the schedule can be computed. The performance measures can then be used to determine the fitness of the chromosome, which is discussed later. 4.1.2
Initial Population
The initial population is generated randomly by drawing numbers that represent job IDs. If the number drawn is already assigned in the sequence, a new number is drawn. This process is repeated until all jobs are assigned. This ensures that all chromosomes are formed randomly and that the chromosome formed is feasible. The process of generating a random chromosome is then repeated until the entire population has been created. 4.1.3 Selection and Mating The chromosome fitness functions are computed according to the strategy selected, and then the selection probability for each chromosome is determined using the following formula: Pselection (Chromosomei ) =
FFi N
∑ FF n =1
n
FFi = Fitness Funtion value for chromosome i. N = Population Size
After calculating the selection probability for each chromosome in the population, a cumulative selection distribution is then constructed. Finally, randomly generated numbers are used to determine which chromosomes will mate. Since the cumulative selection probability distribution is in the range of [0, 1], random numbers are drawn
41 from this range. If a chromosome is chosen to mate with itself, then another parent is selected randomly. 4.1.4
Crossover and Repair
This section describes how the crossover operators in the genetic algorithm perform. This genetic algorithm uses two different crossover operators: a classical crossover and a block crossover. The classical crossover operates on a single cut point strategy, whereas the block crossover seeks to determine good genes from the parents and preserve these segments in the children. The classical crossover is detailed in the following section.
4.1.4.1 Classical Crossover A single point crossover strategy is used to form the children from the parent population. Two children are formed from each pair of mating parents. A random cut point is selected by generating a random number, and the first child consists of all the genes from the second chromosome up to the cut point, and all of the genes from the first chromosome after the cut point. The reverse is true for the second child. This is shown in Figure 4-2. Cut Point Parent 1
6
2
3
5
4
1
Parent 2
2
4
6
1
3
5
Child 1*
2
4
6
5
4
1
Child 2*
6
2
3
1
3
5
Figure 4-2 – Classical Crossover Description
42 Once the child chromosomes have been generated using the classical crossover operator, they are then repaired using the procedure described in Section 4.1.4.4. This is required because the classical crossover operator can produce infeasible solutions (i.e. a job may be list twice or not at all).
4.1.4.2 Block Crossover The block crossover operation is only applied to a fraction of the population in order to preserve diversity in the search and thereby avoid convergence on local optima. The first step of block crossover is to detect which genes in the chromosome are responsible for the chromosomes fitness. The gene detection procedures are described in the next section. After the good genes are detected, the first child is constructed by replicating all of the good genes from the first parent. Then the good gene information from the second parent is added. Finally missing genes are randomly filled into unassigned locations. When adding the good gene information from the second parent, the gene data from the first parent is preserved. The block crossover operation does not require any repair function because only feasible chromosomes are generated. This is shown in Figure 4-3.
43
Step 1
Step 2
Parent 1
1
2
3
4
5
Parent 1
1
2
3
4
5
Parent 2
4
3
2
5
1
Parent 2
4
3
2
5
1
Mark the good genes using a heuristic.
Step 3 Parent 1
1
2
3
4
5
Parent 2
4
3
2
5
1
Child 1
3
2
1
5
4
Child 2
1
3
2
5
4
Randomly assign missing genes to open locations.
Child 1
2
Child 2
3
5 2
5
Pass good genes to the children. Parent x genes take precedence on Child x.
Step 4 Child 1
3
2
1
5
4
Child 2
1
3
2
5
4
Repair function is not needed.
Figure 4-3 - Block Crossover Example
4.1.4.3 Gene Detection Two strategies for good gene detection are investigated in this thesis. The first relies upon tardiness of the job to indicate if a gene is good. This is a simple heuristic procedure that says a gene is good if the tardiness of the job is zero. The second strategy is a more complex heuristic that uses the idle time before a job and the waiting time before a job to determine if the gene is good. If there is any idle time before the job, the gene is marked as bad. The reason for this is that there may be other jobs that could be processed during this idle time, and therefore this job should be processed later in the sequence. The second test checks if waiting time and idle time
44 before the job are equal to zero. If these are both zero the gene is marked as a “good” gene because the job is processed as soon as it becomes available. This is consistent with classical scheduling theory which states the inserted idle time and preemption degrade performance measure values. The final test involves finding the jobs with really high or low waiting times and marking them as bad genes. A really high or low waiting time is defined as being kσWT away from µWT, where σWT µWT are the standard deviation and mean of all non-zero waiting times, and waiting time is defined by the following equation:
WTi = Start Time i − Ready Time i
Equation 4-1
4.1.4.4 Repair Infeasible solutions are then repaired by replacing duplicate genes with the missing genes. Missing genes chronologically replace duplicate genes. The repair operation is shown below in Figure 4-4. In the first unrepaired chromosome, Child 1*, job 4 is located in the second and fifth gene, making the solution infeasible. Additionally, job 3 is not assigned in the chromosome. Using this repair strategy, job 3 replaces the first occurrence of job 4, and the new chromosome is shown as chromosome Child 1. A similar approach is used for Child 2*. Child 1*
2
4
6
5
4
1
Child 2*
6
2
3
1
3
5
Child 1
2
3
6
5
4
1
Child 2
6
2
4
1
3
5
Figure 4-4 – Repair Operation
45 4.1.5
Mutation
A random number is drawn for each chromosome. If the random number is less than or equal to the mutation probability, then that chromosome goes through mutation. When a chromosome goes through mutation, random numbers are generated for each gene. If the generated random number is less than or equal to the mutation probability, then the gene is mutated. When a gene is mutated, a random job ID is selected and the two genes are swapped. This is shown in Figure 4-5. P(mutation) = 0.1 Random Number
0.3
0.4
0.2
0.9
0.08
1
RN = 3 Child 1*
2
3
6
5
4
1
Child 1
2
4
6
5
3
1
Figure 4-5 – Mutation Operation 4.1.6 Replacement A deterministic elitist strategy is used for replacement. The chromosomes with the highest fitness value form the parents of the next generation. The next population is formed from the top chromosomes of both the child and parent populations. The top chromosomes are chosen according to their fitness values. 4.2 Fuzzy Fitness The fitness function is formed using fuzzy membership functions on each performance measure. Two shapes and three selection types were used. When the genetic algorithm is executed, a combination of shape and type are selected to form a fitness
46 function to be used by the experiment. These combinations of shape and type made a total of six fitness functions possible. Each of the shapes and type are discussed below. 4.2.1
Fuzzy Membership Shapes
This section of the thesis discusses the fuzzy membership shapes used in the fuzzy fitness function. The shape of the fuzzy fitness function determines how strongly a particular solution conforms to the fuzzy set.
4.2.1.1 Linear The linear fuzzy membership function determines the membership of a schedule based on a linear relationship. The lower bound and upper bound are specified by the user of the software. The lower bound is the “ideal” value of the performance measure, and the upper bound is the unacceptable value of the performance measure. For example, if the user specifies that having only 2 tardy jobs would be ideal and that having 5 tardy jobs is unacceptable, then the lower bound would be 2 and the upper bound would be 5. This means that any chromosome with nT ≤ 2 has a membership value of 1; likewise, any chromosome with nT ≥ 5 would have a membership value of 0. All values between the lower and upper bounds are linearly scaled to have membership values between 0-1. This relationship is shown graphically in Figure 4-6.
Figure 4-6 – Linear Membership Function
47
4.2.1.2 Parabolic The parabolic fuzzy membership function is very similar to the linear membership function, with the exception of the region between the lower and upper bounds. In this region the membership values are no longer scaled linearly, rather in this case a parabolic scaling function is used. This is used to give more preference to chromosomes whose performance measures are close to the lower bound. This relationship is shown graphically in Figure 4-7.
Figure 4-7 – Fuzzy Membership Function 4.2.2 Fuzzy Fitness Type The fuzzy fitness type determines how the values determined by the membership functions will be used to compute the fitness function. In this thesis three alternatives for fuzzy fitness type are investigated: minimum, summation and hybrid. These types are discussed in more detail in the following sections.
4.2.2.1 Minimum The fitness value of the chromosome takes the value of the lowest fuzzy membership value. The idea is that all membership values will be high, when the lowest value is high. This in turn will produce solutions which are good with respect to each membership function, and therefore good with respect to each performance measure.
48
4.2.2.2 Summation The fitness value of the chromosome takes the value of the sum of the fuzzy membership values. Chromosomes that are good with respect to all performance measures will have a greater sum of membership functions, and therefore they will have a higher fitness value. By summing the membership values, each performance measure has a contribution to the overall fitness value of the chromosome.
4.2.2.3 Hybrid The fitness value of the chromosome takes the value of the sum of the fuzzy membership values and gains an additional one for each non-zero fuzzy value. This fitness type is an extension of the summation type. Each chromosome fitness value is given an extra reward for each non-zero membership value.
49
4.2.3
Fuzzy Fitness Example
The following section shows a brief example of how the fuzzy fitness function is evaluated. The example uses the same problem from Section 1.2.2. The example data, candidate solution, Gantt chart, performance measures and fuzzy membership functions are all shown below in Figure 4-8.
Tardiness
Flow Time
18 0 13 0
22 5 15 7
Job 1 Job 2 Job 3 Job 4
Performance Measures
2 18 31 12.25
nT Tmax TT Favg
µ
µ
1
1
0.5
0.5 0.28
0
0 0
1
2
3
4
0
5
0
10
nT µ
µ
1
1
0.5
10 15 Tmax
20
25
0.5 0.38
0.28
0
0 0
5
10 Favg
15
20
20
30 Tmax
40
50
Figure 4-8 - Fuzzy Fitness Evaluation The shape that was used for each fuzzy membership function was linear. The fitness value will vary based on the type of fitness function that is chosen. Minimum will result in a value of 0.28, summation will be 1.44 and hybrid will be 5.44.
50 4.3 Multi-Decision Maker Simulation In order to simulate a multi-decision maker environment, a fuzzy fitness function is setup for each of the decision makers. Each decision maker can have any combination of shapes for their membership functions for the performance measures, but the fitness function type is set globally. This means that the type selected will be used to form each decision maker’s fitness function as well as the global fitness function. Since each person involved in the scheduling process may have different performance measures that they deem important, the fitness functions will seek to optimize different performance measures. This is shown by a brief example below. The sales manager may say that it is very undesirable for a schedule to have more than 10% of the jobs tardy, but has no preference as to how long each job stays in the system. However, the shop foreman may find it undesirable to have jobs stay on the shop floor longer than 2 days. In this case, the sales manager’s fitness function would seek to optimize the number of tardy jobs, whereas the shop foreman’s fitness function would seek to optimize average flow time. The genetic algorithm then evolves for each member of the decision making team individually and candidate solutions are saved. The final step is to then choose a solution from the candidate solutions which minimizes the dissatisfaction of all members in the group. This is done by creating a global fitness function that utilizes the fitness of each candidate solution with respect to each decision maker. These individual fitness values are evaluated using the fuzzy methods described above for determining the fuzzy fitness value of the multi-objective genetic algorithm (i.e. minimum, summation or hybrid).
51 Once the global fitness of each candidate solution has been calculated, an overall solution that minimizes total dissatisfaction among group members can be obtained. 4.4 Java Implementation This section of the thesis will show how to use the application that was developed to satisfy the goals of this thesis. Some screen shots of the application and brief descriptions are presented to give the reader an overview of the applications functionality. 4.4.1
Main Window
The main window is the opening screen of the application. This is shown in Figure 4-9 - Main Window Screenshot.
Figure 4-9 - Main Window Screenshot Section (A) of Figure 4-9 are tabs to choose the mode of execution for the application. The user can choose to do a Single Run, Multi-Decision Maker Simulation or
52 an Experiment. A single run consists of a single decision maker solving one instance of the single machine scheduling problem with a fixed set of parameters. The multi-decision maker simulation consists of multiple decision makers solving one instance of the single machine scheduling problem with a fixed set of parameters. Finally, an experiment run consists of a single decision maker solving one or many instances of the single machine scheduling problem with a variable set of parameters. Section (B) of Figure 4-9 are tabs to show the data to be used and the results obtained. Once a tab is clicked the relevant data will be shown in Section (C) of Figure 4-9. The buttons to control the application are located in Section (D) of Figure 4-9. These buttons allow you to modify the data set and execute the algorithm when the data tab is selected and they allow you to save the results data to a file when the results tab is selected. 4.4.2
Experiment Window
The experiment window was developed to aide in the testing of the algorithm. This allows the user to load a saved data file into the program and execute the algorithm at various parameter level combinations. The output of each execution can be saved to a specified location. This is shown in Figure 4-10 - Experiment Window.
53
Figure 4-10 - Experiment Window Screenshot 4.4.3 Execution Window The execution window allows the user to perform a single run in either permutation or genetic algorithm mode. Permutation mode will evaluate all possible candidate solutions and therefore can only be used on small problem instances. Section (A) of the execution window allows the user to set up a fitness function. The default parameters are obtained using the Latest Due Date heuristic for maximum value of nT, TT and Tmax. The Earliest Due Date heuristic was used to set the minimum value of nT, TT and Tmax. The minimum and maximum default values for Favg were set using the Shortest Processing Time and Longest Processing Time heuristics. Section (B) of the execution windows allows the user to input the evolutionary parameters. These parameters effect the evolutionary cycle of the genetic algorithm. Finally, Section (C) allows the user to start, stop and monitor the execution of the program. This is all shown below in Figure 4-11 - Execution Window Screenshot.
54
Figure 4-11 - Execution Window Screenshot
55 5
RESULTS This chapter of the thesis discusses the experimental results obtained. The
experimentation is divided into four sections. The first section tested the feasibility of using fuzzy sets as the fitness function for a genetic algorithm. Next, the block crossover strategy was tested using the information obtained from the first phase of testing. Finally, the feasibility of using fuzzy sets to model decision making in a multi-person environment is tested. The data sets that were used to test the genetic algorithm consisted of chronologically optimal 20 job data sets. This means that the optimal solution was known a priori because the data was created so that the optimal solution was the chronological
Data Set 6 Data Set 5 Data Set 4 Data Set 3 Data Set 2
Data Set 1
sequence of job IDs. The data sets used for testing are shown below in Table 5-1. Job ID
1
2
3
4
5
6
7
8
9
10
11
12
13
14
15
16
17
18
Processing Times: Ready Times: Due Dates: Job ID
4 0 4 1
5 4 9 2
2 9 11 3
7 11 18 4
3 18 21 5
5 21 26 6
6 26 35 7
7 35 42 8
5 42 47 9
1 47 48 10
7 48 55 11
6 55 61 12
4 61 65 13
1 65 66 14
9 66 75 15
9 75 84 16
9 84 93 17
8 7 6 93 101 108 101 108 114 18 19 20
19
20
Processing Times: Ready Times: Due Dates: Job ID
23 0 23 1
40 23 63 2
16 63 79 3
20 79 99 4
85 83 34 41 78 7 78 1 55 35 85 51 95 19 98 44 99 184 267 301 342 420 427 505 506 561 596 681 732 827 846 944 184 267 301 342 420 427 505 506 561 596 681 732 827 846 944 988 5 6 7 8 9 10 11 12 13 14 15 16 17 18 19 20
Processing Times: Ready Times: Due Dates: Job ID
35 0 35 1
52 35 87 2
85 100 63 23 82 66 13 80 65 10 29 70 68 59 3 71 24 4 87 172 272 335 358 440 506 519 599 664 674 703 773 841 900 903 974 998 172 272 335 358 440 506 519 599 664 674 703 773 841 900 903 974 998 1002 3 4 5 6 7 8 9 10 11 12 13 14 15 16 17 18 19 20
Processing Times: Ready Times: Due Dates: Job ID
82 0 82 1
40 58 86 5 57 83 56 4 85 66 50 7 78 98 65 26 50 75 90 82 122 180 266 271 328 411 467 471 556 622 672 679 757 855 920 946 996 1071 122 180 266 271 328 411 467 471 556 622 672 679 757 855 920 946 996 1071 1161 2 3 4 5 6 7 8 9 10 11 12 13 14 15 16 17 18 19 20
Processing Times: Ready Times: Due Dates: Job ID
62 0 62 1
50 36 17 53 26 7 87 25 44 27 43 29 57 57 89 36 94 77 66 62 112 148 165 218 244 251 338 363 407 434 477 506 563 620 709 745 839 916 112 148 165 218 244 251 338 363 407 434 477 506 563 620 709 745 839 916 982 2 3 4 5 6 7 8 9 10 11 12 13 14 15 16 17 18 19 20
Processing Times: Ready Times: Due Dates:
70 0 70
8 70 78
64 86 76 69 83 13 87 67 84 86 51 84 82 34 65 25 17 80 78 142 228 304 373 456 469 556 623 707 793 844 928 1010 1044 1109 1134 1151 142 228 304 373 456 469 556 623 707 793 844 928 1010 1044 1109 1134 1151 1231
Table 5-1 - Job Data Sets
56 The
chronological
sequence
optimizes
each
performance
measure.
Mathematically, the best possible value for nT, Tmax and TT is zero, and the best possible value for Favg is the sum of the processing times divided by the number of jobs. When the chronological sequence of jobs is used, each of the performance measures achieves their best mathematical value; therefore we can conclude that this is the optimal solution. Furthermore, since any change in sequence will increase all of the performance measures there can be only one optimal solution. 5.1 Phase 1 – Fuzzy Fitness In the first phase of testing the probability of crossover, probability of mutation, population size and number of generations were varied. The block crossover probability was kept at zero for this phase of the testing so that the effects of the aforementioned parameters could be studied. The probability of crossover was varied from 0% (no crossover) to 80% in increments of 20%, and the probability of mutation was varied from 0% (no mutation) to 40% in increments of 20%. Ten replications were performed at each level, and the results from this testing are shown below in Table 5-2.
Mutation
Average Fitness (max = 4)
0%
20%
0%
2.03
3.00
20%
3.00
40%
2.92
Crossover 40%
60%
80%
2.92
3.11
3.10
3.50
3.48
3.37
3.31
3.37
3.31
3.24
3.12
Table 5-2 - Mutation/Crossover Fitness Table Although the combination of 20% crossover and 20% mutation had the highest average fitness value, there was no statistical difference between 20% crossover-20% mutation and 40% crossover-20% mutation. There was also no statistical difference
57 between 20% crossover-20% mutation and 60% crossover-20% mutation. The significance was determined using a two-sided t-test to test for equal means with an alpha value of 5%. These results are shown in Table 5-3. P(Cr)=20% P(Mu)=20% µ = 3.5 P(Cr)=40% P(Mu)=20%µ t = 0.74 = 3.48 Insignificant P(Cr)=60% P(Mu)=20%µ t = 0.05 = 3.37 Insignificant P(Cr)=20% P(Mu)=40%µ t = 0.04 = 3.37 Significant
Table 5-3 – t-Test Results for Crossover versus Mutation The second part of this phase of testing varied the parameters for population size and number of generations. The population size was varied from 20 to 50 chromosomes in increments of 10, while the number of generations was varied from 500 to 2,000 generations in increments of 500. Ten replications were performed at each level, and the results from this stage of testing are shown below in Table 5-4. 500
# Generations 1000 1500
2000
20
2.89
2.96
3.10
3.14
30
3.06
3.15
3.22
3.25
40 50
3.07 3.16
3.21 3.31
3.28 3.29
3.31 3.33
Population Size
Average Fitness (max = 4)
Table 5-4 – Population Size/#Generations Fitness Table During these tests 10 replications were performed at each of the various combinations of parameters. The values shown in the tables are the averages of the ten replications at the various parameter levels. These tables show that the highest average
58 fitness value, when block crossover is excluded and a linear summation fitness function is used, was obtained with 20% crossover, 20% mutation, population size 50, and 2,000 generations. Since the genetic algorithm improved the solution quality as it evolved, it can be concluded that the fuzzy fitness function was a feasible way to model the fitness of single machine chromosomes in this genetic algorithm. 5.2 Phase 2 – Block Crossover Effect The second phase of testing investigates the effect of the block crossover operator on the performance of the genetic algorithm. This was done by generating 5 test problems, shown in Table 5-1 (data sets 2-6), consisting of 20 jobs each, and using the optimal parameters from Phase 1. The genetic algorithm was then executed for ten replications at two levels of the block crossover probability parameter: 0% and 20%. Additionally, the two different gene detection strategies were used for block crossover. The results are shown below in Table 5-5. % Optimal (10 Tardiness trials) Block (20%) Classical Data Set 2 0% 10% Data Set 3 0% 20% Data Set 4 0% 20% Data Set 5 0% 0% Data Set 6 0% 10% Average 0% 12%
Waiting Block (20%) 60% 80% 90% 80% 90% 80%
Table 5-5 – Block Crossover Effect Table This table shows that when the waiting time heuristic is used to perform block crossover the genetic algorithm found the optimal solution 80% of the time out of 50 trials. However, when the tardiness heuristic was used to perform block crossover the performance of the algorithm was lower than using the classical crossover method. This
59 is because the tardiness heuristic does not consider machine idle time. If a job is not tardy, then the gene representing that job is considered to be a good gene. However, if there is idle time present before the job, other jobs maybe able to fill this idle time.
60
5.3 Phase 3 – Effect of Fuzzy Membership Shape and Type In the third phase of testing, the effects of the fuzzy membership shape and type are investigated. Two shapes, linear and parabolic, and three types, minimum, summation and hybrid are investigated. For this phase of testing all of the data sets were used. Ten replications were conducted for each of the shape-type combinations, and the optimal parameters from the first and second phase were used. The results are shown below in Table 5-6 – Fuzzy Membership Results.
Data Set 6 Data Set 5 Data Set 4 Data Set 3 Data Set 2 Data Set 1
Minimum Summation Hybrid Minimum Summation Hybrid Minimum Summation Hybrid Minimum Summation Hybrid Minimum Summation Hybrid Minimum Summation Hybrid
% Optimal
Maximum
Average
Minimum
% Optimal
Parabolic Maximum
Average
Minimum
Linear
0.55 0.729
1
10% 0.303 0.478 0.723
0%
3.615 3.917
4
70% 3.506 3.951
4
90%
7.767 7.977
8
90%
8
100%
0.55 0.719
1
20%
0.25 0.528
1
20%
4
100% 3.304 3.871
4
80%
7.622 7.925
8
80% 7.298 7.871
8
80%
0.55 0.795
1
50% 0.303 0.542
1
20%
4
4
8
8
4
4
4
100%
4
4
4
100%
8
8
8
100%
8
8
8
100%
0.55 0.743
1
20% 0.303 0.606
1
20%
3.641 3.931
4
80%
4
100%
7.608 7.961
8
90% 7.534 7.953
8
90%
0.82
1
40% 0.303 0.469
1
10%
3.567 3.957
4
90% 3.317 3.932
4
90%
8
100%
8
8
100%
0.55 0.763
1
30%
0.44 0.925
1
80%
3.511 3.904
4
70% 3.126 3.913
4
90%
8
100% 7.701 7.97
8
90%
0.6 8
8
8
8
Table 5-6 – Fuzzy Membership Results
4
4
8
61 The maximum value of fitness changes depending on the type of membership function used. Table 5-7 – Fuzzy Membership Fitness Results shows the average fitness from sixty trials divided by the maximum fitness value. The Linear-Hybrid combination had the highest average fitness value out of 60 trials. This combination found the optimal solution 56 out of 60 times. FF/max(FF) Minimum Summation Hybrid
Linear 0.761 0.988 0.997
Parabolic 0.591 0.986 0.996
Table 5-7 – Fuzzy Membership Fitness Results This table shows that the combination of Linear-Hybrid had the highest average fitness value for this experiment. However, there was no statistical difference between Linear-Hybrid and Parabolic-Hybrid or Linear-Hybrid and Parabolic-Summation. These results are shown below in Table 5-8. Linear-Hybrid Min-Sum Min-Hy Sum-Hy Linear-Hybrid vs Parabolic-Hybrid Linear-Hybrid vs Linear-Summation Linear-Hybrid vs Parabolic-Summation
t-Value 0.01 0.00 0.00 0.02
Significant Significant Significant Significant
0.59
Insignificant
0.03
Significant
0.08
Insignificant
Table 5-8 - t-Test Results for Fitness Shape and Type
62 5.4 Phase 4 – Multi-Decision Maker Simulation To simulate the multi-decision maker environment different user profiles have been constructed. Each profile represents the user’s preference for performance measure optimization. The data set used for the experimentation was Data Set 1 from Table 5-1. The software was then executed in the Multi-Decision Maker mode to obtain the results. 5.4.1
Decision Maker Profiles
This section shows the profiles used during this phase of the experimentation. These profiles each represent an individual decision maker that provides input for the scheduling process. The first set of profiles represent decision makers who are concerned with only a single performance measure, and each user’s performance measure is unique to them. In the first set of profiles the minimum and maximum values represent the best and worst case scenarios for the problem. This means that any solution obtained would be at least a partial member in the fuzzy set. Decision Maker 1 Decision Maker 2 Decision Maker 3 Decision Maker 4
NT TT Tmax Favg
Minimum Maximum Shape 0 20 Linear 0 2367 Linear 0 215 Linear 5.6 111 Linear
Table 5-9 – Profile Set 1 The second profile set is very similar to the first set; however, in this case the acceptable value interval has been reduced. The minimum value was calculated as 10% of the maximum value from the previous set. The results from this set can then be compared to the results from the first profile set to determine how the acceptable range interval affects the algorithms performance.
63
Decision Maker 1 Decision Maker 2 Decision Maker 3 Decision Maker 4
NT TT Tmax Favg
Minimum Maximum Shape 2 6 Linear 236.7 710.1 Linear 21.5 64.5 Linear 11.1 33.3 Linear
Table 5-10 - Profile Set 2 The third profile set consists of four decision makers each of whom has their own preference for each of the performance measures. In this case, each decision maker has a preference for each of the performance measures.
Decision Maker 1 Decision Maker 2 Decision Maker 3 Decision Maker 4
NT TT Tmax Favg Minimum Maximum Minimum Maximum Minimum Maximum Minimum Maximum Shape 0 20 0 2367 0 215 5.6 111 Linear 0 20 0 2367 0 215 5.6 111 Parabolic 0 4 0 473.4 0 43 5.6 22.2 Linear 0 4 0 473.4 0 43 5.6 22.2 Crisp
Table 5-11 - Profile Set 3 In the third profile set the first and second decision makers will be partially satisfied by any solution obtained because the minimum and maximum acceptable values are the bounds for the given problem. The difference between these two is the degree to which the solution will be considered acceptable. The first decision maker has a linear fuzzy membership function, and they would be considered “normal” because their satisfaction is directly proportional to the solution quality. The second decision maker has a parabolic fuzzy membership function, and they would be considered “optimistic” because their satisfaction will increase much faster with better solutions. The final two decision makers exhibit the trait of stubbornness because they have a small range in which they will accept solutions. The difference between the third and fourth decision makers is that the third will partially accept solutions in the interval whereas the fourth takes an all-or-nothing approach. The crisp fuzzy membership type in fact is not fuzzy at
64 all. In this case, there is no such thing as partial acceptance; a solution is either good or bad. This profile set will show how different personality types interact during the scheduling process. The fourth profile set consists of four decision makers. The decision makers in this profile set each have an interval that encompasses the acceptable range for a performance measure. Each decision maker also has an interval which is tight on one performance measure. For example, Decision Maker 1 has an interval which covers all possible values for nT, but has the tightest interval for Tmax. This profile set is shown below in Table 5-12 - Profile Set 4.
Decision Maker 1 Decision Maker 2 Decision Maker 3 Decision Maker 4
NT TT Tmax Favg Minimum Maximum Minimum Maximum Minimum Maximum Minimum Maximum 0 20 400 2000 60 140 30 80 4 16 600 1800 0 215 40 60 6 14 900 1500 20 200 5.6 111 8 12 0 2367 40 160 20 90
Shape Linear Linear Linear Linear
Table 5-12 - Profile Set 4
The fifth profile set consists of four decision makers with increasingly tighter acceptable intervals. As the acceptable interval becomes smaller it is harder to satisfy that decision maker, but once they are satisfied the degree of satisfaction increases more quickly. This is similar to Profile Set 4, the difference here is that the interval size for each performance measure gets smaller for each successive decision maker. This profile set is shown below in Table 5-13.
65
Decision Maker 1 Decision Maker 2 Decision Maker 3 Decision Maker 4
NT TT Tmax Favg Minimum Maximum Minimum Maximum Minimum Maximum Minimum Maximum 0 20 0 2367 0 215 5.6 111 4 16 400 2000 20 200 20 90 6 14 600 1800 40 160 30 80 8 12 900 1500 60 140 40 60
Shape Linear Linear Linear Linear
Table 5-13 - Profile Set 5 The sixth profile set is very similar to the fifth profile set. The difference between these two sets is that the intervals for TT and Tmax are swapped for Decision Makers 1 and 2, and they are also swapped for Decision Makers 3 and 4.
Decision Maker 1 Decision Maker 2 Decision Maker 3 Decision Maker 4
NT TT Tmax Favg Minimum Maximum Minimum Maximum Minimum Maximum Minimum Maximum 0 20 400 2000 0 215 20 90 4 16 0 2367 20 200 5.6 111 6 14 900 1500 40 160 40 60 8 12 600 1800 60 140 30 80
Table 5-14 - Profile Set 6
Shape Linear Linear Linear Linear
66 5.4.2
Experimental Results
Using the data from Set 1 in Table 5-1 and the optimal parameter combinations from the first phase of experimentation, the following results where obtained for the multi-decision maker simulation experimentation. Experement 1 Experement 2 Experement 3 Experement 4 Experement 5 Experement 6
Sequence 1, 2, 3, 4, 5, 6, 7, 8, 9, 10, 11, 12, 13, 14, 15, 16, 17, 18, 19, 20 1, 3, 2, 4, 5, 7, 6, 8, 9, 11, 12, 13, 10, 14, 15, 17, 16, 18, 20, 19 1, 2, 3, 4, 5, 6, 7, 8, 9, 10, 11, 12, 13, 14, 15, 16, 17, 18, 19, 20 1, 2, 3, 4, 5, 6, 7, 8, 9, 10, 11, 12, 13, 14, 15, 16, 17, 18, 19, 20 1, 2, 3, 4, 5, 6, 7, 8, 9, 10, 11, 12, 13, 14, 15, 16, 17, 18, 19, 20 1, 2, 3, 4, 5, 6, 7, 8, 9, 10, 11, 12, 13, 14, 15, 16, 17, 18, 19, 20
Found By DM [1] DM [2] DM [3] DM [4] Global 4 DM2, DM3, DM4 1 1 1 1 3 DM4 0 1 1 1 16 DM1, DM2, DM3 4 4 4 4 16 DM3, DM4 4 4 4 4 16 DM1, DM2 4 4 4 4 4 4 4 4 16 DM1, DM2
Table 5-15 - Multi-Decision Maker Results As shown in Table 5-15 the optimal solution was found in both experiment 1 and experiment 3. The difference in experiment two was the acceptable interval size. The interval size plays a crucial role in the algorithms performance. Allowing all of the candidate solutions to obtain at least partial membership in the fuzzy membership functions is beneficial because it allows the algorithm to determine which solutions perform better than others. For instance, if the acceptable interval for nT is set to [2-6] as it was in Table 5-10 - Profile Set 2, then candidate solutions with nT values of 7 and 19 will have the same degree of membership. However, the solution with nT value of 7 should clearly be given more mating preference than the solution with an nT value of 19. It can be concluded that decreasing the acceptable range will decrease the algorithms performance.
67 6
CONCLUSIONS This chapter discusses the conclusions this research has provided as well as a
section of future work considerations. 6.1 Fuzzy Fitness The fuzzy fitness function proved to be a feasible method of modeling the performance of single machine scheduling problems. The genetic algorithm obtained the highest average fitness value when the crossover and mutation values were both set to 20%, the population size was 50 and the maximum number of generation was 2,000. However, there was no statistical difference between 20% crossover-20% mutation and 40% crossover-20% mutation and 20% crossover-20% mutation and 60% crossover-20% mutation. The reason that the highest average fitness was found with the highest values of population size and maximum number of generations is that more of the solution space is searched when the population size and maximum generations are greater. The fuzzy fitness function effectively captured the information about sequences that determined how well the schedules performed with respect to the desired performance measures. The combination of linear shape and hybrid type gave the highest average fitness value out of 60 trials. Using this combination, the optimal solution was found in 56 out of 60 trials for a 20-job chronologically optimal data set. However, there was no statistical difference between Linear-Hybrid and Parabolic-Hybrid or LinearHybrid and Parabolic-Summation.
68 6.2 Block Crossover The block crossover operator developed in this thesis has proven to be a feasible and superior method of preserving the features that make individual candidate solutions perform well with respect to the fitness function. Although the first method investigated, the tardiness method, performed worse than classical crossover, the revised waiting time approach greatly improved the algorithms performance. 6.2.1
Tardiness
The tardiness heuristic for performing block crossover produced worse solutions than the classical crossover method. This means that the algorithms performance was actually degraded by implementing the “smart” crossover operator. Upon further investigation, it was discovered that this degradation could be attributed to the fact that machine idle time was not considered by this heuristic. This heuristic was very simple but not practical for the purposes of this investigation. 6.2.2
Waiting Time
The waiting time heuristic dramatically improved the algorithms performance. The addition of this heuristic to the algorithm improved the percentage of times the optimal solution was obtained from 12% for classical crossover to 80%, and it also reduced the average generation that the optimal solution was found from 1,587 to 806. The addition of this heuristic allowed the genetic algorithm to evolve for 49% less generations while finding the optimal solution 68% more times than the classical only crossover method.
69 Block crossover proved to be a feasible method for determining and preserving the genes in each chromosome that were responsible for the chromosomes performance. This procedure greatly improved the quality of the solutions obtained and reduced the computation time needed to acquire these solutions. By disallowing purely random crossover we seek to preserve information that has been gained in previous steps of the evolutionary process. 6.3 Multi-Decision Maker Simulation The algorithm developed by this research was designed to satisfy the goal of multi-objective optimization by balancing tradeoffs between performance measures so that the final solution performed well with respect to all performance measures. The multi-decision maker simulation was a trivial case that shows the algorithm performed as it was intended to perform. An important conclusion that can be drawn from the simulation does not have to do with how personality types will interact in the scheduling process; moreover, it can be concluded that fuzzy interval size plays a vital role in the performance of this algorithm. The algorithm performs best when the fuzzy interval covers more of the solution space. 6.4 Future Work This research has shown that fuzzy sets, heuristics and genetic algorithms can be successfully used to solve the single machine scheduling problem. The heuristic used in this thesis was based on the author’s observations, it maybe possible to find other heuristics that improve the algorithms performance even more. The variable of problem size would be worth investigating to determine the optimal parameter combinations at
70 different problem sizes. This thesis investigated the 20-job problem, but further research could show the algorithms usefulness in problems of much larger magnitude. Additionally, the procedure could be tested in other problem domains. The program developed in this thesis can be easily modified to solve Traveling Salesman Problems (TSP) as well as single machine scheduling problems. The chromosome structure is nearly identical because the TSP is also a finite sequencing problem. This means the goal of the problem is to determine the best order for a fixed number of activities. Upon making the modifications to solve TSPs, a sample asymmetrical problem containing 16 stops and one depot was tested. The best known and nine alternate best solutions were obtained by the experimental run. The data set and best known solution were obtained from the TSPLIB [14]. The heuristic used in this experiment was to mark genes as good if the distance from the current city to the next city was less than the average of the distance matrix. To continue this research a logical next step would be to find better heuristic for determining good TSP genes. It would also be worthwhile to investigate how the multi-decision maker simulation would perform if all decision makers were to compete simultaneously. In the current implementation each decision maker evolves independently and the global solution is chosen from the pool of solutions obtained from each decision maker’s solution set. The profile sets could also be tied to sets of predefined human profiles. The profiles would set the interval ranges and other data based on the profile characteristics.
71 7
REFERENCES This chapter of the thesis contains the references cited throughout the document.
These references are cited in the order they appear in the document. [1]
R. Maheswaran, S. G. Ponnambalam, “An Investigation on Single Machine Total
Weighted Tardiness Scheduling Problems,” International Journal of Advanced Manufacturing Technology Journal Article, Volume 22, Numbers 3-4, September 2003 p. 243-248. [2]
R. Tadei, A. Grosso, F. Della Croce, “Finding the Pareto-optima for the Total and
Maximum Tardiness Single Machine Problem,” Discrete Applied Mathematics, Vol. 124, Issue 1-3, December 2002 p. 117-126. [3]
S. Chanas, A. Kasperski, “Possible and Necessary Optimality of Solutions in the
Single Machine Scheduling Problem with Fuzzy Parameters,” Fuzzy Sets and Systems, Vol. 142, 2004 p. 359-371. [4]
Shao Chin Sung, Milan Vlach, “Single Machine Scheduling to Minimize the
Number of Late Jobs Under Uncertainty,” Fuzzy Sets and Systems, Vol. 139, 2003 p. 421-430. [5]
K. Deb, "Multi-objective genetic algorithms: Problem difficulties and construction
of test Functions," Evolutionary Computation, Vol. 7, p. 205-230, 1999. [6]
I.F. Sbalzarini, S. Müller, P. Koumoutsakos, “Multiobjective optimization using
evolutionary algorithms,” Center for Turbulence Research Proceedings of the Summer Program 2000, p. 63-74. [7]
M. Vlach, “Single Machine Scheduling Under Fuzziness,” Heidelberg , New York : Physica-Verlag,2000 p. 223-246.
72 [8]
H. J. Zimmermann, “Fuzzy Sets, Decision Making, and Expert Systems,” Kluwer Academic Publishers, Boston, 1987.
[9]
G. A. Süer, R. Lobo, R. Vazquez, J. Santos, “Evolutionary Programming for
Minimizing nT with Non-zero Ready Times,” Proceedings of the 33rd International Conference on Computers and Industrial Engineering, March 25-27 2004, Jeju, Korea. [10] G. A. Süer, R. Vazquez, J. Santos, “Evolutionary Programming for Minimizing the
Average Flow Time in the presence of Non-zero Ready Times,” Computers & Industrial Engineering, Vol. 45, p. 331-344, 2003. [11] G. A. Süer, A. K. Subramanian, R. Vazquez, J. Santos, “Evolutionary
Programming for Minimizing Maximum Tardiness in the presence of Non-zero Ready Times,” Smart Engineering System Design, Vol. 12, p. 267-273, 2002. [12] G. A. Süer, J. Santos, R. Vazquez, S. Chakravarty, D. Allard, “A Mixer Approach
for Multiple Criteria Single Machine Scheduling by Using Genetic Algorithms,” Intelligent Engineering Systems Through Artificial Neural Networks, Volume 14, November 2004, p. 301-306. [13] G. A. Süer, F. Arikan, C. Babayiğit, “Effects of Different Fuzzy Operators on
Fuzzy Bi-Objective Cell Loading Problem in Labor Intensive Manufacturing Cells,” Istanbul Conference Special Issue with Computers and Industrial Engineering, July 2006. [14] “Traveling Salesman Problem,” University of Heidelberg Department of Computer Science. November 2004. http://www.iwr.uni-heidelberg.de/groups/comopt/software/TSPLIB95/
73 [15] K. R. Sasikala, M. Petrou, “Generalised Fuzzy Aggregation in Estimating the Risk
of Desertification of a Burned Forest,” Fuzzy Sets and Systems, Volume 118, Issue 1, February 2001, Pages 121-137. [16] B.M. Werners, “Aggregation Models in Mathematical Programming,” In
Mathematical Models for Decision Support, edited by G. Mitra, pp. 295-305, 1988 (Springer: Berlin).
74
8
APPENDIX 8.1 Maximum Generation versus Population Size Results
Replication Number 1 2 3 4 5 6 7 8 9 10 1 2 3 4 5 6 7 8 9 10 1 2
Max Gen 500 500 500 500 500 500 500 500 500 500 500 500 500 500 500 500 500 500 500 500 500 500
Pop Size 20 20 20 20 20 20 20 20 20 20 30 30 30 30 30 30 30 30 30 30 40 40
Chromosome 2, 4, 5, 9, 7, 12, 3, 14, 15, 1, 13, 17, 16, 6, 10, 20, 8, 18, 11, 19 1, 2, 4, 6, 3, 7, 9, 12, 13, 10, 14, 5, 8, 15, 18, 19, 11, 17, 16, 20 3, 4, 7, 8, 9, 11, 10, 5, 13, 15, 2, 1, 18, 6, 20, 14, 12, 19, 17, 16 1, 3, 6, 7, 8, 11, 13, 15, 14, 5, 2, 4, 17, 12, 20, 9, 19, 10, 18, 16 1, 2, 8, 9, 10, 12, 3, 5, 7, 16, 4, 18, 6, 13, 14, 11, 19, 15, 20, 17 2, 4, 7, 8, 3, 10, 12, 13, 15, 1, 14, 5, 17, 6, 19, 20, 9, 16, 11, 18 2, 6, 7, 9, 5, 1, 4, 3, 14, 10, 12, 16, 8, 13, 11, 20, 15, 17, 19, 18 1, 2, 4, 5, 6, 7, 9, 3, 10, 12, 8, 16, 11, 14, 15, 13, 18, 20, 19, 17 2, 5, 10, 11, 9, 13, 15, 16, 17, 1, 7, 3, 4, 14, 20, 6, 8, 19, 12, 18 1, 2, 4, 7, 11, 12, 3, 8, 6, 5, 18, 19, 20, 10, 14, 9, 15, 16, 13, 17 1, 2, 4, 5, 6, 3, 7, 8, 9, 12, 10, 15, 16, 17, 19, 20, 11, 14, 13, 18 4, 6, 7, 11, 12, 14, 15, 1, 9, 17, 5, 2, 3, 10, 20, 19, 8, 13, 16, 18 4, 5, 6, 7, 1, 3, 9, 10, 11, 13, 2, 16, 15, 14, 8, 19, 20, 12, 18, 17 3, 4, 6, 7, 2, 8, 10, 11, 1, 12, 14, 5, 9, 13, 17, 18, 19, 20, 16, 15 1, 4, 5, 7, 11, 13, 14, 3, 16, 2, 10, 18, 19, 6, 9, 8, 20, 12, 17, 15 1, 2, 4, 7, 8, 10, 5, 9, 3, 6, 15, 12, 13, 14, 11, 18, 19, 20, 16, 17 1, 4, 7, 8, 9, 11, 12, 14, 15, 3, 5, 2, 6, 20, 17, 10, 16, 18, 13, 19 1, 4, 5, 6, 7, 2, 9, 11, 12, 3, 16, 10, 8, 14, 18, 19, 20, 13, 15, 17 1, 2, 3, 4, 6, 5, 8, 7, 11, 12, 13, 14, 15, 10, 9, 19, 16, 17, 18, 20 1, 3, 6, 2, 5, 4, 10, 11, 13, 14, 15, 17, 18, 20, 9, 7, 8, 19, 12, 16 1, 3, 4, 7, 8, 11, 12, 5, 2, 10, 13, 6, 9, 17, 19, 20, 14, 15, 18, 16 1, 2, 3, 4, 6, 7, 9, 11, 5, 10, 16, 8, 18, 19, 12, 13, 14, 20, 15, 17
Generation Found
Fitness
NT
Tmax
401 491 261 327 423 382 347 355 493 351 236 469 275 485 499 483 488 284 269 474 157 429
2.84 3.10 2.91 2.86 2.78 2.97 2.90 3.14 2.62 2.82 3.29 2.73 3.12 3.17 2.82 3.16 2.88 3.21 3.35 2.92 3.05 3.12
11 10 10 11 12 9 13 11 12 11 6 11 9 9 10 10 10 8 8 9 10 9
81 60 80 79 80 80 52 42 98 78 66 92 61 57 87 47 80 53 34 90 60 59
TT
Favg
Computation Time
545 296 512 531 598 494 495 271 765 624 247 698 355 273 646 299 584 342 208 495 410 376
32.95 20.45 31.15 32.1 35.6 30.25 30.3 19.1 43.95 36.75 18 40.45 23.3 19.2 37.85 20.5 34.75 22.65 16.1 30.45 26.05 24.35
96.203 19.266 20.437 19.859 20.141 24.829 20.031 20.563 20.062 29.546 40.875 42.125 37.937 37.011 46.683 39.158 36.426 37.176 38.205 36.94 57.535 66.839
75
4
500
40
1, 2, 4, 5, 6, 7, 3, 9, 10, 12, 8, 17, 18, 13, 11, 14, 16, 15, 20, 19
285
3.14
9
57
346
22.85
61.671
5 6 7 8 9 10 1 2 3 4 5 6 7 8 9 10 1 2 3 4 5 6 7 8 9 10 1 2 3 4
500 500 500 500 500 500 500 500 500 500 500 500 500 500 500 500 1000 1000 1000 1000 1000 1000 1000 1000 1000 1000 1000 1000 1000 1000
40 40 40 40 40 40 50 50 50 50 50 50 50 50 50 50 20 20 20 20 20 20 20 20 20 20 30 30 30 30
1, 2, 3, 5, 8, 9, 10, 6, 12, 13, 4, 7, 17, 18, 19, 14, 11, 15, 20, 16 1, 2, 3, 4, 8, 10, 13, 14, 5, 16, 18, 19, 20, 6, 9, 7, 15, 11, 17, 12 1, 3, 5, 6, 9, 11, 7, 13, 14, 15, 2, 8, 4, 19, 20, 16, 10, 18, 12, 17 1, 2, 5, 6, 7, 12, 13, 3, 8, 4, 17, 11, 19, 20, 9, 10, 18, 14, 15, 16 1, 2, 3, 4, 11, 6, 13, 15, 16, 5, 9, 8, 7, 20, 14, 10, 19, 12, 18, 17 1, 2, 3, 6, 5, 7, 8, 9, 10, 4, 13, 14, 11, 16, 17, 12, 19, 15, 20, 18 1, 2, 4, 5, 6, 3, 8, 12, 13, 9, 10, 7, 18, 11, 20, 14, 15, 16, 17, 19 1, 2, 4, 7, 8, 12, 13, 3, 14, 5, 10, 6, 9, 15, 18, 11, 20, 17, 19, 16 2, 6, 7, 8, 9, 10, 3, 1, 12, 13, 4, 5, 16, 14, 18, 11, 20, 15, 19, 17 1, 4, 6, 7, 9, 5, 2, 3, 8, 10, 15, 12, 13, 11, 18, 19, 14, 16, 20, 17 1, 3, 5, 6, 7, 2, 4, 11, 12, 10, 8, 16, 9, 13, 18, 19, 20, 14, 15, 17 1, 3, 4, 5, 6, 7, 9, 2, 12, 13, 11, 16, 8, 18, 10, 20, 14, 15, 19, 17 2, 4, 6, 7, 5, 8, 9, 10, 12, 13, 1, 3, 16, 14, 11, 15, 20, 17, 19, 18 1, 2, 4, 5, 6, 7, 3, 8, 9, 11, 12, 10, 13, 14, 15, 19, 18, 16, 17, 20 1, 2, 5, 6, 7, 8, 10, 3, 4, 13, 14, 9, 16, 17, 11, 19, 20, 12, 15, 18 1, 2, 3, 4, 5, 7, 8, 9, 12, 10, 14, 6, 16, 13, 11, 19, 15, 20, 17, 18 2, 5, 6, 3, 7, 8, 4, 10, 9, 12, 1, 15, 16, 17, 18, 19, 20, 11, 14, 13 2, 3, 5, 6, 7, 1, 4, 11, 12, 15, 16, 17, 18, 19, 20, 9, 8, 10, 14, 13 1, 3, 5, 4, 7, 8, 9, 2, 6, 11, 14, 12, 17, 10, 13, 19, 20, 15, 18, 16 1, 2, 4, 5, 3, 7, 8, 10, 11, 6, 9, 14, 13, 15, 12, 19, 20, 16, 17, 18 1, 2, 6, 8, 9, 12, 13, 14, 3, 5, 4, 10, 11, 7, 19, 15, 16, 17, 20, 18 1, 2, 4, 12, 13, 3, 6, 8, 5, 10, 17, 7, 19, 9, 11, 20, 15, 18, 14, 16 1, 2, 8, 9, 10, 11, 12, 3, 15, 7, 17, 13, 5, 19, 4, 6, 18, 14, 20, 16 1, 2, 3, 4, 6, 11, 12, 15, 16, 5, 10, 8, 9, 7, 20, 14, 13, 17, 19, 18 4, 5, 6, 10, 12, 15, 17, 18, 19, 20, 3, 1, 14, 2, 8, 7, 9, 13, 11, 16 1, 2, 6, 7, 8, 11, 12, 14, 5, 3, 16, 4, 18, 19, 10, 9, 13, 15, 20, 17 1, 2, 4, 6, 8, 12, 14, 15, 3, 10, 13, 5, 7, 11, 9, 20, 19, 16, 18, 17 1, 2, 4, 5, 3, 7, 6, 9, 10, 12, 13, 8, 18, 19, 11, 14, 15, 20, 16, 17 1, 4, 6, 3, 2, 5, 7, 9, 11, 14, 15, 16, 10, 8, 13, 12, 20, 19, 18, 17 1, 2, 4, 5, 6, 10, 11, 12, 13, 3, 8, 7, 18, 9, 20, 14, 19, 15, 16, 17
373 494 380 475 372 401 442 377 417 405 428 414 495 455 319 422 885 961 406 643 824 803 841 909 654 996 909 880 908 1000
3.17 2.87 2.98 2.93 2.89 3.38 3.09 3.02 3.14 3.03 3.19 3.21 3.12 3.29 3.25 3.28 3.17 3.08 3.11 3.28 2.97 2.70 2.81 2.96 2.56 3.01 2.94 3.13 3.09 3.10
8 8 9 10 11 7 10 11 9 12 9 8 9 9 7 8 8 7 10 9 11 13 10 10 10 9 11 9 11 9
61 100 77 72 70 42 53 56 54 46 49 54 65 41 59 45 66 84 56 39 60 78 97 71 117 73 66 60 50 59
351 630 495 556 561 182 395 394 385 364 303 331 310 163 296 251 302 421 317 214 487 691 571 490 948 482 482 342 308 423
23.25 37.2 30.45 33.35 33.75 14.8 25.45 25.25 24.8 23.75 20.7 22.1 21.05 13.7 20.35 18.1 20.75 26.6 21.5 16.25 30.05 40.25 34.25 30.2 53.1 29.65 29.8 22.65 21.1 26.85
65.529 59.315 64.493 69.242 58.384 59.822 84.447 87.105 82.121 83.762 90.967 79.154 91.904 82.874 91.999 80.452 41.343 44.655 38.312 35.078 38.656 43.203 44.406 43.937 44.312 39.702 67.546 72.765 62.171 69.968
76
6
1000
30
1, 2, 6, 7, 4, 9, 10, 11, 13, 14, 3, 8, 5, 12, 17, 19, 20, 15, 18, 16
858
3.20
8
57
325
21.8
79.467
7 8 9 10 1 2 3 4 5 6 7 8 9 10 1 2 3 4 5 6 7 8 9 10 1 2 3 4 5 6
1000 1000 1000 1000 1000 1000 1000 1000 1000 1000 1000 1000 1000 1000 1000 1000 1000 1000 1000 1000 1000 1000 1000 1000 1500 1500 1500 1500 1500 1500
30 30 30 30 40 40 40 40 40 40 40 40 40 40 50 50 50 50 50 50 50 50 50 50 20 20 20 20 20 20
1, 2, 3, 4, 5, 6, 11, 12, 13, 10, 9, 7, 17, 8, 14, 19, 20, 18, 15, 16 1, 2, 3, 4, 5, 8, 9, 10, 6, 12, 13, 14, 16, 7, 18, 11, 20, 15, 19, 17 1, 2, 3, 5, 4, 7, 9, 8, 12, 6, 10, 11, 16, 14, 13, 19, 20, 15, 18, 17 1, 3, 4, 6, 5, 7, 8, 2, 10, 12, 14, 15, 16, 9, 18, 19, 11, 13, 17, 20 1, 4, 5, 6, 7, 9, 11, 12, 14, 15, 16, 17, 19, 2, 3, 18, 10, 13, 20, 8 1, 2, 4, 5, 6, 8, 9, 12, 13, 3, 10, 7, 11, 17, 18, 19, 14, 20, 15, 16 1, 4, 5, 6, 7, 8, 9, 10, 11, 3, 2, 16, 17, 18, 19, 20, 12, 14, 13, 15 1, 2, 3, 4, 6, 7, 5, 8, 11, 12, 13, 15, 17, 18, 10, 9, 20, 14, 19, 16 2, 3, 4, 5, 1, 8, 9, 11, 12, 14, 6, 7, 17, 19, 20, 10, 13, 18, 15, 16 1, 2, 3, 4, 6, 7, 8, 12, 13, 14, 5, 10, 9, 11, 17, 15, 20, 16, 19, 18 1, 2, 3, 4, 5, 6, 8, 9, 10, 11, 15, 14, 7, 13, 12, 19, 20, 17, 16, 18 1, 3, 4, 6, 7, 8, 2, 10, 11, 12, 5, 9, 14, 16, 17, 13, 20, 15, 19, 18 1, 2, 3, 5, 4, 7, 11, 12, 13, 6, 10, 14, 9, 8, 16, 18, 19, 15, 17, 20 1, 2, 4, 5, 7, 8, 12, 13, 14, 3, 10, 9, 6, 15, 18, 11, 20, 16, 19, 17 1, 2, 4, 5, 6, 7, 9, 10, 3, 12, 14, 15, 8, 13, 11, 18, 20, 16, 17, 19 2, 4, 5, 6, 7, 8, 9, 10, 1, 3, 12, 13, 14, 15, 16, 11, 18, 19, 20, 17 2, 4, 5, 6, 7, 3, 8, 1, 10, 11, 12, 14, 15, 13, 9, 17, 18, 19, 16, 20 1, 2, 3, 4, 8, 9, 5, 6, 7, 13, 14, 15, 10, 11, 17, 12, 20, 16, 19, 18 1, 5, 6, 2, 8, 9, 11, 12, 14, 7, 3, 4, 17, 18, 19, 20, 10, 13, 15, 16 1, 2, 4, 6, 3, 7, 9, 11, 12, 5, 10, 14, 8, 16, 17, 18, 13, 15, 20, 19 1, 4, 5, 6, 7, 8, 11, 12, 3, 14, 2, 10, 16, 17, 18, 9, 13, 19, 20, 15 1, 3, 4, 5, 6, 7, 2, 10, 11, 12, 13, 14, 15, 8, 9, 19, 20, 16, 17, 18 1, 2, 3, 4, 8, 9, 11, 6, 13, 14, 5, 7, 10, 12, 17, 18, 20, 15, 16, 19 3, 4, 5, 7, 1, 2, 9, 10, 11, 6, 13, 14, 15, 8, 12, 18, 19, 16, 17, 20 1, 2, 5, 6, 3, 7, 8, 11, 4, 15, 10, 12, 17, 14, 9, 19, 20, 13, 18, 16 1, 3, 5, 6, 7, 4, 9, 12, 13, 2, 16, 17, 8, 19, 20, 10, 11, 18, 14, 15 4, 8, 9, 12, 13, 14, 2, 1, 16, 3, 5, 6, 11, 19, 10, 7, 20, 15, 17, 18 1, 2, 3, 4, 7, 5, 8, 9, 11, 12, 14, 6, 10, 16, 17, 15, 13, 20, 18, 19 2, 3, 4, 5, 6, 7, 8, 1, 14, 10, 11, 16, 9, 13, 12, 15, 17, 19, 20, 18 1, 4, 6, 8, 9, 11, 2, 13, 14, 3, 10, 7, 5, 12, 16, 18, 19, 20, 17, 15
698 669 631 553 713 833 929 958 989 987 860 966 949 885 955 981 933 920 887 891 941 945 319 544 388 1220 1494 856 1274 1478
3.20 3.34 3.16 3.26 2.96 3.22 3.28 3.32 3.13 3.27 3.33 3.27 3.19 3.15 3.36 3.51 3.44 3.25 3.11 3.31 3.18 3.42 3.25 3.31 3.17 3.11 2.74 3.36 3.12 3.14
8 6 10 7 7 8 6 6 8 8 7 8 10 9 7 4 6 9 8 8 8 6 8 8 9 8 12 7 11 9
58 55 48 60 104 56 60 60 67 48 48 48 44 57 40 48 42 39 67 43 62 40 48 40 53 67 80 45 42 57
310 251 268 257 488 283 332 238 377 250 226 246 257 331 247 157 158 276 412 212 317 225 298 249 319 433 685 193 314 345
21.2 18.25 19.05 18.55 29.95 19.85 22.15 17.45 24.55 18.05 17 17.85 18.5 22.1 17.9 13.4 13.45 19.5 26.3 16.25 21.4 16.8 20.6 18 21.6 27.2 39.95 15.2 21.25 22.95
75.858 71.624 69.921 71.499 118.561 111.342 102.905 115.796 146.545 107.123 102.327 117.17 115.905 111.249 140.889 163.404 146.389 183.982 145.889 135.717 156.936 150.155 175.514 142.857 53.655 64.577 58.936 53.515 53.562 53.015
77
8
1500
20
1, 3, 4, 5, 7, 8, 9, 10, 11, 6, 14, 15, 2, 17, 19, 20, 12, 16, 13, 18
1008
3.24
6
71
317
21.4
56.172
9 10 1 2 3 4 5 6 7 8 9 10 1 2 3 4 5 6 7 8 9 10 1 2 3 4 5 6 7 8
1500 1500 1500 1500 1500 1500 1500 1500 1500 1500 1500 1500 1500 1500 1500 1500 1500 1500 1500 1500 1500 1500 1500 1500 1500 1500 1500 1500 1500 1500
20 20 30 30 30 30 30 30 30 30 30 30 40 40 40 40 40 40 40 40 40 40 50 50 50 50 50 50 50 50
1, 5, 6, 7, 3, 2, 9, 4, 12, 15, 16, 17, 8, 20, 14, 10, 11, 13, 18, 19 1, 4, 5, 8, 9, 10, 12, 13, 3, 2, 6, 7, 17, 14, 19, 20, 11, 15, 18, 16 1, 2, 4, 6, 7, 3, 8, 5, 11, 12, 14, 10, 13, 9, 17, 18, 20, 19, 15, 16 1, 2, 3, 4, 6, 7, 8, 15, 16, 5, 10, 13, 18, 11, 9, 14, 19, 12, 20, 17 1, 2, 3, 7, 8, 9, 12, 4, 16, 5, 6, 10, 18, 19, 20, 11, 14, 13, 15, 17 1, 2, 4, 6, 8, 11, 10, 9, 13, 14, 3, 5, 12, 7, 17, 18, 19, 20, 16, 15 1, 2, 3, 4, 7, 8, 9, 10, 11, 5, 13, 14, 6, 16, 12, 18, 20, 15, 19, 17 1, 3, 4, 6, 2, 8, 9, 11, 12, 5, 14, 10, 7, 17, 18, 13, 20, 15, 16, 19 2, 4, 5, 7, 8, 9, 10, 3, 1, 6, 14, 15, 16, 17, 11, 19, 20, 12, 13, 18 2, 4, 3, 6, 7, 8, 9, 10, 11, 1, 14, 15, 16, 5, 18, 20, 13, 12, 19, 17 1, 2, 3, 4, 6, 9, 10, 11, 14, 5, 7, 8, 17, 18, 19, 20, 13, 12, 15, 16 1, 2, 4, 5, 6, 7, 8, 3, 10, 11, 12, 15, 16, 9, 18, 13, 20, 14, 17, 19 1, 2, 3, 4, 5, 7, 8, 11, 6, 13, 15, 16, 9, 10, 14, 12, 19, 20, 17, 18 2, 3, 6, 7, 9, 11, 12, 1, 14, 15, 5, 4, 8, 10, 13, 19, 20, 18, 16, 17 1, 2, 4, 5, 6, 8, 11, 12, 13, 3, 7, 16, 9, 18, 10, 14, 20, 19, 15, 17 1, 3, 4, 6, 8, 2, 10, 11, 12, 5, 14, 7, 16, 9, 13, 18, 17, 15, 20, 19 1, 2, 3, 4, 6, 7, 8, 9, 11, 12, 13, 10, 5, 16, 17, 18, 19, 14, 20, 15 1, 2, 4, 5, 7, 3, 8, 11, 12, 13, 14, 6, 10, 16, 9, 19, 20, 15, 18, 17 1, 2, 4, 6, 7, 11, 12, 13, 3, 5, 9, 10, 8, 17, 18, 14, 20, 15, 16, 19 1, 3, 4, 5, 6, 2, 8, 9, 7, 12, 13, 14, 15, 10, 11, 16, 17, 19, 20, 18 1, 2, 4, 5, 6, 9, 10, 11, 7, 13, 14, 15, 3, 8, 17, 18, 12, 20, 19, 16 1, 2, 4, 5, 6, 7, 8, 11, 13, 14, 15, 3, 17, 18, 19, 9, 10, 12, 20, 16 1, 2, 3, 4, 5, 7, 8, 11, 6, 13, 9, 16, 18, 19, 20, 10, 14, 12, 15, 17 1, 2, 4, 8, 9, 10, 11, 12, 13, 3, 5, 6, 16, 7, 19, 20, 18, 14, 15, 17 1, 2, 3, 4, 6, 7, 11, 12, 5, 9, 8, 10, 14, 13, 17, 19, 15, 16, 18, 20 1, 3, 4, 5, 6, 2, 8, 9, 10, 7, 13, 14, 15, 11, 12, 16, 19, 20, 17, 18 2, 4, 5, 6, 7, 8, 9, 10, 11, 1, 3, 14, 15, 12, 17, 19, 20, 13, 18, 16 1, 2, 3, 4, 5, 7, 8, 11, 13, 14, 15, 10, 6, 9, 18, 19, 20, 12, 16, 17 1, 2, 3, 4, 7, 8, 11, 13, 14, 15, 5, 6, 12, 18, 9, 10, 20, 19, 16, 17 1, 2, 4, 7, 8, 9, 10, 12, 13, 14, 3, 6, 5, 11, 18, 19, 20, 15, 16, 17
1330 1238 1361 1470 1254 284 1382 1394 1228 816 1497 1393 1213 1212 1112 1227 1143 1110 692 1416 1318 920 1432 893 1416 1340 1492 1229 1102 1370
2.99 3.05 3.25 3.00 3.02 3.21 3.38 3.25 3.24 3.21 3.20 3.38 3.35 3.06 3.20 3.23 3.45 3.32 3.14 3.46 3.29 3.26 3.20 3.17 3.17 3.44 3.34 3.31 3.17 3.25
10 9 8 10 9 8 6 8 7 7 7 6 7 9 8 9 5 7 9 7 6 6 7 8 10 7 6 6 8 7
68 66 55 66 66 57 48 48 59 66 63 49 42 67 56 44 49 48 56 28 66 66 67 57 43 30 55 59 59 57
462 467 224 447 521 289 227 289 316 316 360 218 239 427 341 284 159 259 365 133 239 320 338 392 300 168 254 271 365 331
28.65 29.05 16.75 27.9 31.6 20.15 16.9 20.15 21.35 21.35 23.7 16.45 17.5 26.9 22.75 19.9 13.5 18.5 23.8 12.35 17.65 21.55 22.45 25.3 20.55 14.1 18.25 19.1 23.8 22.1
54.077 52.608 91.936 103.467 108.248 110.077 100.842 109.499 113.404 111.467 109.827 103.39 158.358 155.31 144.998 150.623 189.607 162.966 158.17 181.217 146.53 158.498 330.714 212.325 247.262 247.857 260.403 238.028 261.699 1310.031
78
10
1500
50
1, 2, 3, 4, 5, 6, 7, 11, 12, 13, 14, 10, 9, 8, 17, 18, 19, 20, 15, 16
1173
3.45
5
48
177
14.4
201.809
1 2 3 4 5 6 7 8 9 10 1 2 3 4 5 6 7 8 9 10 1 2 3 4 5 6 7 8 9 10
2000 2000 2000 2000 2000 2000 2000 2000 2000 2000 2000 2000 2000 2000 2000 2000 2000 2000 2000 2000 2000 2000 2000 2000 2000 2000 2000 2000 2000 2000
20 20 20 20 20 20 20 20 20 20 30 30 30 30 30 30 30 30 30 30 40 40 40 40 40 40 40 40 40 40
1, 4, 5, 6, 9, 10, 11, 12, 2, 3, 8, 16, 7, 18, 19, 14, 13, 20, 15, 17 2, 4, 5, 7, 8, 10, 1, 12, 15, 3, 6, 17, 18, 19, 20, 14, 9, 13, 11, 16 2, 4, 5, 6, 7, 3, 8, 9, 11, 1, 10, 13, 15, 12, 17, 20, 14, 18, 19, 16 4, 6, 7, 8, 9, 10, 1, 2, 13, 15, 18, 19, 3, 5, 14, 12, 20, 11, 16, 17 1, 2, 3, 4, 5, 6, 7, 14, 15, 16, 10, 9, 8, 19, 20, 11, 12, 13, 17, 18 1, 4, 3, 6, 7, 8, 5, 2, 12, 13, 15, 16, 10, 9, 14, 11, 19, 20, 18, 17 3, 4, 7, 8, 9, 11, 12, 13, 14, 1, 2, 10, 5, 6, 18, 19, 20, 15, 16, 17 1, 2, 4, 7, 8, 12, 13, 3, 5, 10, 6, 9, 17, 14, 11, 19, 18, 15, 20, 16 1, 2, 4, 5, 6, 7, 3, 8, 9, 10, 11, 12, 13, 15, 17, 14, 20, 16, 18, 19 1, 2, 3, 4, 6, 7, 8, 5, 10, 12, 13, 14, 15, 16, 19, 9, 11, 20, 17, 18 1, 3, 4, 8, 9, 10, 5, 6, 2, 13, 15, 16, 17, 14, 7, 19, 20, 11, 12, 18 1, 2, 3, 4, 5, 6, 7, 8, 9, 12, 13, 15, 16, 10, 14, 11, 18, 20, 19, 17 1, 2, 3, 7, 9, 11, 12, 13, 14, 5, 6, 16, 4, 18, 19, 8, 10, 17, 20, 15 1, 2, 3, 4, 5, 6, 7, 8, 11, 13, 15, 10, 9, 12, 18, 20, 14, 19, 16, 17 1, 2, 4, 5, 6, 3, 7, 8, 9, 11, 12, 13, 14, 15, 10, 17, 19, 20, 16, 18 2, 3, 4, 6, 7, 8, 9, 1, 16, 17, 5, 10, 13, 19, 20, 14, 11, 12, 18, 15 1, 2, 4, 7, 9, 10, 3, 6, 12, 5, 14, 13, 11, 8, 17, 18, 19, 15, 16, 20 1, 2, 3, 4, 5, 6, 7, 11, 14, 15, 8, 9, 10, 13, 12, 16, 20, 19, 17, 18 1, 2, 3, 4, 8, 9, 12, 13, 14, 5, 6, 17, 18, 19, 20, 7, 10, 11, 15, 16 1, 4, 5, 6, 3, 7, 8, 2, 11, 10, 9, 13, 14, 15, 12, 16, 18, 20, 19, 17 2, 3, 4, 5, 6, 7, 1, 9, 11, 13, 14, 15, 8, 10, 12, 18, 19, 20, 16, 17 1, 4, 5, 6, 7, 8, 9, 10, 3, 2, 12, 13, 14, 15, 16, 17, 11, 20, 19, 18 1, 2, 3, 4, 5, 6, 7, 8, 9, 12, 10, 11, 17, 18, 13, 14, 15, 16, 20, 19 1, 2, 3, 4, 5, 8, 9, 11, 12, 6, 15, 7, 18, 19, 20, 10, 14, 13, 16, 17 1, 2, 4, 5, 8, 9, 10, 11, 6, 13, 3, 7, 18, 19, 20, 12, 14, 15, 16, 17 2, 3, 4, 6, 7, 9, 11, 12, 1, 14, 10, 5, 13, 16, 8, 18, 19, 20, 15, 17 1, 2, 3, 4, 5, 6, 7, 8, 10, 11, 12, 13, 16, 9, 14, 19, 20, 15, 17, 18 1, 2, 3, 5, 6, 8, 9, 4, 13, 15, 10, 7, 17, 18, 19, 14, 11, 12, 16, 20 1, 3, 4, 5, 7, 8, 2, 10, 11, 12, 13, 6, 9, 16, 17, 19, 14, 15, 20, 18 2, 3, 4, 6, 5, 7, 1, 9, 11, 13, 14, 15, 8, 17, 10, 12, 19, 20, 18, 16
1347 1909 1717 1856 1858 1201 1287 1814 1850 1948 1902 1681 1730 1651 1929 1781 1549 1138 1644 1743 1874 1957 1391 1812 1845 1512 1984 1618 1651 1763
3.12 3.04 3.24 2.79 3.11 3.23 3.12 3.01 3.51 3.29 3.14 3.51 3.08 3.32 3.57 2.99 3.23 3.24 3.06 3.36 3.42 3.46 3.32 3.19 3.15 3.25 3.45 3.17 3.35 3.33
9 8 8 10 8 9 8 11 5 6 8 5 8 7 4 9 9 9 7 8 6 5 8 7 8 7 5 8 7 7
57 76 55 99 66 43 66 56 39 66 66 38 73 49 39 75 43 40 85 38 40 46 40 67 59 61 48 61 44 47
395 483 258 600 427 281 420 424 150 251 371 145 424 245 114 495 282 294 451 153 213 171 233 348 407 274 192 346 237 236
25.45 29.7 18.45 35.55 26.9 19.6 26.55 26.75 13.05 18.1 24.25 12.8 26.75 17.8 11.35 30.3 19.65 20.25 28.25 13.3 16.2 14.1 17.2 23.1 26.05 19.25 15.15 23 17.4 17.5
71.03 70.827 72.155 84.514 73.249 72.046 71.655 69.046 68.936 73.499 126.889 116.077 155.17 124.061 125.499 123.123 126.873 131.623 146.576 127.185 196.748 203.919 217.747 241.919 186.56 208.591 220.81 199.591 207.309 218.2
79
2
2000
50
1, 2, 4, 5, 6, 8, 9, 10, 11, 3, 13, 14, 7, 12, 17, 18, 19, 20, 15, 16
1978
3.44
5
48
196
15.5
309.73
3 4 5 6 7 8 9 10
2000 2000 2000 2000 2000 2000 2000 2000
50 50 50 50 50 50 50 50
1, 4, 5, 6, 7, 8, 2, 10, 3, 12, 13, 9, 14, 11, 18, 19, 15, 16, 17, 20 1, 2, 3, 4, 5, 6, 7, 8, 9, 10, 11, 12, 13, 15, 17, 18, 19, 20, 14, 16 2, 3, 4, 6, 7, 9, 11, 12, 1, 14, 10, 8, 16, 5, 13, 15, 18, 20, 19, 17 1, 2, 3, 4, 5, 6, 8, 11, 12, 15, 7, 10, 9, 18, 19, 20, 13, 14, 16, 17 1, 2, 5, 6, 3, 7, 8, 9, 10, 11, 12, 4, 16, 17, 18, 20, 13, 14, 15, 19 1, 2, 4, 6, 8, 9, 10, 11, 12, 3, 14, 5, 7, 16, 18, 19, 20, 13, 15, 17 1, 2, 4, 5, 6, 7, 8, 9, 13, 14, 3, 10, 11, 12, 17, 18, 19, 20, 15, 16 1, 3, 4, 6, 7, 5, 8, 9, 15, 2, 17, 19, 20, 10, 14, 11, 12, 13, 18, 16
1276 1960 1819 1408 1773 1323 1975 1995
3.24 3.63 3.12 3.27 3.35 3.33 3.34 3.00
9 2 9 7 6 6 6 9
42 49 66 53 53 53 57 71
281 89 286 314 253 288 216 512
19.6 10 19.85 21.4 18.3 20.1 16.35 31.15
308.684 358.011 273.606 270.372 371.167 285.324 244.418 284.184
8.2 Crossover versus Mutation Results
Replication Number
Prob Cr
Prob Mut
Chromosome
Gen Found
Fitness
NT
Tmax
TT
Favg
1225
66.8
Computation Time
1
0%
0%
7, 4, 9, 11, 13, 18, 19, 20, 3, 10, 2, 6, 15, 17, 1, 8, 5, 16, 12, 14
0
1.54
13
145
130.389
2
0%
0%
1, 7, 11, 4, 12, 6, 9, 8, 2, 17, 15, 18, 20, 14, 5, 13, 19, 16, 10, 3
0
2.14
17
138
870
49.05
53.984
3
0%
0%
5, 11, 9, 4, 2, 7, 16, 17, 14, 10, 20, 18, 3, 15, 19, 6, 1, 8, 12, 13
0
2.03
17
145
1059
58.65
53.921
4
0%
0%
1, 4, 5, 8, 14, 13, 11, 15, 19, 2, 17, 20, 6, 9, 7, 3, 18, 16, 10, 12
0
2.26
14
135
984
54.9
53.968
5
0%
0%
6, 2, 3, 13, 15, 14, 12, 1, 8, 9, 7, 10, 11, 16, 18, 19, 4, 20, 5, 17
0
2.16
17
131
894
50.4
53.999
6
0%
0%
5, 4, 7, 12, 3, 16, 10, 9, 19, 2, 1, 6, 13, 11, 18, 15, 17, 8, 20, 14
0
2.22
15
124
1064
58.85
54.03
7
0%
0%
10, 9, 13, 14, 1, 8, 3, 4, 2, 15, 12, 18, 7, 17, 11, 6, 19, 5, 16, 20
0
2.11
17
130
1023
56.85
53.937
8
0%
0%
5, 10, 12, 13, 3, 15, 11, 8, 2, 1, 16, 18, 9, 4, 17, 20, 6, 19, 14, 7
0
2.19
16
127
996
55.5
53.952
9
0%
0%
12, 3, 13, 7, 9, 10, 5, 15, 1, 4, 6, 14, 19, 2, 18, 11, 8, 20, 17, 16
0
2.10
19
111
1034
57.4
53.984
10
0%
0%
9, 11, 6, 3, 1, 13, 4, 18, 15, 12, 2, 14, 17, 5, 20, 8, 7, 19, 16, 10
0
1.53
17
122
1128
62.1
54.171
1
0%
20%
2, 4, 6, 7, 3, 5, 8, 10, 11, 1, 15, 13, 9, 18, 19, 16, 12, 14, 17, 20
951
3.01
11
62
365
23.8
101.655
2
0%
20%
1, 2, 4, 6, 8, 3, 5, 13, 15, 7, 11, 14, 10, 18, 9, 20, 12, 19, 17, 16
599
2.98
11
61
444
27.9
99.983
3
0%
20%
4, 6, 7, 1, 9, 11, 12, 13, 14, 8, 10, 2, 5, 16, 3, 17, 18, 19, 20, 15
988
2.85
12
82
402
25.65
98.577
4
0%
20%
1, 2, 4, 6, 7, 11, 12, 3, 13, 5, 10, 9, 8, 16, 15, 19, 20, 14, 18, 17
767
3.06
11
52
340
22.55
112.702
80
5
0%
20%
1, 3, 2, 5, 7, 9, 10, 11, 12, 6, 15, 4, 18, 8, 20, 16, 19, 14, 13, 17
862
3.05
9
70
424
26.75
6
0%
20%
3, 2, 6, 7, 4, 5, 9, 1, 12, 15, 16, 17, 13, 10, 19, 20, 8, 18, 14, 11
938
2.94
10
82
431
27.1
98.701 99.405
7
0%
20%
3, 4, 5, 6, 7, 9, 2, 12, 13, 1, 11, 16, 10, 15, 18, 14, 20, 8, 17, 19
920
2.92
11
79
373
24.2
100.342
8
0%
20%
4, 5, 2, 6, 3, 7, 10, 12, 13, 14, 9, 1, 11, 17, 19, 8, 15, 20, 16, 18
999
2.89
12
73
409
26.15
99.436
9
0%
20%
2, 4, 5, 6, 8, 1, 11, 10, 3, 7, 14, 12, 9, 16, 15, 13, 17, 20, 18, 19
448
3.06
12
47
280
19.7
100.217
10
0%
20%
1, 3, 2, 6, 7, 4, 11, 8, 13, 10, 5, 14, 12, 17, 9, 19, 15, 16, 18, 20
909
2.97
13
51
332
22.15
100.139
1
0%
40%
2, 3, 6, 1, 8, 9, 4, 5, 13, 10, 15, 14, 12, 7, 17, 11, 18, 20, 19, 16
924
2.96
13
53
335
22.45
127.186
2
0%
40%
1, 4, 6, 7, 10, 9, 11, 8, 3, 16, 17, 5, 2, 14, 13, 19, 12, 18, 20, 15
714
2.71
13
92
513
31.2
126.701
3
0%
40%
4, 5, 6, 10, 7, 12, 2, 9, 14, 16, 3, 1, 13, 11, 19, 15, 20, 8, 17, 18
417
2.70
13
88
573
34.35
126.592
4
0%
40%
1, 4, 5, 6, 9, 11, 12, 15, 3, 8, 10, 13, 14, 7, 2, 19, 16, 18, 20, 17
635
2.82
11
92
467
29.05
126.749
5
0%
40%
2, 4, 7, 6, 8, 10, 5, 1, 3, 15, 11, 17, 14, 13, 19, 16, 18, 9, 20, 12
487
2.76
13
83
471
29.1
127.686
6
0%
40%
3, 4, 2, 1, 7, 5, 10, 12, 9, 14, 13, 6, 8, 16, 18, 11, 19, 15, 20, 17
152
2.91
14
53
348
23
129.373
7
0%
40%
1, 7, 5, 8, 6, 11, 2, 4, 12, 10, 3, 16, 18, 9, 14, 20, 13, 15, 17, 19
990
2.78
14
65
522
31.65
126.936
8
0%
40%
3, 5, 6, 7, 8, 9, 1, 2, 10, 4, 16, 18, 15, 12, 11, 13, 19, 17, 20, 14
943
2.77
12
84
564
33.75
126.326
9
0%
40%
4, 5, 6, 2, 10, 11, 13, 14, 16, 7, 12, 1, 19, 20, 3, 9, 8, 17, 15, 18
747
2.74
10
105
641
37.75
127.248
10
0%
40%
4, 6, 5, 2, 10, 9, 8, 11, 12, 3, 1, 17, 7, 14, 19, 20, 16, 13, 15, 18
867
2.73
14
75
523
31.85
127.295
1
20%
0%
1, 3, 5, 6, 7, 2, 9, 12, 13, 4, 8, 10, 17, 18, 20, 11, 19, 14, 15, 16
253
3.06
9
66
426
26.85
98.092
2
20%
0%
1, 2, 3, 6, 7, 4, 12, 5, 10, 15, 8, 9, 11, 14, 13, 20, 19, 16, 17, 18
252
3.01
12
46
414
26.25
95.843
3
20%
0%
1, 3, 4, 5, 6, 7, 10, 11, 13, 16, 12, 17, 14, 2, 20, 9, 18, 8, 19, 15
236
2.91
9
96
463
28.7
98.623
4
20%
0%
1, 3, 4, 6, 9, 5, 2, 12, 13, 14, 10, 7, 16, 17, 15, 8, 11, 20, 19, 18
499
3.04
10
67
352
23.3
100.499
5
20%
0%
1, 2, 3, 6, 7, 11, 12, 13, 14, 5, 4, 15, 8, 16, 9, 10, 19, 18, 17, 20
335
3.01
11
59
389
25
94.545
6
20%
0%
1, 2, 3, 4, 5, 6, 10, 11, 7, 9, 17, 8, 19, 12, 13, 18, 14, 15, 16, 20
260
3.02
10
61
454
28.4
96.796
7
20%
0%
2, 3, 4, 5, 6, 8, 13, 14, 7, 16, 1, 19, 20, 10, 11, 17, 9, 12, 18, 15
328
2.88
9
89
596
35.5
95.998
8
20%
0%
1, 2, 4, 6, 3, 8, 12, 13, 15, 16, 5, 7, 18, 10, 14, 9, 20, 11, 17, 19
284
3.06
9
66
425
26.95
96.686
9
20%
0%
1, 2, 3, 4, 5, 7, 9, 10, 6, 11, 15, 14, 8, 17, 18, 19, 20, 16, 12, 13
161
3.22
7
68
258
18.45
100.374
10
20%
0%
1, 2, 3, 4, 5, 6, 11, 13, 14, 10, 9, 8, 15, 7, 19, 12, 20, 18, 17, 16
302
3.07
10
62
345
22.95
96.436
1
20%
20%
1, 2, 3, 4, 5, 6, 7, 10, 11, 12, 13, 9, 8, 17, 18, 19, 20, 14, 15, 16
971
3.44
5
49
205
15.8
121.873
2
20%
20%
1, 2, 4, 6, 7, 8, 3, 10, 11, 5, 13, 14, 15, 9, 12, 18, 19, 20, 16, 17
973
3.43
6
39
206
15.85
128.108
3
20%
20%
1, 2, 4, 6, 7, 8, 10, 11, 12, 3, 14, 5, 9, 16, 18, 19, 15, 13, 17, 20
758
3.27
7
56
284
19.75
126.014
4
20%
20%
1, 2, 3, 4, 5, 6, 7, 8, 10, 11, 12, 13, 14, 9, 16, 15, 18, 19, 17, 20
925
3.66
4
24
75
9.3
124.748
5
20%
20%
1, 2, 3, 4, 6, 7, 8, 9, 10, 5, 12, 13, 14, 15, 11, 17, 19, 20, 16, 18
943
3.57
4
39
126
11.85
122.811
6
20%
20%
1, 2, 3, 4, 5, 6, 8, 9, 10, 7, 12, 13, 14, 15, 11, 17, 18, 19, 20, 16
991
3.63
3
39
85
9.95
127.561
81
7
20%
20%
1, 2, 4, 5, 6, 3, 7, 9, 10, 8, 12, 13, 14, 11, 16, 15, 18, 19, 20, 17
988
3.57
5
30
96
10.45
119.64
8
20%
20%
1, 2, 4, 5, 6, 3, 7, 8, 9, 10, 11, 12, 13, 14, 15, 16, 19, 20, 17, 18
985
3.68
3
30
77
9.5
124.139
9
20%
20%
2, 3, 4, 5, 6, 7, 8, 1, 11, 12, 10, 14, 9, 16, 17, 13, 19, 20, 15, 18
922
3.40
6
48
190
15.05
123.936
10
20%
20%
1, 2, 3, 4, 6, 8, 9, 10, 11, 5, 13, 7, 12, 17, 18, 19, 20, 14, 15, 16
987
3.37
6
49
236
17.5
124.748
1
20%
40%
2, 3, 4, 6, 7, 8, 9, 1, 10, 12, 14, 5, 13, 16, 17, 11, 18, 20, 15, 19
796
3.28
8
48
229
17
150.436
2
20%
40%
1, 2, 3, 4, 5, 7, 9, 10, 12, 13, 14, 6, 11, 8, 15, 19, 20, 16, 17, 18
805
3.34
7
45
247
17.9
139.733
3
20%
40%
1, 2, 3, 4, 5, 7, 8, 6, 10, 11, 12, 13, 14, 9, 16, 15, 18, 19, 20, 17
745
3.62
4
30
93
10.2
138.263
4
20%
40%
1, 2, 3, 4, 5, 6, 7, 8, 10, 11, 13, 12, 9, 14, 15, 17, 16, 20, 18, 19
479
3.41
8
29
125
11.8
133.498
5
20%
40%
1, 2, 3, 6, 7, 8, 9, 10, 4, 5, 13, 14, 11, 16, 15, 12, 19, 20, 18, 17
707
3.39
7
38
207
15.9
142.951
6
20%
40%
1, 2, 4, 7, 3, 8, 6, 11, 14, 5, 10, 9, 12, 15, 18, 13, 20, 16, 17, 19
694
3.09
11
48
326
21.85
142.029
7
20%
40%
1, 2, 3, 5, 6, 8, 9, 10, 11, 12, 13, 14, 4, 7, 15, 18, 19, 20, 17, 16
780
3.41
5
55
190
15.2
142.295
8
20%
40%
1, 3, 4, 5, 6, 7, 2, 9, 8, 10, 12, 13, 15, 11, 17, 14, 19, 16, 20, 18
299
3.37
8
33
174
14.25
139.623
9
20%
40%
1, 2, 3, 4, 5, 8, 9, 6, 10, 7, 13, 14, 15, 11, 17, 12, 20, 18, 16, 19
361
3.29
8
47
218
16.6
138.077
10
20%
40%
1, 2, 3, 4, 6, 7, 5, 9, 10, 11, 8, 13, 15, 14, 16, 12, 18, 19, 20, 17
962
3.47
7
30
106
10.85
141.139
1
40%
0%
2, 3, 4, 5, 6, 9, 10, 7, 12, 1, 14, 11, 13, 8, 15, 18, 19, 16, 20, 17
148
3.16
9
61
251
18.25
105.561
2
40%
0%
1, 2, 4, 6, 8, 11, 3, 5, 9, 14, 7, 10, 16, 15, 18, 19, 12, 13, 17, 20
160
3.11
10
53
342
22.8
105.295
3
40%
0%
1, 2, 4, 5, 6, 8, 11, 3, 9, 10, 7, 14, 16, 12, 13, 17, 20, 15, 18, 19
57
3.10
11
48
290
20.2
111.608
4
40%
0%
1, 2, 4, 5, 6, 7, 12, 3, 14, 15, 16, 17, 9, 8, 20, 19, 10, 18, 11, 13
168
3.03
8
82
440
27.55
108.858
5
40%
0%
1, 2, 5, 6, 7, 3, 11, 15, 4, 10, 9, 12, 8, 19, 13, 14, 17, 18, 20, 16
164
2.90
12
64
490
30.05
101.186
6
40%
0%
1, 2, 3, 6, 5, 4, 9, 10, 7, 13, 15, 14, 8, 19, 12, 20, 11, 18, 16, 17
88
2.95
11
72
381
24.75
108.655
7
40%
0%
2, 4, 5, 3, 7, 8, 9, 1, 6, 13, 16, 15, 10, 14, 11, 17, 19, 20, 18, 12
104
2.88
12
77
375
24.3
104.561
8
40%
0%
1, 2, 3, 4, 5, 6, 7, 9, 11, 15, 10, 8, 12, 14, 18, 13, 16, 19, 20, 17
179
3.24
9
43
260
18.55
108.577
9
40%
0%
1, 2, 4, 5, 9, 10, 3, 6, 12, 7, 11, 14, 8, 13, 16, 15, 20, 19, 17, 18
204
3.08
12
40
316
21.5
111.749
10
40%
0%
2, 4, 6, 8, 9, 11, 3, 5, 13, 1, 10, 16, 7, 17, 14, 19, 20, 15, 12, 18
128
3.01
10
68
419
26.65
117.154
1
40%
20%
1, 2, 4, 5, 6, 3, 7, 8, 9, 11, 12, 13, 10, 15, 16, 18, 14, 20, 19, 17
569
3.53
5
37
121
11.7
135.123
2
40%
20%
1, 2, 3, 4, 6, 7, 5, 8, 9, 12, 13, 14, 10, 11, 16, 17, 15, 20, 18, 19
923
3.52
6
27
121
11.6
141.686
3
40%
20%
1, 2, 3, 4, 5, 6, 7, 8, 9, 10, 11, 12, 13, 14, 15, 16, 19, 20, 17, 18
716
3.74
2
30
60
8.55
129.342
4
40%
20%
1, 2, 3, 5, 6, 7, 8, 9, 11, 13, 14, 10, 4, 12, 17, 18, 19, 15, 16, 20
913
3.36
6
56
196
15.35
145.716
5
40%
20%
1, 2, 3, 4, 5, 7, 8, 6, 10, 9, 11, 13, 14, 15, 16, 12, 18, 19, 20, 17
483
3.57
5
30
91
10.1
131.217
6
40%
20%
1, 2, 4, 5, 6, 3, 7, 8, 11, 10, 9, 13, 14, 15, 12, 18, 20, 16, 19, 17
955
3.37
7
46
166
13.95
133.78
7
40%
20%
1, 2, 4, 5, 6, 3, 7, 8, 9, 10, 11, 15, 14, 13, 12, 16, 19, 20, 17, 18
912
3.45
7
30
138
12.55
129.92
8
40%
20%
1, 2, 3, 5, 6, 7, 8, 11, 12, 14, 4, 16, 17, 18, 9, 10, 20, 13, 19, 15
928
3.30
6
59
302
20.65
138.514
82
9
40%
20%
1, 2, 3, 4, 5, 7, 8, 9, 10, 11, 6, 13, 14, 15, 12, 16, 18, 19, 20, 17
939
3.60
4
34
90
10.05
130.467
10
40%
20%
1, 2, 4, 3, 6, 7, 8, 11, 12, 5, 10, 14, 15, 13, 9, 17, 19, 20, 16, 18
953
3.37
7
43
189
15
133.701
1
40%
40%
1, 2, 4, 5, 3, 7, 9, 10, 6, 11, 13, 14, 8, 16, 12, 15, 17, 20, 19, 18
487
3.33
9
31
184
14.75
146.217
2
40%
40%
2, 5, 6, 7, 8, 9, 4, 13, 14, 1, 3, 16, 15, 18, 19, 20, 10, 11, 12, 17
213
3.11
8
67
426
26.85
137.67
3
40%
40%
1, 2, 3, 5, 4, 7, 8, 6, 10, 9, 12, 14, 15, 11, 13, 18, 19, 16, 17, 20
195
3.38
8
33
169
14.1
145.123
4
40%
40%
1, 2, 4, 6, 7, 8, 9, 10, 11, 3, 5, 13, 16, 17, 14, 12, 19, 20, 15, 18
622
3.38
6
48
230
17.05
142.123
5
40%
40%
1, 2, 3, 4, 5, 7, 8, 9, 10, 11, 12, 6, 14, 16, 18, 19, 17, 13, 15, 20
1000
3.36
6
56
198
15.45
139.514
6
40%
40%
3, 4, 5, 6, 7, 1, 2, 9, 10, 11, 12, 13, 8, 16, 18, 14, 15, 20, 17, 19
217
3.34
8
36
227
16.9
135.077
7
40%
40%
1, 2, 4, 5, 6, 8, 11, 12, 3, 14, 13, 7, 10, 17, 9, 19, 15, 18, 16, 20
932
3.17
9
52
320
21.7
132.217
8
40%
40%
1, 2, 3, 4, 6, 7, 5, 10, 11, 12, 13, 15, 8, 9, 14, 18, 19, 20, 16, 17
436
3.43
6
40
194
15.25
144.639
9
40%
40%
1, 2, 3, 4, 6, 5, 7, 8, 10, 11, 13, 14, 15, 9, 12, 16, 19, 20, 17, 18
741
3.49
6
33
137
12.55
146.311
10
40%
40%
1, 2, 4, 7, 5, 8, 9, 12, 13, 3, 6, 11, 10, 17, 14, 19, 20, 15, 18, 16
325
3.15
9
56
334
22.25
148.451
1
60%
0%
1, 2, 4, 5, 3, 7, 8, 9, 11, 12, 15, 14, 6, 18, 19, 10, 20, 17, 13, 16
167
3.19
8
63
286
19.85
126.53
2
60%
0%
1, 2, 3, 4, 5, 6, 7, 9, 11, 12, 15, 16, 8, 14, 18, 13, 10, 17, 19, 20
128
3.29
7
58
223
16.7
133.232
3
60%
0%
1, 2, 3, 4, 5, 7, 8, 9, 6, 12, 13, 10, 15, 14, 11, 16, 20, 19, 18, 17
139
3.32
8
45
176
14.35
115.092
4
60%
0%
1, 2, 3, 6, 7, 8, 5, 12, 14, 17, 4, 19, 16, 10, 9, 15, 11, 13, 18, 20
138
2.86
10
84
597
35.4
131.467
5
60%
0%
1, 2, 5, 6, 3, 4, 8, 9, 11, 12, 7, 10, 14, 13, 18, 19, 17, 16, 15, 20
129
3.12
10
60
250
18.2
136.888
6
60%
0%
1, 2, 3, 6, 8, 9, 10, 4, 5, 14, 7, 15, 11, 12, 13, 16, 17, 19, 20, 18
112
3.09
12
37
328
22.1
121.311
7
60%
0%
1, 2, 4, 5, 9, 10, 7, 8, 13, 14, 15, 3, 6, 17, 18, 11, 20, 12, 16, 19
90
3.15
8
66
345
22.95
135.076
8
60%
0%
2, 3, 4, 7, 5, 8, 10, 1, 9, 6, 12, 16, 17, 20, 14, 13, 11, 19, 15, 18
119
2.94
11
71
430
27.05
142.999
9
60%
0%
1, 2, 3, 4, 7, 9, 11, 13, 14, 15, 5, 6, 19, 8, 10, 16, 12, 20, 18, 17
115
3.00
9
73
494
30.25
130.592
10
60%
0%
2, 3, 4, 5, 6, 7, 1, 11, 9, 14, 10, 12, 8, 13, 15, 18, 20, 16, 17, 19
83
3.21
10
39
260
18.55
123.201
1
60%
20%
1, 2, 4, 3, 6, 7, 8, 9, 11, 5, 13, 14, 15, 17, 18, 10, 12, 20, 16, 19
971
3.36
6
54
208
15.95
141.701
2
60%
20%
2, 3, 4, 5, 6, 1, 8, 9, 11, 12, 13, 14, 10, 7, 16, 18, 19, 20, 15, 17
738
3.45
5
48
170
14.2
137.811
3
60%
20%
1, 2, 4, 6, 7, 8, 3, 5, 10, 11, 12, 14, 16, 17, 9, 19, 20, 13, 15, 18
1000
3.35
6
53
249
18
145.28
4
60%
20%
1, 2, 3, 4, 5, 9, 10, 6, 7, 13, 14, 15, 16, 17, 18, 8, 20, 11, 12, 19
985
3.28
6
66
275
19.45
148.952
5
60%
20%
1, 2, 4, 5, 7, 8, 11, 3, 13, 6, 16, 17, 9, 10, 14, 12, 20, 15, 19, 18
493
3.15
9
51
378
24.45
135.837
6
60%
20%
1, 4, 5, 6, 3, 7, 8, 9, 10, 2, 12, 13, 15, 14, 11, 18, 19, 20, 16, 17
1000
3.42
6
44
177
14.5
138.082
7
60%
20%
1, 2, 3, 4, 6, 5, 7, 8, 9, 10, 11, 13, 14, 15, 16, 12, 18, 19, 20, 17
341
3.68
3
30
67
9.05
130.9
8
60%
20%
1, 2, 3, 4, 5, 6, 8, 9, 10, 11, 7, 13, 15, 18, 14, 12, 20, 16, 19, 17
948
3.39
6
47
216
16.5
147.855
9
60%
20%
1, 2, 4, 6, 3, 7, 8, 11, 12, 13, 14, 5, 10, 9, 15, 17, 18, 19, 20, 16
877
3.41
6
48
163
13.8
143.06
10
60%
20%
1, 2, 4, 5, 6, 7, 11, 3, 10, 14, 9, 13, 8, 17, 18, 12, 20, 15, 16, 19
847
3.20
9
48
303
20.7
136.907
83
1
60%
40%
1, 2, 3, 4, 7, 5, 8, 6, 10, 12, 13, 14, 9, 11, 17, 15, 16, 18, 20, 19
797
3.34
9
27
189
15
140.101
2
60%
40%
1, 3, 4, 6, 7, 2, 5, 9, 10, 11, 8, 15, 16, 14, 12, 13, 19, 17, 18, 20
229
3.32
9
30
211
16.1
143.054
3
60%
40%
1, 2, 3, 4, 5, 7, 8, 9, 11, 15, 13, 6, 10, 12, 18, 20, 14, 19, 16, 17
545
3.21
8
58
296
20.35
141.263
4
60%
40%
1, 2, 3, 6, 7, 8, 5, 4, 12, 13, 14, 10, 9, 11, 17, 18, 19, 20, 15, 16
138
3.33
7
48
222
16.65
141.767
5
60%
40%
1, 2, 3, 5, 6, 8, 11, 13, 15, 16, 4, 7, 19, 20, 10, 9, 18, 12, 17, 14
179
3.02
8
78
503
30.85
156.645
6
60%
40%
1, 2, 5, 6, 7, 9, 11, 12, 13, 14, 3, 10, 4, 8, 19, 20, 15, 16, 17, 18
96
3.17
8
58
369
24
149.931
7
60%
40%
2, 4, 5, 6, 7, 3, 1, 9, 12, 15, 16, 8, 13, 14, 10, 11, 17, 19, 20, 18
106
3.08
11
49
341
22.6
133.64
8
60%
40%
1, 2, 3, 5, 7, 8, 10, 4, 12, 13, 14, 6, 9, 11, 17, 18, 15, 16, 20, 19
990
3.29
8
45
244
17.75
163.758
9
60%
40%
1, 4, 5, 6, 8, 9, 10, 2, 7, 14, 15, 3, 17, 18, 19, 12, 13, 11, 20, 16
871
3.11
8
70
383
24.85
145.324
10
60%
40%
1, 2, 3, 4, 5, 7, 6, 9, 10, 11, 12, 13, 14, 8, 16, 15, 18, 17, 19, 20
175
3.52
6
31
95
10.3
145.888
1
80%
0%
1, 2, 4, 5, 3, 6, 7, 8, 10, 11, 13, 12, 14, 16, 9, 18, 17, 15, 20, 19
90
3.27
9
44
168
14.05
130.184
2
80%
0%
1, 2, 3, 6, 5, 7, 8, 9, 11, 15, 4, 17, 12, 14, 19, 10, 20, 18, 13, 16
123
3.11
9
64
342
22.8
133.946
3
80%
0%
1, 2, 3, 6, 8, 12, 13, 14, 7, 10, 15, 5, 4, 9, 19, 20, 16, 11, 17, 18
81
2.96
10
75
463
28.85
148.825
4
80%
0%
2, 3, 4, 5, 6, 7, 11, 1, 13, 16, 15, 8, 10, 9, 14, 20, 12, 18, 19, 17
101
3.04
10
59
448
27.95
120.771
5
80%
0%
1, 2, 4, 6, 9, 11, 3, 10, 5, 13, 15, 7, 8, 18, 19, 12, 16, 14, 20, 17
155
3.06
10
58
400
25.7
140.552
6
80%
0%
1, 2, 3, 5, 6, 4, 8, 9, 12, 15, 7, 18, 10, 20, 11, 16, 13, 14, 17, 19
90
3.04
9
69
459
28.65
125.237
7
80%
0%
1, 2, 4, 8, 3, 5, 10, 7, 12, 14, 6, 15, 9, 11, 17, 13, 19, 16, 20, 18
123
3.00
13
45
339
22.65
127.968
8
80%
0%
1, 2, 4, 5, 6, 3, 7, 8, 9, 11, 10, 13, 15, 16, 17, 12, 14, 19, 20, 18
89
3.52
5
38
118
11.55
133.48
9
80%
0%
1, 2, 3, 4, 6, 11, 13, 10, 15, 5, 7, 8, 9, 16, 20, 19, 18, 12, 14, 17
167
2.90
11
74
480
29.7
118.742
10
80%
0%
1, 2, 3, 4, 7, 8, 11, 12, 14, 9, 10, 6, 5, 15, 16, 13, 20, 19, 18, 17
73
3.10
10
59
309
21
154.367
1
80%
20%
1, 2, 4, 5, 6, 7, 8, 3, 10, 11, 12, 13, 15, 9, 14, 18, 19, 20, 16, 17
603
3.50
5
39
159
13.5
145.703
2
80%
20%
1, 3, 4, 6, 5, 7, 8, 2, 10, 11, 12, 13, 14, 15, 9, 17, 18, 20, 16, 19
846
3.51
5
39
140
12.7
139.005
3
80%
20%
1, 3, 4, 6, 2, 8, 10, 5, 12, 13, 7, 16, 9, 14, 11, 19, 20, 15, 18, 17
1000
3.19
9
48
321
21.75
161.362
4
80%
20%
1, 4, 6, 7, 8, 2, 10, 3, 5, 12, 13, 15, 14, 9, 11, 18, 19, 20, 16, 17
688
3.31
8
39
264
18.75
136.211
5
80%
20%
1, 2, 4, 5, 6, 8, 9, 10, 3, 12, 13, 15, 7, 11, 18, 16, 14, 20, 19, 17
929
3.28
8
46
248
18.1
150.855
6
80%
20%
1, 2, 3, 4, 6, 7, 5, 10, 12, 13, 14, 9, 8, 11, 16, 15, 20, 18, 17, 19
845
3.28
9
38
231
17.1
141.8
7
80%
20%
1, 2, 3, 4, 5, 6, 7, 9, 11, 10, 14, 15, 17, 18, 19, 20, 8, 16, 13, 12
979
3.26
5
79
281
19.6
154.133
8
80%
20%
1, 3, 4, 5, 6, 2, 8, 9, 11, 7, 15, 14, 12, 10, 16, 13, 18, 20, 17, 19
987
3.25
10
35
208
16.1
135.899 140.661
9
80%
20%
1, 2, 4, 5, 6, 7, 8, 10, 11, 3, 13, 14, 15, 17, 18, 9, 20, 12, 19, 16
377
3.38
5
59
235
17.3
10
80%
20%
1, 2, 3, 4, 6, 7, 8, 9, 11, 16, 17, 5, 10, 13, 19, 20, 14, 18, 12, 15
673
3.15
7
75
362
23.65
140.13
1
80%
40%
1, 2, 6, 4, 3, 8, 11, 5, 10, 7, 14, 15, 13, 9, 17, 12, 16, 19, 18, 20
998
3.11
12
38
274
19.4
141.675
2
80%
40%
1, 2, 3, 4, 6, 7, 8, 10, 5, 12, 13, 9, 11, 16, 14, 18, 15, 17, 20, 19
313
3.31
9
35
194
15.25
150.808
84
3
80%
40%
1, 2, 4, 8, 9, 11, 12, 15, 14, 6, 13, 3, 5, 7, 19, 20, 16, 10, 18, 17
135
2.94
10
76
485
29.95
161.377
4
80%
40%
2, 4, 6, 7, 8, 10, 1, 5, 3, 13, 14, 11, 16, 9, 19, 12, 18, 15, 20, 17
112
3.07
10
56
394
25.25
128.297
5
80%
40%
2, 3, 4, 5, 6, 7, 1, 9, 11, 13, 14, 8, 10, 16, 17, 15, 19, 18, 20, 12
378
3.20
8
68
210
16.05
160.534
6
80%
40%
1, 2, 5, 7, 3, 4, 6, 8, 13, 14, 15, 9, 10, 11, 12, 16, 17, 18, 20, 19
165
3.07
13
33
303
20.7
128.624
7
80%
40%
2, 4, 7, 8, 9, 11, 12, 1, 14, 5, 3, 13, 6, 17, 18, 19, 10, 16, 15, 20
221
3.10
9
61
399
25.5
143.128
8
80%
40%
1, 2, 4, 3, 7, 8, 11, 14, 5, 6, 10, 16, 13, 9, 17, 12, 20, 15, 19, 18
407
3.07
11
48
364
23.75
137.788
9
80%
40%
3, 4, 6, 7, 8, 1, 11, 2, 14, 5, 12, 13, 9, 17, 10, 19, 20, 15, 16, 18
129
3.10
10
51
387
24.9
144.891
10
80%
40%
1, 2, 3, 6, 5, 4, 9, 10, 7, 13, 14, 11, 8, 12, 15, 19, 20, 16, 17, 18
207
3.21
10
39
263
18.85
145.375
85
8.3 Block Crossover Results
Data Set 3
Data Set 2
Data Set 1
8.3.1
Without Block Crossover
Replication Number
P(BlockCr)
Generation Found
1
0
1057
1, 2, 5, 6, 7, 3, 4, 9, 11, 12, 10, 8, 14, 15, 16, 13, 18, 19, 20, 17
3.51
6
1256
256
112.20
2
0
869
1, 2, 3, 4, 5, 6, 7, 8, 9, 10, 11, 12, 13, 14, 15, 16, 17, 18, 19, 20
4.00
0
0
0
49.40
501.46
3
0
1942
1, 2, 3, 4, 5, 6, 9, 10, 11, 12, 13, 14, 7, 8, 16, 15, 18, 19, 20, 17
3.58
4
1050
329
101.90
525.74
4
0
1891
1, 2, 3, 5, 6, 7, 8, 4, 10, 11, 12, 13, 14, 9, 16, 15, 18, 20, 17, 19
3.56
5
1146
263
106.70
542.80
5
0
1645
1, 5, 6, 7, 8, 3, 2, 4, 11, 12, 13, 14, 15, 10, 9, 18, 19, 20, 16, 17
3.37
7
2154
346
157.10
630.85
6
0
1453
1, 2, 3, 4, 5, 6, 7, 8, 9, 10, 11, 13, 14, 15, 16, 12, 18, 19, 20, 17
3.74
2
483
256
73.55
540.60
7
0
1216
1, 2, 3, 5, 6, 7, 8, 4, 10, 11, 12, 13, 14, 15, 9, 16, 18, 19, 20, 17
3.58
4
936
339
96.20
550.94
8
0
1962
1, 2, 3, 4, 5, 6, 7, 8, 9, 10, 13, 14, 12, 11, 16, 15, 18, 19, 17, 20
3.61
5
704
212
84.60
485.50
9
0
1954
1, 2, 4, 5, 6, 7, 3, 9, 10, 12, 13, 14, 15, 8, 11, 18, 19, 20, 16, 17
3.48
5
1527
380
125.75
497.56
10
0
1979
1, 2, 5, 6, 7, 3, 4, 9, 11, 12, 13, 14, 10, 8, 15, 17, 18, 20, 16, 19
3.42
7
1502
307
124.50
537.31
1
0
1475
1, 2, 3, 4, 5, 6, 7, 8, 9, 10, 11, 15, 16, 17, 18, 19, 20, 12, 13, 14
3.52
3
1014
338
100.80
271.79
2
0
1962
1, 2, 3, 4, 5, 7, 9, 6, 8, 11, 13, 14, 12, 10, 17, 18, 19, 20, 15, 16
3.35
7
1126
264
106.40
262.42
3
0
1381
1, 2, 3, 4, 5, 6, 7, 8, 9, 10, 11, 12, 13, 14, 15, 16, 17, 18, 20, 19
3.88
1
28
28
51.50
250.50
4
0
1990
1, 3, 4, 2, 6, 7, 8, 9, 10, 5, 13, 15, 16, 17, 18, 19, 20, 11, 12, 14
3.31
5
1744
403
137.30
261.19
5
0
1897
1, 2, 3, 4, 5, 6, 7, 8, 9, 10, 11, 12, 13, 14, 15, 16, 17, 18, 19, 20
4.00
0
0
0
50.10
263.04
6
0
1954
1, 2, 4, 5, 6, 7, 8, 3, 11, 13, 14, 15, 16, 17, 12, 9, 19, 20, 10, 18
3.27
5
1727
483
136.45
260.60
7
0
1024
1, 3, 4, 5, 6, 2, 8, 10, 11, 12, 13, 9, 7, 16, 17, 18, 19, 20, 14, 15
3.36
5
1476
358
123.90
270.66
8
0
1935
1, 2, 3, 4, 5, 7, 8, 9, 10, 11, 12, 6, 14, 15, 16, 18, 20, 17, 13, 19
3.49
4
832
339
91.70
294.95
9
0
1185
1, 2, 3, 4, 5, 6, 7, 8, 9, 10, 11, 12, 13, 14, 15, 16, 17, 18, 19, 20
4.00
0
0
0
50.10
261.15
10
0
1922
1, 3, 4, 2, 6, 7, 5, 9, 10, 11, 12, 13, 8, 15, 16, 17, 18, 19, 14, 20
3.44
5
1033
295
101.75
310.82
1
0
1051
1, 2, 3, 4, 5, 6, 7, 8, 9, 10, 11, 12, 13, 14, 15, 16, 17, 18, 19, 20
4.00
0
0
0
58.05
276.88
2
0
1578
1, 3, 4, 5, 6, 7, 2, 9, 10, 11, 12, 13, 14, 8, 16, 17, 18, 19, 20, 15
3.52
3
1079
404
112.00
280.32
Chromosome
Fitness
NT
TT
Tmax
Favg
Computation Time 536.47
Data Set 5
Data Set 4
86
3
0
1190
1, 2, 3, 4, 5, 6, 7, 8, 9, 10, 12, 13, 14, 11, 16, 17, 18, 19, 15, 20
3.60
3
613
314
88.70
4
0
832
1, 2, 3, 4, 6, 7, 9, 10, 11, 12, 13, 5, 8, 15, 17, 18, 19, 20, 14, 16
3.39
4
1552
482
135.65
573.69 251.33
5
0
1193
1, 3, 4, 5, 2, 7, 8, 10, 11, 6, 14, 15, 16, 17, 9, 12, 13, 18, 20, 19
3.21
7
1901
479
153.10
250.94
6
0
1707
1, 2, 3, 5, 6, 7, 8, 10, 11, 13, 9, 4, 16, 17, 18, 19, 20, 12, 14, 15
3.24
5
2318
539
173.95
255.34
7
0
1534
1, 2, 3, 4, 6, 7, 8, 9, 10, 11, 5, 13, 14, 15, 12, 17, 18, 19, 16, 20
3.51
4
870
356
101.55
240.71
8
0
1783
1, 2, 3, 4, 6, 7, 11, 12, 13, 9, 5, 10, 8, 16, 17, 18, 19, 20, 14, 15
3.23
6
2172
482
166.65
272.83 291.20
9
0
1743
1, 2, 3, 4, 5, 6, 7, 8, 9, 10, 12, 11, 15, 17, 18, 13, 14, 16, 19, 20
3.39
6
1290
324
122.55
10
0
954
1, 2, 3, 4, 5, 6, 7, 8, 9, 10, 11, 12, 13, 14, 15, 16, 17, 18, 19, 20
4.00
0
0
0
58.05
253.62
1
0
1985
1, 2, 3, 4, 5, 6, 8, 9, 10, 11, 12, 13, 14, 7, 16, 17, 15, 19, 18, 20
3.50
4
766
319
87.40
242.54
2
0
1698
1, 2, 3, 4, 5, 6, 8, 9, 10, 12, 13, 7, 11, 15, 16, 17, 14, 19, 20, 18
3.52
4
844
262
91.30
253.46
3
0
1342
1, 2, 3, 4, 6, 9, 10, 11, 7, 5, 14, 15, 8, 17, 13, 12, 19, 20, 16, 18
3.19
7
2131
369
155.65
243.79
4
0
1930
1, 2, 3, 5, 6, 8, 10, 11, 4, 13, 7, 12, 15, 9, 14, 17, 18, 19, 16, 20
3.30
7
1433
296
120.75
243.75
5
0
1770
1, 2, 3, 4, 5, 6, 7, 8, 9, 10, 13, 14, 15, 12, 11, 17, 16, 19, 20, 18
3.53
4
804
256
89.30
245.37
6
0
1994
1, 2, 3, 5, 6, 7, 8, 4, 10, 11, 12, 13, 14, 9, 16, 17, 15, 19, 20, 18
3.54
4
834
237
90.80
239.81
7
0
1000
1, 2, 3, 4, 5, 6, 7, 8, 9, 10, 13, 14, 15, 11, 12, 17, 16, 19, 20, 18
3.54
4
788
237
88.50
236.36
8
0
1807
1, 2, 3, 4, 5, 6, 7, 8, 9, 11, 12, 13, 10, 15, 16, 14, 19, 20, 17, 18
3.51
4
892
273
93.70
247.73
9
0
1843
1, 2, 3, 4, 5, 7, 8, 9, 10, 11, 12, 13, 6, 15, 16, 17, 14, 19, 20, 18
3.57
3
764
288
87.30
264.96
10
0
1546
1, 2, 3, 5, 8, 9, 10, 11, 4, 6, 13, 7, 12, 15, 16, 17, 14, 19, 20, 18
3.36
6
1336
286
115.90
261.12
1
0
1750
1, 2, 3, 4, 5, 7, 8, 9, 10, 6, 12, 13, 11, 15, 16, 17, 18, 19, 20, 14
3.55
3
927
387
107.90
249.04
2
0
2000
1, 2, 3, 4, 5, 6, 7, 8, 9, 12, 13, 11, 10, 16, 17, 18, 19, 14, 20, 15
3.42
5
1371
387
130.10
241.37
3
0
1376
1, 2, 3, 4, 5, 6, 7, 8, 9, 10, 11, 12, 13, 14, 15, 16, 17, 19, 18, 20
3.83
2
67
42
64.90
225.38
4
0
1627
1, 3, 4, 5, 6, 8, 9, 10, 2, 7, 13, 14, 15, 16, 17, 18, 19, 11, 12, 20
3.29
5
2037
553
163.40
253.15
5
0
1655
1, 2, 3, 4, 5, 6, 7, 8, 9, 10, 11, 12, 13, 16, 17, 18, 19, 20, 14, 15
3.62
2
774
387
100.25
230.22
6
0
1219
1, 2, 3, 4, 5, 6, 7, 9, 10, 11, 12, 8, 14, 13, 16, 17, 18, 19, 15, 20
3.54
4
777
337
100.40
249.90
7
0
1578
1, 4, 5, 6, 7, 8, 9, 2, 3, 10, 12, 13, 14, 15, 11, 18, 19, 20, 17, 16
3.28
6
1904
486
156.75
249.70
8
0
1983
1, 2, 3, 4, 5, 6, 7, 8, 9, 10, 11, 12, 14, 15, 13, 16, 18, 19, 20, 17
3.67
3
455
217
84.30
245.08
9
0
980
1, 2, 3, 4, 5, 6, 7, 8, 9, 10, 11, 12, 13, 14, 15, 16, 17, 18, 19, 20
4.00
0
0
0
61.55
244.84
10
0
1989
1, 2, 3, 5, 6, 7, 8, 4, 10, 11, 12, 13, 9, 16, 17, 19, 20, 18, 14, 15
3.38
5
1648
412
143.95
254.29
87
Data Set 3
Data Set 2
Data Set 1
8.3.2
Block Crossover Waiting Time Heuristic
Replication Number
P(BlockCr)
1
0.2
1, 2, 3, 4, 5, 6, 7, 8, 9, 10, 11, 12, 13, 14, 15, 16, 17, 18, 19, 20
331
4.0
0
0
0
49.4
607.2
2
0.2
1, 2, 3, 4, 5, 6, 9, 11, 12, 7, 8, 15, 16, 10, 18, 14, 13, 20, 17, 19
1916
3.4
7
375
1943
146.6
581.7
3
0.2
1, 2, 3, 4, 5, 6, 7, 8, 9, 10, 11, 12, 13, 14, 15, 16, 17, 18, 19, 20
253
4.0
0
0
0
49.4
543.2
4
0.2
1, 2, 3, 4, 5, 6, 7, 8, 9, 10, 11, 12, 14, 15, 16, 13, 18, 19, 20, 17
1984
3.7
2
256
482
73.5
606.9
5
0.2
1, 2, 3, 4, 5, 6, 7, 8, 9, 10, 11, 12, 13, 15, 16, 14, 18, 19, 20, 17
1920
3.7
2
256
427
70.8
611.4
6
0.2
1, 2, 3, 4, 5, 6, 7, 8, 9, 10, 11, 12, 13, 14, 15, 16, 17, 18, 19, 20
228
4.0
0
0
0
49.4
556.6
7
0.2
1, 2, 3, 4, 5, 6, 7, 8, 9, 10, 11, 12, 13, 14, 15, 16, 17, 18, 19, 20
391
4.0
0
0
0
49.4
575.4
8
0.2
1, 2, 3, 4, 5, 6, 7, 8, 9, 10, 11, 12, 13, 14, 15, 16, 17, 18, 19, 20
718
4.0
0
0
0
49.4
852.3
9
0.2
1, 2, 5, 6, 7, 8, 9, 10, 3, 4, 12, 13, 14, 15, 16, 11, 18, 19, 20, 17
1046
3.5
4
364
1289
113.9
1075.2
10
0.2
1, 2, 3, 4, 5, 6, 7, 8, 9, 10, 11, 12, 13, 14, 15, 16, 17, 18, 19, 20
1281
4.0
0
0
0
49.4
1118.1
1
0.2
1, 2, 3, 4, 5, 6, 7, 8, 9, 10, 11, 12, 13, 14, 15, 16, 17, 18, 19, 20
410
4.0
0
0
0
50.1
274.5
2
0.2
1, 2, 3, 4, 5, 6, 7, 8, 9, 10, 11, 12, 13, 14, 15, 16, 17, 18, 19, 20
310
4.0
0
0
0
50.1
245.8
3
0.2
1, 2, 3, 4, 5, 6, 7, 8, 9, 10, 11, 14, 12, 13, 17, 18, 19, 20, 15, 16
1960
3.6
4
229
676
83.9
259.3
4
0.2
1, 2, 3, 4, 5, 6, 7, 8, 9, 10, 11, 12, 13, 14, 15, 16, 17, 18, 19, 20
397
4.0
0
0
0
50.1
224.6
5
0.2
1, 2, 3, 4, 5, 6, 7, 8, 10, 11, 12, 13, 14, 9, 16, 17, 18, 19, 20, 15
1932
3.7
2
267
496
74.9
250.9
6
0.2
1, 2, 3, 4, 5, 6, 7, 8, 9, 10, 11, 12, 13, 14, 15, 16, 17, 18, 19, 20
216
4.0
0
0
0
50.1
214.7
7
0.2
1, 2, 3, 4, 5, 6, 7, 8, 9, 10, 11, 12, 13, 14, 15, 16, 17, 18, 19, 20
533
4.0
0
0
0
50.1
223.0
8
0.2
1, 2, 3, 4, 5, 6, 7, 8, 9, 10, 11, 12, 13, 14, 15, 16, 17, 18, 19, 20
494
4.0
0
0
0
50.1
223.3
Chromosome
Generation Found
Fitness
NT
Tmax
TT
Favg
Computation Time
9
0.2
1, 2, 3, 4, 5, 6, 7, 8, 9, 10, 11, 12, 13, 14, 15, 16, 17, 18, 19, 20
306
4.0
0
0
0
50.1
215.7
10
0.2
1, 2, 3, 4, 5, 6, 7, 8, 9, 10, 11, 12, 13, 14, 15, 16, 17, 18, 19, 20
495
4.0
0
0
0
50.1
214.0
1
0.2
1, 2, 3, 4, 5, 6, 7, 8, 9, 10, 11, 12, 13, 14, 15, 16, 17, 18, 19, 20
288
4.0
0
0
0
58.1
209.5
2
0.2
1, 2, 3, 4, 5, 6, 7, 8, 9, 10, 11, 12, 13, 14, 15, 17, 18, 16, 20, 19
1999
3.8
2
165
306
73.4
239.6
3
0.2
1, 2, 3, 4, 5, 6, 7, 8, 9, 10, 11, 12, 13, 14, 15, 16, 17, 18, 19, 20
473
4.0
0
0
0
58.1
211.4
4
0.2
1, 2, 3, 4, 5, 6, 7, 8, 9, 10, 11, 12, 13, 14, 15, 16, 17, 18, 19, 20
471
4.0
0
0
0
58.1
212.2
5
0.2
1, 2, 3, 4, 5, 6, 7, 8, 9, 10, 11, 12, 13, 14, 15, 16, 17, 18, 19, 20
298
4.0
0
0
0
58.1
218.6
Data Set 5
Data Set 4
88
6
0.2
1, 2, 3, 4, 5, 6, 7, 8, 9, 10, 11, 12, 13, 14, 15, 16, 17, 18, 19, 20
258
4.0
0
0
0
58.1
7
0.2
1, 2, 3, 4, 5, 6, 7, 8, 9, 10, 11, 12, 13, 14, 15, 16, 17, 18, 19, 20
324
4.0
0
0
0
58.1
210.3 215.0
8
0.2
1, 2, 3, 4, 5, 6, 7, 8, 9, 10, 11, 12, 13, 14, 15, 16, 17, 18, 19, 20
1002
4.0
0
0
0
58.1
220.1
9
0.2
1, 2, 3, 4, 5, 6, 7, 8, 9, 10, 11, 12, 13, 14, 15, 16, 17, 18, 19, 20
889
4.0
0
0
0
58.1
226.4
10
0.2
1, 2, 3, 4, 5, 6, 7, 8, 9, 10, 11, 12, 13, 14, 15, 16, 17, 18, 19, 20
508
4.0
0
0
0
58.1
216.8
1
0.2
1, 2, 3, 4, 5, 6, 7, 8, 9, 10, 11, 12, 13, 14, 15, 16, 17, 18, 19, 20
243
4.0
0
0
0
49.1
211.5
2
0.2
1, 2, 5, 6, 8, 9, 7, 4, 3, 12, 13, 14, 15, 11, 10, 17, 16, 19, 20, 18
1919
3.4
7
284
1475
122.9
239.9
3
0.2
1, 2, 3, 4, 5, 6, 7, 8, 9, 10, 11, 12, 13, 14, 15, 16, 17, 18, 19, 20
368
4.0
0
0
0
49.1
215.3
4
0.2
1, 2, 3, 4, 5, 6, 7, 8, 9, 10, 11, 12, 13, 14, 15, 16, 17, 18, 19, 20
1276
4.0
0
0
0
49.1
228.7
5
0.2
1, 2, 3, 4, 5, 6, 7, 8, 9, 10, 11, 12, 13, 14, 15, 16, 17, 18, 19, 20
724
4.0
0
0
0
49.1
226.7
6
0.2
1, 2, 3, 4, 5, 6, 8, 11, 12, 13, 10, 7, 15, 9, 14, 17, 18, 19, 20, 16
1968
3.5
5
362
1232
110.7
243.6
7
0.2
1, 2, 3, 4, 5, 6, 7, 8, 9, 10, 11, 12, 13, 14, 15, 16, 17, 18, 19, 20
479
4.0
0
0
0
49.1
217.7
8
0.2
1, 2, 3, 4, 5, 6, 7, 8, 9, 10, 11, 12, 13, 14, 15, 16, 17, 18, 19, 20
514
4.0
0
0
0
49.1
215.5
9
0.2
1, 2, 3, 4, 5, 6, 7, 8, 9, 10, 11, 12, 13, 14, 15, 16, 17, 18, 19, 20
1948
4.0
0
0
0
49.1
242.0
10
0.2
1, 2, 3, 4, 5, 6, 7, 8, 9, 10, 11, 12, 13, 14, 15, 16, 17, 18, 19, 20
453
4.0
0
0
0
49.1
223.5
1
0.2
1, 2, 3, 4, 5, 6, 7, 8, 9, 10, 11, 12, 13, 14, 15, 16, 17, 18, 19, 20
228
4.0
0
0
0
61.6
214.6
2
0.2
1, 2, 3, 4, 5, 6, 7, 8, 9, 10, 11, 12, 13, 14, 15, 16, 17, 18, 19, 20
430
4.0
0
0
0
61.6
216.2
3
0.2
1, 2, 3, 4, 5, 6, 7, 9, 10, 11, 8, 13, 14, 12, 17, 18, 19, 16, 15, 20
1789
3.6
5
257
986
110.9
244.9
4
0.2
1, 2, 3, 4, 5, 6, 7, 8, 9, 10, 11, 12, 13, 14, 15, 16, 17, 18, 19, 20
329
4.0
0
0
0
61.6
210.3
5
0.2
1, 2, 3, 4, 5, 6, 7, 8, 9, 10, 11, 12, 13, 14, 15, 16, 17, 18, 19, 20
1445
4.0
0
0
0
61.6
241.1
6
0.2
1, 2, 3, 4, 5, 6, 7, 8, 9, 10, 11, 12, 13, 14, 15, 16, 17, 18, 19, 20
291
4.0
0
0
0
61.6
207.7
7
0.2
1, 2, 3, 4, 5, 6, 7, 8, 9, 10, 11, 12, 13, 14, 15, 16, 17, 18, 19, 20
504
4.0
0
0
0
61.6
218.5
8
0.2
1, 2, 3, 4, 5, 6, 7, 8, 9, 10, 11, 12, 13, 14, 15, 16, 17, 18, 19, 20
362
4.0
0
0
0
61.6
213.2
9
0.2
1, 2, 3, 4, 5, 6, 7, 8, 9, 10, 11, 12, 13, 14, 15, 16, 17, 18, 19, 20
853
4.0
0
0
0
61.6
231.1
10
0.2
1, 2, 3, 4, 5, 6, 7, 8, 9, 10, 11, 12, 13, 14, 15, 16, 17, 18, 19, 20
564
4.0
0
0
0
61.6
219.4
89
8.3.3
Block Crossover Tardiness Heuristic
Data Set 3
Data Set 2
Data Set 1
Replication Number
P(BlockCr)
Chromosome
Generation Found
Fitness
NT
Tmax
TT
Favg
Computation Time
1
0.2
1, 2, 5, 6, 7, 9, 10, 12, 13, 14, 3, 4, 8, 16, 17, 18, 19, 20, 11, 15
1916
3.34
5
561
2428
170.8
251.9
2
0.2
1, 2, 3, 5, 6, 7, 9, 11, 12, 13, 14, 4, 8, 16, 17, 19, 20, 10, 18, 15
1730
3.36
5
568
1986
148.7
251.3
3
0.2
1, 2, 3, 4, 5, 6, 7, 8, 9, 11, 15, 16, 10, 12, 14, 13, 19, 20, 18, 17
1840
3.47
6
312
1430
120.9
248.8
4
0.2
1, 2, 5, 7, 8, 9, 10, 11, 12, 3, 4, 6, 16, 17, 19, 20, 13, 14, 15, 18
1971
3.25
7
482
3026
200.7
267.1
5
0.2
1, 2, 5, 6, 7, 9, 10, 11, 12, 13, 3, 4, 8, 16, 17, 19, 20, 18, 14, 15
1944
3.33
6
498
2345
166.7
243.6
6
0.2
1, 2, 5, 6, 7, 9, 10, 3, 4, 12, 13, 14, 15, 8, 11, 18, 19, 20, 16, 17
854
3.40
6
380
2017
150.3
252.6
7
0.2
1, 2, 3, 5, 6, 7, 9, 11, 12, 4, 8, 15, 16, 17, 18, 19, 20, 10, 14, 13
1274
3.35
5
568
2178
158.3
246.7
8
0.2
1, 2, 3, 5, 6, 7, 8, 9, 10, 11, 4, 15, 16, 17, 18, 19, 20, 12, 13, 14
1309
3.46
4
483
1875
143.2
247.5
9
0.2
1, 2, 5, 6, 7, 3, 4, 9, 10, 11, 14, 8, 17, 18, 12, 13, 20, 15, 16, 19
1914
3.27
8
392
2515
175.2
244.2
10
0.2
1, 3, 4, 5, 6, 7, 8, 9, 11, 13, 14, 2, 16, 17, 18, 19, 20, 12, 10, 15
1970
3.40
4
573
2025
150.7
245.5
1
0.2
1, 2, 3, 4, 5, 6, 7, 8, 9, 10, 11, 12, 14, 15, 13, 17, 18, 19, 20, 16
1997
3.80
2
167
328
66.5
257.6
2
0.2
1, 2, 3, 4, 5, 6, 7, 8, 9, 10, 11, 16, 17, 18, 19, 20, 12, 13, 14, 15
1601
3.55
4
338
1352
117.7
248.3
3
0.2
1, 3, 4, 5, 7, 8, 9, 2, 6, 11, 13, 15, 16, 18, 19, 20, 17, 10, 12, 14
1850
3.33
6
486
2121
156.2
254.9
4
0.2
1, 2, 3, 4, 5, 7, 11, 12, 13, 14, 15, 16, 19, 20, 6, 17, 9, 18, 8, 10
1992
3.20
6
672
2783
189.3
242.5
5
0.2
1, 2, 3, 4, 5, 7, 8, 10, 11, 9, 6, 15, 16, 18, 19, 20, 17, 12, 13, 14
1639
3.43
6
342
1625
131.4
251.4
6
0.2
1, 3, 4, 5, 6, 2, 8, 9, 10, 11, 12, 7, 15, 16, 20, 13, 14, 19, 17, 18
1949
3.38
7
328
1872
143.7
253.0
7
0.2
1, 2, 4, 5, 6, 7, 8, 3, 11, 13, 14, 18, 19, 20, 17, 9, 10, 12, 16, 15
1912
3.25
7
499
2614
180.8
252.9
8
0.2
1, 2, 3, 4, 5, 6, 8, 10, 11, 12, 7, 9, 15, 16, 17, 18, 19, 20, 13, 14
1953
3.56
4
328
1222
111.2
237.1
9
0.2
1, 3, 4, 5, 6, 2, 8, 9, 10, 11, 7, 15, 16, 18, 19, 20, 17, 12, 13, 14
829
3.43
6
341
1754
137.8
254.6
10
0.2
1, 2, 3, 4, 5, 6, 7, 8, 9, 11, 12, 10, 15, 16, 17, 18, 19, 20, 13, 14
1973
3.64
3
328
811
90.7
232.9
1
0.2
1, 2, 4, 6, 7, 8, 10, 11, 12, 13, 9, 5, 3, 15, 16, 18, 19, 20, 17, 14
1825
3.40
5
566
1944
155.3
268.3
2
0.2
1, 2, 3, 4, 7, 8, 10, 11, 12, 13, 9, 5, 6, 16, 17, 18, 19, 20, 14, 15
1598
3.44
5
482
2010
158.6
269.7
3
0.2
1, 2, 3, 4, 5, 6, 7, 8, 10, 11, 12, 13, 14, 15, 9, 17, 18, 19, 20, 16
1812
3.69
2
388
694
92.8
251.0
4
0.2
1, 2, 3, 4, 6, 7, 8, 10, 5, 12, 14, 17, 18, 19, 20, 13, 9, 11, 15, 16
1923
3.24
6
701
3058
211.0
258.1
5
0.2
1, 2, 3, 4, 6, 7, 8, 10, 11, 12, 13, 9, 5, 15, 16, 17, 18, 20, 14, 19
1522
3.51
4
482
1354
125.8
247.1
Data Set 5
Data Set 4
90
6
0.2
1, 2, 4, 6, 7, 8, 9, 10, 11, 12, 13, 3, 5, 15, 16, 19, 20, 17, 18, 14
1983
3.40
5
558
2068
161.5
246.2
7
0.2
1, 2, 3, 4, 5, 7, 8, 10, 11, 12, 9, 14, 6, 17, 18, 19, 20, 13, 15, 16
1960
3.43
5
489
2002
158.2
241.5
8
0.2
1, 2, 3, 4, 5, 6, 7, 8, 10, 11, 12, 9, 14, 17, 18, 19, 20, 13, 15, 16
2000
3.50
4
489
1516
133.9
238.5
9
0.2
1, 2, 3, 4, 6, 7, 8, 9, 10, 11, 12, 5, 14, 15, 18, 19, 20, 13, 17, 16
1737
3.51
4
489
1482
132.2
253.9
10
0.2
1, 2, 3, 4, 7, 8, 10, 11, 12, 13, 9, 5, 6, 15, 16, 17, 18, 20, 14, 19
1893
3.45
5
482
1771
146.6
250.6
1
0.2
1, 2, 3, 4, 5, 8, 9, 10, 11, 12, 13, 14, 15, 6, 7, 17, 18, 19, 20, 16
1915
3.57
3
402
1166
107.4
255.5
2
0.2
1, 2, 3, 5, 6, 8, 9, 10, 11, 12, 13, 14, 4, 7, 16, 17, 19, 20, 15, 18
1973
3.50
4
419
1464
122.3
247.7
3
0.2
1, 2, 3, 4, 5, 8, 9, 11, 12, 13, 14, 15, 6, 7, 10, 17, 18, 19, 20, 16
1798
3.51
4
402
1456
121.9
275.1
4
0.2
1, 2, 3, 9, 10, 11, 12, 13, 5, 4, 7, 6, 8, 17, 18, 19, 20, 14, 15, 16
1977
3.18
8
476
3235
210.9
283.3
5
0.2
1, 2, 3, 4, 5, 8, 10, 11, 12, 13, 14, 15, 6, 7, 9, 17, 18, 20, 16, 19
1860
3.45
5
402
1713
134.8
233.8
6
0.2
1, 2, 3, 4, 6, 7, 8, 9, 10, 11, 12, 13, 14, 5, 16, 17, 18, 19, 20, 15
1527
3.63
2
419
817
90.0
234.1
7
0.2
1, 2, 3, 6, 8, 9, 10, 11, 12, 13, 14, 7, 4, 5, 17, 18, 19, 20, 15, 16
1850
3.42
5
422
2001
149.2
234.5
8
0.2
1, 2, 3, 4, 5, 8, 9, 10, 11, 12, 13, 14, 15, 6, 7, 17, 18, 19, 20, 16
1636
3.57
3
402
1166
107.4
246.0
9
0.2
1, 2, 3, 4, 8, 9, 10, 12, 13, 14, 5, 7, 6, 11, 17, 18, 19, 20, 15, 16
1834
3.36
6
419
2255
161.9
236.7
10
0.2
1, 2, 3, 4, 5, 8, 9, 10, 12, 13, 14, 15, 6, 7, 11, 17, 18, 19, 20, 16
1346
3.51
4
402
1412
119.7
342.8
1
0.2
1, 2, 3, 4, 5, 6, 9, 10, 11, 12, 13, 7, 8, 16, 17, 18, 19, 20, 15, 14
1551
3.52
4
471
1714
147.3
420.3
2
0.2
1, 2, 3, 4, 5, 6, 7, 8, 9, 10, 11, 12, 16, 17, 18, 19, 20, 13, 14, 15
1967
3.60
3
438
1314
127.3
386.9
3
0.2
1, 3, 4, 5, 6, 7, 2, 9, 10, 11, 12, 8, 17, 18, 19, 20, 13, 16, 14, 15
1998
3.39
6
472
2377
180.4
403.0
4
0.2
1, 2, 3, 4, 6, 7, 8, 9, 10, 11, 5, 13, 16, 17, 18, 19, 20, 12, 14, 15
1794
3.49
4
524
1949
159.0
367.5
5
0.2
1, 2, 3, 4, 5, 6, 9, 10, 11, 12, 13, 7, 8, 16, 17, 18, 19, 20, 15, 14
1309
3.52
4
471
1714
147.3
389.6
6
0.2
1, 3, 4, 5, 6, 7, 9, 10, 11, 2, 8, 13, 14, 15, 16, 20, 19, 18, 17, 12
1872
3.34
6
637
1992
161.2
435.9
7
0.2
1, 3, 4, 5, 6, 7, 9, 10, 11, 12, 2, 14, 15, 16, 17, 8, 19, 20, 18, 13
1940
3.40
4
723
1961
159.6
393.2
8
0.2
1, 3, 4, 5, 6, 7, 2, 9, 10, 11, 12, 13, 8, 15, 16, 19, 20, 14, 18, 17
1542
3.51
5
388
1663
144.7
410.6
9
0.2
1, 2, 3, 4, 5, 6, 7, 9, 10, 11, 8, 13, 14, 15, 12, 18, 19, 20, 16, 17
1835
3.62
4
303
996
111.4
362.2
10
0.2
1, 3, 4, 5, 6, 7, 2, 9, 10, 11, 12, 8, 14, 15, 16, 17, 18, 20, 13, 19
535
3.55
4
438
1309
127.0
288.0
91
8.4 Shape versus Type Results
Data Set 1
Replication Number Mu Shape Mu Type
Chromosome
Generation Found Fitness
NT Tmax
TT
Computation Time
Favg
1 Linear
Minimum
1, 2, 3, 4, 5, 7, 8, 10, 11, 12, 14, 15, 6, 9, 19, 20, 13, 16, 17, 18
364
0.70
6
54
274
19.25
138.562
2 Linear
Minimum
1, 2, 3, 4, 5, 6, 8, 9, 10, 11, 12, 13, 7, 17, 14, 19, 20, 15, 16, 18
1984
0.75
5
48
199
15.65
135.859
3 Linear
Minimum
1, 2, 3, 4, 5, 6, 7, 8, 10, 11, 12, 13, 14, 15, 9, 18, 19, 20, 16, 17
1900
0.82
3
39
111
11.1
133.016
4 Linear
Minimum
1, 2, 4, 8, 10, 12, 14, 5, 16, 6, 3, 18, 19, 20, 9, 13, 7, 11, 17, 15
821
0.55
9
94
627
37.05
151.281
5 Linear
Minimum
1, 2, 3, 4, 5, 6, 7, 8, 9, 10, 11, 16, 17, 18, 14, 13, 20, 12, 15, 19
1864
0.73
5
59
218
16.45
135.953
6 Linear
Minimum
1, 2, 3, 4, 5, 6, 7, 8, 9, 10, 11, 12, 13, 14, 15, 16, 17, 18, 19, 20
1194
1.00
0
0
0
5.55
130.657
7 Linear
Minimum
2, 4, 5, 6, 7, 12, 13, 3, 16, 1, 18, 19, 20, 8, 9, 15, 11, 10, 14, 17
576
0.55
9
95
678
39.45
149.422
8 Linear
Minimum
1, 2, 3, 4, 7, 8, 10, 11, 12, 16, 17, 5, 6, 19, 20, 14, 9, 13, 15, 18
1303
0.65
7
75
429
27
140.172
9 Linear
Minimum
1, 2, 3, 4, 5, 6, 7, 8, 9, 10, 11, 12, 14, 15, 16, 13, 18, 19, 17, 20
1868
0.85
3
24
56
8.35
132.703
10 Linear
Minimum
1, 2, 4, 5, 6, 8, 9, 10, 11, 3, 13, 16, 7, 18, 19, 20, 12, 14, 15, 17
1511
0.70
6
59
316
21.5
136.485
1 Linear
Summation 1, 2, 3, 4, 5, 6, 7, 8, 9, 10, 11, 12, 13, 14, 15, 16, 17, 18, 19, 20
310
4.00
0
0
0
5.55
131.25
2 Linear
Summation 1, 2, 3, 4, 5, 6, 7, 8, 9, 10, 11, 12, 13, 14, 15, 16, 17, 18, 19, 20
292
4.00
0
0
0
5.55
132.89
3 Linear
Summation 1, 2, 3, 4, 5, 6, 7, 8, 9, 10, 11, 13, 14, 15, 16, 12, 18, 19, 20, 17
1872
3.74
2
30
59
8.5
141.641
4 Linear
Summation 1, 2, 3, 4, 5, 6, 7, 8, 9, 10, 11, 12, 13, 14, 15, 16, 17, 19, 18, 20
1976
3.82
2
15
23
6.7
138.984
5 Linear
Summation 1, 2, 3, 4, 5, 6, 7, 8, 9, 10, 11, 12, 13, 14, 15, 16, 17, 18, 19, 20
1595
4.00
0
0
0
5.55
135.953
6 Linear
Summation 1, 2, 3, 4, 5, 6, 7, 8, 9, 10, 11, 12, 13, 14, 15, 16, 17, 18, 19, 20
1200
4.00
0
0
0
5.55
138.703
7 Linear
Summation 1, 2, 3, 4, 5, 6, 7, 8, 9, 10, 11, 12, 13, 14, 15, 16, 17, 18, 19, 20
912
4.00
0
0
0
5.55
133.703
8 Linear
Summation 1, 2, 3, 4, 5, 6, 7, 8, 9, 10, 11, 12, 13, 14, 15, 16, 17, 18, 19, 20
1997
4.00
0
0
0
5.55
139.407
9 Linear
Summation 1, 2, 3, 4, 5, 6, 7, 8, 9, 10, 11, 12, 13, 14, 15, 16, 17, 18, 19, 20
520
4.00
0
0
0
5.55
132.954
10 Linear
Summation 1, 2, 3, 4, 5, 6, 7, 8, 9, 11, 10, 13, 14, 15, 12, 17, 16, 20, 18, 19
1923
3.62
5
21
88
9.95
144.203
1 Linear
Hybrid
1, 2, 3, 4, 5, 6, 7, 8, 9, 10, 11, 12, 13, 14, 15, 16, 17, 18, 19, 20
1017
8.00
0
0
0
5.55
141.453
2 Linear
Hybrid
1, 2, 3, 4, 5, 6, 7, 8, 9, 10, 11, 12, 13, 14, 15, 16, 17, 18, 19, 20
391
8.00
0
0
0
5.55
134.39
3 Linear
Hybrid
1, 2, 3, 4, 5, 6, 7, 8, 9, 10, 11, 12, 13, 14, 15, 16, 17, 18, 19, 20
1078
8.00
0
0
0
5.55
133.813
4 Linear
Hybrid
1, 2, 3, 4, 5, 6, 7, 8, 9, 10, 11, 12, 13, 14, 15, 16, 17, 18, 19, 20
572
8.00
0
0
0
5.55
134.062
5 Linear
Hybrid
1, 2, 3, 4, 5, 6, 7, 8, 9, 10, 11, 12, 13, 14, 15, 16, 17, 18, 19, 20
599
8.00
0
0
0
5.55
133.25
92
6 Linear
Hybrid
1, 2, 3, 4, 5, 6, 7, 8, 9, 10, 11, 12, 13, 14, 15, 16, 17, 18, 19, 20
345
8.00
0
0
0
5.55
134.5
7 Linear
Hybrid
1, 2, 3, 4, 5, 6, 7, 8, 9, 10, 11, 12, 13, 14, 15, 16, 17, 18, 19, 20
1232
8.00
0
0
0
5.55
136.687
8 Linear
Hybrid
1, 2, 3, 4, 6, 5, 7, 8, 9, 10, 11, 12, 13, 14, 15, 16, 17, 19, 18, 20
1973
7.77
3
15
31
7.25
143.469
9 Linear
Hybrid
1, 2, 3, 4, 5, 6, 7, 8, 9, 10, 11, 12, 13, 14, 15, 16, 17, 18, 19, 20
360
8.00
0
0
0
5.55
131.25
10 Linear
Hybrid
1, 2, 3, 4, 5, 6, 7, 8, 9, 10, 11, 12, 13, 14, 15, 16, 17, 18, 19, 20
405
8.00
0
0
0
5.55
130.938
1 Parabolic Minimum
1, 2, 3, 4, 5, 12, 15, 16, 18, 19, 20, 6, 7, 14, 10, 8, 9, 11, 13, 17
1903
0.30
9
93
748
43.1
151.812
2 Parabolic Minimum
1, 2, 3, 4, 5, 6, 7, 8, 11, 12, 14, 16, 9, 10, 18, 19, 20, 15, 13, 17
1999
0.51
5
62
237
17.4
134.188
3 Parabolic Minimum
1, 2, 3, 5, 6, 7, 8, 9, 4, 15, 17, 18, 19, 20, 10, 11, 12, 13, 14, 16
584
0.42
7
67
429
27
142.015
4 Parabolic Minimum
1, 2, 3, 4, 5, 6, 7, 8, 9, 10, 11, 13, 18, 19, 20, 12, 14, 15, 16, 17
1935
0.53
5
59
279
19.5
134.25
5 Parabolic Minimum
1, 3, 4, 6, 8, 10, 12, 13, 14, 5, 16, 2, 19, 20, 7, 9, 11, 15, 17, 18
249
0.36
8
85
548
33.1
139.406
6 Parabolic Minimum
1, 2, 4, 6, 8, 9, 11, 15, 17, 5, 3, 19, 20, 7, 12, 16, 10, 13, 14, 18
613
0.30
9
88
649
38.15
139.703
7 Parabolic Minimum
1, 2, 3, 4, 6, 8, 9, 10, 11, 12, 13, 7, 5, 17, 18, 19, 20, 14, 15, 16
657
0.56
5
53
236
17.5
135.094
8 Parabolic Minimum
1, 2, 3, 4, 5, 6, 7, 8, 10, 11, 12, 13, 9, 16, 18, 19, 20, 14, 15, 17
1680
0.60
4
49
161
13.6
137.031
9 Parabolic Minimum
1, 2, 3, 4, 5, 6, 7, 8, 9, 10, 12, 15, 19, 20, 11, 13, 14, 18, 16, 17
1950
0.48
6
66
337
22.4
137.047
10 Parabolic Minimum
1, 2, 3, 4, 5, 6, 7, 8, 9, 11, 12, 10, 14, 15, 16, 17, 13, 19, 20, 18
1908
0.72
3
32
67
8.9
132.61
1 Parabolic Summation 1, 2, 3, 4, 5, 6, 7, 8, 9, 10, 11, 12, 13, 14, 15, 16, 17, 18, 19, 20
917
4.00
0
0
0
5.55
134.812
2 Parabolic Summation 1, 2, 3, 4, 5, 6, 7, 8, 9, 10, 11, 12, 13, 14, 15, 16, 17, 18, 19, 20
237
4.00
0
0
0
5.55
132.125
3 Parabolic Summation 1, 2, 3, 4, 5, 6, 7, 8, 9, 10, 11, 12, 13, 14, 15, 16, 17, 18, 19, 20
269
4.00
0
0
0
5.55
131.828
4 Parabolic Summation 1, 2, 3, 4, 5, 6, 7, 8, 9, 10, 11, 12, 13, 14, 15, 16, 17, 18, 19, 20
251
4.00
0
0
0
5.55
133.25
5 Parabolic Summation 1, 2, 3, 4, 5, 6, 7, 8, 9, 10, 11, 12, 13, 14, 15, 16, 17, 18, 19, 20
395
4.00
0
0
0
5.55
133.265
6 Parabolic Summation 1, 2, 3, 4, 5, 6, 7, 8, 9, 10, 11, 12, 13, 14, 15, 16, 17, 18, 19, 20
258
4.00
0
0
0
5.55
130.343
7 Parabolic Summation 1, 2, 3, 4, 5, 6, 7, 8, 9, 10, 11, 12, 14, 15, 16, 13, 18, 19, 20, 17
1963
3.51
2
30
53
8.2
142.657
8 Parabolic Summation 1, 2, 3, 4, 5, 6, 7, 8, 9, 10, 11, 12, 13, 14, 15, 16, 17, 18, 19, 20
366
4.00
0
0
0
5.55
132.829
9 Parabolic Summation 1, 2, 3, 4, 5, 6, 7, 8, 9, 10, 11, 12, 13, 14, 15, 16, 17, 18, 19, 20
184
4.00
0
0
0
5.55
131.657
10 Parabolic Summation 1, 2, 3, 4, 5, 6, 7, 8, 9, 10, 11, 12, 13, 14, 15, 16, 17, 18, 19, 20
739
4.00
0
0
0
5.55
134.687
1 Parabolic Hybrid
1, 2, 3, 4, 5, 6, 7, 8, 9, 10, 11, 12, 13, 14, 15, 16, 17, 18, 19, 20
450
8.00
0
0
0
5.55
134.562
2 Parabolic Hybrid
1, 2, 3, 4, 5, 6, 7, 8, 9, 10, 11, 12, 13, 14, 15, 16, 17, 18, 19, 20
476
8.00
0
0
0
5.55
136.61
3 Parabolic Hybrid
1, 2, 3, 4, 5, 6, 7, 8, 9, 10, 11, 12, 13, 14, 15, 16, 17, 18, 19, 20
444
8.00
0
0
0
5.55
134.844
4 Parabolic Hybrid
1, 2, 3, 4, 5, 6, 7, 8, 9, 10, 11, 12, 13, 14, 15, 16, 17, 18, 19, 20
892
8.00
0
0
0
5.55
139.078
93
5 Parabolic Hybrid
1, 2, 3, 4, 5, 6, 7, 8, 9, 10, 11, 12, 13, 14, 15, 16, 17, 18, 19, 20
1814
8.00
0
0
0
5.55
145.25
6 Parabolic Hybrid
1, 2, 3, 4, 5, 6, 7, 8, 9, 10, 11, 12, 13, 14, 15, 16, 17, 18, 19, 20
680
8.00
0
0
0
5.55
138.063
7 Parabolic Hybrid
1, 2, 3, 4, 5, 6, 7, 8, 9, 10, 11, 12, 13, 14, 15, 16, 17, 18, 19, 20
1139
8.00
0
0
0
5.55
137.984
8 Parabolic Hybrid
1, 2, 3, 4, 5, 6, 7, 8, 9, 10, 11, 12, 13, 14, 15, 16, 17, 18, 19, 20
438
8.00
0
0
0
5.55
137.344
9 Parabolic Hybrid
1, 2, 3, 4, 5, 6, 7, 8, 9, 10, 11, 12, 13, 14, 15, 16, 17, 18, 19, 20
808
8.00
0
0
0
5.55
132.797
Data Set 2
10 Parabolic Hybrid
1, 2, 3, 4, 5, 6, 7, 8, 9, 10, 11, 12, 13, 14, 15, 16, 17, 18, 19, 20
229
8.00
0
0
0
5.55
131.375
1 Linear
Minimum
1, 3, 4, 5, 6, 8, 10, 2, 13, 18, 19, 20, 7, 12, 9, 15, 17, 11, 16, 14
178
0.55
9
854
5663
332.55
331.609
2 Linear
Minimum
1, 3, 4, 5, 6, 7, 8, 2, 10, 11, 12, 13, 14, 15, 9, 18, 19, 20, 16, 17
1048
0.80
4
339
1272
113
301.688
3 Linear
Minimum
2, 3, 4, 5, 6, 1, 8, 10, 11, 15, 16, 17, 18, 7, 20, 9, 14, 12, 13, 19
470
0.65
7
646
3500
224.4
257.281
4 Linear
Minimum
1, 2, 3, 4, 5, 6, 7, 8, 9, 10, 11, 12, 13, 14, 15, 16, 17, 18, 19, 20
1616
1.00
0
0
0
49.4
238.266
5 Linear
Minimum
1, 2, 3, 4, 5, 6, 7, 8, 9, 10, 11, 16, 19, 20, 12, 13, 18, 14, 15, 17
1983
0.70
6
502
2638
181.3
261.515
6 Linear
Minimum
1, 2, 5, 6, 7, 10, 13, 14, 15, 16, 3, 4, 8, 18, 19, 20, 9, 11, 12, 17
1120
0.65
7
669
4142
256.5
254.531
7 Linear
Minimum
1, 2, 3, 4, 5, 6, 7, 8, 9, 10, 11, 12, 13, 14, 15, 16, 17, 18, 19, 20
1999
1.00
0
0
0
49.4
266.687
8 Linear
Minimum
1, 2, 3, 5, 6, 7, 8, 9, 10, 15, 4, 18, 19, 20, 16, 12, 11, 13, 14, 17
884
0.65
7
613
3756
237.2
261.609
9 Linear
Minimum
1, 2, 3, 5, 6, 10, 11, 15, 17, 18, 4, 20, 12, 14, 13, 8, 7, 9, 19, 16
207
0.55
9
853
5674
333.1
258.781
10 Linear
Minimum
1, 2, 3, 4, 5, 6, 7, 11, 16, 17, 18, 19, 20, 8, 10, 9, 13, 12, 15, 14
1997
0.64
7
694
4530
275.9
271
1 Linear
Summation 1, 2, 3, 4, 5, 6, 7, 8, 9, 10, 11, 12, 13, 14, 15, 16, 17, 18, 19, 20
1193
4.00
0
0
0
49.4
254.937
2 Linear
Summation 1, 2, 3, 4, 5, 6, 7, 8, 9, 10, 11, 12, 13, 14, 15, 16, 17, 18, 19, 20
681
4.00
0
0
0
49.4
242.469
3 Linear
Summation 1, 2, 3, 4, 5, 6, 7, 8, 9, 10, 11, 12, 13, 14, 15, 16, 17, 18, 19, 20
229
4.00
0
0
0
49.4
292.657
4 Linear
Summation 1, 2, 3, 4, 5, 6, 7, 8, 9, 10, 11, 12, 13, 14, 15, 16, 17, 18, 19, 20
473
4.00
0
0
0
49.4
272.406
5 Linear
Summation 1, 2, 3, 4, 5, 6, 7, 8, 9, 10, 11, 12, 13, 14, 15, 16, 17, 18, 19, 20
261
4.00
0
0
0
49.4
267.563
6 Linear
Summation 1, 2, 3, 4, 5, 6, 7, 8, 9, 10, 11, 12, 13, 14, 15, 16, 17, 18, 19, 20
383
4.00
0
0
0
49.4
273.422
7 Linear
Summation 1, 2, 3, 4, 5, 6, 7, 8, 9, 10, 11, 12, 13, 14, 15, 16, 17, 18, 19, 20
258
4.00
0
0
0
49.4
250.89
8 Linear
Summation 1, 2, 3, 4, 5, 6, 7, 8, 9, 10, 11, 12, 13, 14, 15, 16, 17, 18, 19, 20
1305
4.00
0
0
0
49.4
277.016
9 Linear
Summation 1, 2, 3, 4, 5, 6, 7, 8, 9, 10, 11, 12, 13, 14, 15, 16, 17, 18, 19, 20
1283
4.00
0
0
0
49.4
286.031
10 Linear
Summation 1, 2, 3, 4, 5, 6, 7, 8, 9, 10, 11, 12, 13, 14, 15, 16, 17, 18, 19, 20
361
4.00
0
0
0
49.4
233.219
1 Linear
Hybrid
1, 2, 3, 4, 5, 6, 7, 8, 9, 10, 11, 12, 13, 14, 15, 16, 17, 18, 19, 20
408
8.00
0
0
0
49.4
242.406
2 Linear
Hybrid
1, 2, 3, 4, 5, 6, 7, 8, 9, 10, 11, 12, 13, 14, 15, 16, 17, 18, 19, 20
319
8.00
0
0
0
49.4
267.203
3 Linear
Hybrid
1, 2, 3, 4, 5, 6, 7, 8, 9, 10, 11, 12, 13, 14, 15, 16, 17, 18, 19, 20
398
8.00
0
0
0
49.4
270.765
94
4 Linear
Hybrid
1, 2, 3, 4, 5, 6, 7, 8, 9, 10, 11, 12, 13, 14, 15, 16, 17, 18, 19, 20
496
8.00
0
0
0
49.4
250.234
5 Linear
Hybrid
1, 2, 3, 4, 5, 6, 7, 8, 9, 10, 11, 12, 13, 14, 15, 16, 17, 18, 19, 20
818
8.00
0
0
0
49.4
265.188
6 Linear
Hybrid
1, 2, 3, 5, 6, 7, 4, 9, 10, 11, 12, 8, 14, 15, 16, 13, 18, 19, 20, 17
1443
7.62
4
256
909
94.85
284.578
7 Linear
Hybrid
1, 2, 3, 4, 5, 6, 7, 8, 9, 10, 11, 12, 13, 14, 15, 16, 17, 18, 19, 20
337
8.00
0
0
0
49.4
251.375
8 Linear
Hybrid
1, 2, 3, 5, 6, 7, 8, 9, 10, 4, 12, 13, 14, 15, 16, 11, 18, 19, 20, 17
921
7.62
3
348
909
94.85
280.562
9 Linear
Hybrid
1, 2, 3, 4, 5, 6, 7, 8, 9, 10, 11, 12, 13, 14, 15, 16, 17, 18, 19, 20
1552
8.00
0
0
0
49.4
267.844
10 Linear
Hybrid
1, 2, 3, 4, 5, 6, 7, 8, 9, 10, 11, 12, 13, 14, 15, 16, 17, 18, 19, 20
179
8.00
0
0
0
49.4
241.937
1 Parabolic Minimum
1, 3, 5, 7, 10, 11, 12, 2, 14, 6, 16, 4, 18, 19, 20, 13, 8, 9, 15, 17
750
0.36
8
742
4595
279.15
278.063
2 Parabolic Minimum
1, 2, 3, 5, 6, 7, 8, 9, 11, 15, 4, 17, 18, 19, 20, 10, 13, 12, 14, 16
1984
0.47
6
602
3099
204.35
264.781
3 Parabolic Minimum
1, 2, 5, 6, 13, 16, 17, 18, 19, 20, 3, 12, 10, 4, 7, 8, 9, 15, 11, 14
388
0.25
10
933
7456
422.2
288.594
4 Parabolic Minimum
1, 2, 3, 4, 5, 6, 7, 8, 9, 10, 11, 12, 13, 14, 15, 16, 17, 18, 19, 20
1937
1.00
0
0
0
49.4
265.719
5 Parabolic Minimum
1, 3, 4, 5, 6, 2, 10, 13, 15, 16, 17, 18, 7, 20, 8, 9, 12, 11, 19, 14
373
0.36
8
723
4543
276.55
310.281
6 Parabolic Minimum
1, 2, 3, 6, 7, 8, 10, 11, 13, 14, 4, 5, 17, 19, 20, 9, 12, 15, 16, 18
164
0.42
7
646
3559
227.35
272.062
7 Parabolic Minimum
1, 2, 3, 4, 7, 8, 9, 10, 11, 12, 13, 5, 6, 17, 18, 19, 20, 14, 16, 15
1700
0.56
5
478
2171
157.95
260.794
8 Parabolic Minimum
1, 2, 4, 6, 7, 8, 3, 10, 13, 14, 15, 16, 5, 18, 19, 20, 9, 12, 11, 17
1922
0.44
6
646
3172
208
256.571
9 Parabolic Minimum
1, 2, 3, 4, 5, 6, 7, 8, 9, 10, 11, 12, 13, 14, 15, 16, 17, 18, 19, 20
1350
1.00
0
0
0
49.4
244.655
10 Parabolic Minimum
1, 4, 5, 6, 8, 9, 11, 12, 14, 2, 3, 16, 7, 18, 19, 20, 17, 10, 13, 15
1419
0.42
7
663
3663
232.55
264.25
1 Parabolic Summation 1, 2, 3, 4, 5, 6, 7, 8, 9, 10, 11, 12, 13, 14, 15, 16, 17, 18, 19, 20
1253
4.00
0
0
0
49.4
262.646
2 Parabolic Summation 1, 2, 3, 5, 6, 4, 8, 9, 10, 11, 12, 7, 14, 15, 16, 13, 18, 19, 20, 17
1492
3.30
4
256
909
94.85
274.33
3 Parabolic Summation 1, 2, 3, 4, 5, 6, 7, 9, 10, 11, 12, 8, 14, 15, 16, 13, 18, 19, 20, 17
1498
3.41
3
256
687
83.75
280.955
4 Parabolic Summation 1, 2, 3, 4, 5, 6, 7, 8, 9, 10, 11, 12, 13, 14, 15, 16, 17, 18, 19, 20
266
4.00
0
0
0
49.4
239.959
5 Parabolic Summation 1, 2, 3, 4, 5, 6, 7, 8, 9, 10, 11, 12, 13, 14, 15, 16, 17, 18, 19, 20
780
4.00
0
0
0
49.4
261.4
6 Parabolic Summation 1, 2, 3, 4, 5, 6, 7, 8, 9, 10, 11, 12, 13, 14, 15, 16, 17, 18, 19, 20
1628
4.00
0
0
0
49.4
271.732
7 Parabolic Summation 1, 2, 3, 4, 5, 6, 7, 8, 9, 10, 11, 12, 13, 14, 15, 16, 17, 18, 19, 20
306
4.00
0
0
0
49.4
240.706
8 Parabolic Summation 1, 2, 3, 4, 5, 6, 7, 8, 9, 10, 11, 12, 13, 14, 15, 16, 17, 18, 19, 20
581
4.00
0
0
0
49.4
258.134
9 Parabolic Summation 1, 2, 3, 4, 5, 6, 7, 8, 9, 10, 11, 12, 13, 14, 15, 16, 17, 18, 19, 20
954
4.00
0
0
0
49.4
252.522
10 Parabolic Summation 1, 2, 3, 4, 5, 6, 7, 8, 9, 10, 11, 12, 13, 14, 15, 16, 17, 18, 19, 20
224
4.00
0
0
0
49.4
248.145
1 Parabolic Hybrid
1, 2, 3, 4, 5, 6, 7, 8, 9, 10, 11, 12, 13, 14, 15, 16, 17, 18, 19, 20
355
8.00
0
0
0
49.4
262.873
2 Parabolic Hybrid
1, 2, 3, 4, 5, 6, 7, 8, 9, 10, 11, 12, 13, 14, 15, 16, 17, 18, 19, 20
339
8.00
0
0
0
49.4
261.721
Data Set 3
95
3 Parabolic Hybrid
1, 2, 3, 4, 5, 6, 7, 8, 9, 10, 11, 12, 13, 14, 15, 16, 17, 18, 19, 20
415
8.00
0
0
0
49.4
253.896
4 Parabolic Hybrid
1, 2, 3, 4, 5, 6, 7, 8, 9, 10, 11, 12, 13, 14, 15, 16, 17, 18, 19, 20
1052
8.00
0
0
0
49.4
250.327
5 Parabolic Hybrid
1, 2, 3, 4, 5, 6, 7, 8, 9, 10, 11, 12, 13, 14, 15, 16, 17, 18, 19, 20
481
8.00
0
0
0
49.4
240.835
6 Parabolic Hybrid
1, 2, 3, 4, 5, 6, 7, 8, 9, 10, 11, 12, 13, 14, 15, 16, 17, 18, 19, 20
385
8.00
0
0
0
49.4
238.435
7 Parabolic Hybrid
1, 2, 3, 4, 5, 6, 7, 8, 9, 10, 11, 12, 13, 14, 15, 16, 17, 18, 19, 20
1467
8.00
0
0
0
49.4
257.449
8 Parabolic Hybrid
1, 2, 3, 5, 6, 7, 8, 4, 10, 11, 12, 13, 14, 9, 16, 15, 18, 19, 20, 17
1048
7.30
4
263
909
94.85
266.302
9 Parabolic Hybrid
1, 2, 3, 4, 5, 6, 7, 8, 10, 11, 12, 13, 14, 9, 16, 17, 18, 15, 20, 19
1909
7.41
3
254
646
81.7
269.185
10 Parabolic Hybrid
1, 2, 3, 4, 5, 6, 7, 8, 9, 10, 11, 12, 13, 14, 15, 16, 17, 18, 19, 20
484
8.00
0
0
0
49.4
240.118
1 Linear
Minimum
1, 2, 3, 4, 5, 7, 10, 11, 13, 14, 6, 17, 18, 19, 20, 9, 12, 8, 15, 16
676
0.70
6
585
2506
175.4
138.375
2 Linear
Minimum
2, 3, 4, 6, 7, 8, 1, 12, 17, 18, 19, 20, 5, 16, 9, 11, 10, 14, 13, 15
641
0.55
9
730
5164
308.3
151.438
3 Linear
Minimum
1, 2, 3, 4, 5, 6, 7, 8, 9, 10, 11, 12, 13, 14, 15, 16, 17, 18, 19, 20
1629
1.00
0
0
0
50.1
137.609
4 Linear
Minimum
1, 2, 3, 4, 5, 6, 7, 8, 9, 10, 11, 12, 13, 14, 15, 16, 17, 18, 19, 20
791
1.00
0
0
0
50.1
129.328
5 Linear
Minimum
1, 2, 3, 4, 5, 6, 7, 8, 9, 10, 11, 12, 13, 14, 15, 16, 17, 18, 19, 20
687
1.00
0
0
0
50.1
121.344
6 Linear
Minimum
1, 2, 3, 4, 5, 6, 7, 8, 9, 10, 11, 12, 13, 14, 15, 16, 17, 18, 19, 20
1323
1.00
0
0
0
50.1
126.172
7 Linear
Minimum
1, 2, 4, 7, 8, 10, 12, 3, 16, 17, 18, 19, 20, 5, 6, 13, 15, 14, 9, 11
653
0.60
8
749
4705
285.35
140.391
8 Linear
Minimum
1, 3, 4, 5, 6, 10, 11, 15, 2, 18, 19, 20, 17, 12, 8, 9, 14, 7, 13, 16
1428
0.55
9
806
4602
280.2
154.641
9 Linear
Minimum
1, 2, 3, 4, 5, 6, 7, 8, 9, 10, 11, 12, 13, 14, 15, 16, 17, 18, 19, 20
382
1.00
0
0
0
50.1
115.781
10 Linear
Minimum
1, 3, 4, 7, 8, 9, 10, 12, 15, 2, 18, 20, 11, 5, 17, 16, 19, 6, 14, 13
81
0.55
9
881
4796
289.9
151.75
1 Linear
Summation 1, 2, 3, 4, 5, 6, 7, 8, 9, 10, 11, 12, 13, 14, 15, 16, 17, 18, 19, 20
374
4.00
0
0
0
50.1
130.032
2 Linear
Summation 1, 2, 3, 4, 5, 6, 7, 8, 9, 10, 11, 12, 13, 14, 15, 16, 17, 18, 19, 20
987
4.00
0
0
0
50.1
136.844
3 Linear
Summation 1, 2, 3, 4, 5, 6, 7, 8, 9, 10, 11, 12, 13, 14, 15, 16, 17, 18, 19, 20
280
4.00
0
0
0
50.1
131.5
4 Linear
Summation 1, 2, 3, 4, 5, 6, 7, 8, 9, 10, 11, 12, 13, 14, 15, 16, 17, 18, 19, 20
248
4.00
0
0
0
50.1
127.593
5 Linear
Summation 1, 2, 3, 4, 5, 6, 7, 8, 9, 10, 11, 12, 13, 14, 15, 16, 17, 18, 19, 20
614
4.00
0
0
0
50.1
129.687
6 Linear
Summation 1, 2, 3, 4, 5, 6, 7, 8, 9, 10, 11, 12, 13, 14, 15, 16, 17, 18, 19, 20
177
4.00
0
0
0
50.1
124.265
7 Linear
Summation 1, 2, 3, 4, 5, 6, 7, 8, 9, 10, 11, 12, 13, 14, 15, 16, 17, 18, 19, 20
1416
4.00
0
0
0
50.1
138.875
8 Linear
Summation 1, 2, 3, 4, 5, 6, 7, 8, 9, 10, 11, 12, 13, 14, 15, 16, 17, 18, 19, 20
223
4.00
0
0
0
50.1
128.469
9 Linear
Summation 1, 2, 3, 4, 5, 6, 7, 8, 9, 10, 11, 12, 13, 14, 15, 16, 17, 18, 19, 20
197
4.00
0
0
0
50.1
123.391
10 Linear
Summation 1, 2, 3, 4, 5, 6, 7, 8, 9, 10, 11, 12, 13, 14, 15, 16, 17, 18, 19, 20
282
4.00
0
0
0
50.1
125.875
Hybrid
310
8.00
0
0
0
50.1
126.688
1 Linear
1, 2, 3, 4, 5, 6, 7, 8, 9, 10, 11, 12, 13, 14, 15, 16, 17, 18, 19, 20
96
2 Linear
Hybrid
1, 2, 3, 4, 5, 6, 7, 8, 9, 10, 11, 12, 13, 14, 15, 16, 17, 18, 19, 20
426
8.00
0
0
0
50.1
132.25
3 Linear
Hybrid
1, 2, 3, 4, 5, 6, 7, 8, 9, 10, 11, 12, 13, 14, 15, 16, 17, 18, 19, 20
517
8.00
0
0
0
50.1
131.985
4 Linear
Hybrid
1, 2, 3, 4, 5, 6, 7, 8, 9, 10, 11, 12, 13, 14, 15, 16, 17, 18, 19, 20
568
8.00
0
0
0
50.1
130.312
5 Linear
Hybrid
1, 2, 3, 4, 5, 6, 7, 8, 9, 10, 11, 12, 13, 14, 15, 16, 17, 18, 19, 20
363
8.00
0
0
0
50.1
130.844
6 Linear
Hybrid
1, 2, 3, 4, 5, 6, 7, 8, 9, 10, 11, 12, 13, 14, 15, 16, 17, 18, 19, 20
236
8.00
0
0
0
50.1
129.813
7 Linear
Hybrid
1, 2, 3, 4, 5, 6, 7, 8, 9, 10, 11, 12, 13, 14, 15, 16, 17, 18, 19, 20
219
8.00
0
0
0
50.1
128.438
8 Linear
Hybrid
1, 2, 3, 4, 5, 6, 7, 8, 9, 10, 11, 12, 13, 14, 15, 16, 17, 18, 19, 20
222
8.00
0
0
0
50.1
126.188
9 Linear
Hybrid
1, 2, 3, 4, 5, 6, 7, 8, 9, 10, 11, 12, 13, 14, 15, 16, 17, 18, 19, 20
478
8.00
0
0
0
50.1
128.281
10 Linear
Hybrid
1, 2, 3, 4, 5, 6, 7, 8, 9, 10, 11, 12, 13, 14, 15, 16, 17, 18, 19, 20
357
8.00
0
0
0
50.1
126.063
1 Parabolic Minimum
1, 2, 3, 4, 5, 6, 7, 8, 9, 10, 11, 12, 13, 14, 15, 16, 17, 18, 19, 20
1469
1.00
0
0
0
50.1
131.547
2 Parabolic Minimum
1, 2, 3, 4, 5, 6, 7, 8, 9, 10, 11, 12, 13, 14, 15, 16, 17, 18, 19, 20
709
1.00
0
0
0
50.1
119.938
3 Parabolic Minimum
1, 2, 3, 5, 6, 8, 9, 10, 14, 15, 4, 19, 20, 7, 12, 17, 13, 16, 18, 11
1649
0.36
8
669
3574
228.8
151.031
4 Parabolic Minimum
2, 3, 4, 5, 6, 7, 1, 9, 14, 15, 16, 17, 18, 19, 20, 8, 12, 13, 10, 11
1978
0.49
6
588
2986
199.4
143.672
5 Parabolic Minimum
2, 3, 4, 7, 1, 9, 12, 13, 14, 17, 18, 19, 20, 6, 5, 11, 8, 16, 10, 15
1538
0.36
8
759
4784
289.3
152.328
6 Parabolic Minimum
1, 2, 4, 5, 6, 8, 10, 11, 3, 18, 19, 20, 9, 17, 13, 14, 7, 12, 15, 16
458
0.30
9
759
4042
252.2
150.563
7 Parabolic Minimum
1, 2, 3, 4, 5, 6, 7, 10, 13, 17, 18, 19, 20, 12, 9, 8, 11, 16, 15, 14
1740
0.42
7
585
3258
213
152.062
8 Parabolic Minimum
1, 2, 3, 4, 5, 8, 9, 10, 12, 13, 17, 19, 20, 6, 7, 18, 15, 11, 16, 14
524
0.42
7
667
3727
236.45
136.016
9 Parabolic Minimum
1, 2, 3, 4, 5, 6, 7, 8, 9, 10, 11, 12, 14, 15, 19, 20, 13, 16, 17, 18
2000
0.64
4
328
898
95
141.203
10 Parabolic Minimum
1, 2, 3, 4, 5, 7, 10, 13, 14, 16, 18, 19, 20, 6, 9, 12, 8, 15, 11, 17
845
0.42
7
667
3439
222.05
137.704
1 Parabolic Summation 1, 2, 3, 4, 5, 6, 7, 8, 9, 10, 11, 12, 13, 14, 15, 16, 17, 18, 19, 20
426
4.00
0
0
0
50.1
125.328
2 Parabolic Summation 1, 2, 3, 4, 5, 6, 7, 8, 9, 10, 11, 12, 13, 14, 15, 16, 17, 18, 19, 20
221
4.00
0
0
0
50.1
124.562
3 Parabolic Summation 1, 2, 3, 4, 5, 6, 7, 8, 9, 10, 11, 12, 13, 14, 15, 16, 17, 18, 19, 20
159
4.00
0
0
0
50.1
123.156
4 Parabolic Summation 1, 2, 3, 4, 5, 6, 7, 8, 9, 10, 11, 12, 13, 14, 15, 16, 17, 18, 19, 20
311
4.00
0
0
0
50.1
121.453
5 Parabolic Summation 1, 2, 3, 4, 5, 6, 7, 8, 9, 10, 11, 12, 13, 14, 15, 16, 17, 18, 19, 20
296
4.00
0
0
0
50.1
125.438
6 Parabolic Summation 1, 2, 3, 4, 5, 6, 7, 8, 9, 10, 11, 12, 13, 14, 15, 16, 17, 18, 19, 20
363
4.00
0
0
0
50.1
125.985
7 Parabolic Summation 1, 2, 3, 4, 5, 6, 7, 8, 9, 10, 11, 12, 13, 14, 15, 16, 17, 18, 19, 20
283
4.00
0
0
0
50.1
126.281
8 Parabolic Summation 1, 2, 3, 4, 5, 6, 7, 8, 9, 10, 11, 12, 13, 14, 15, 16, 17, 18, 19, 20
435
4.00
0
0
0
50.1
130.125
9 Parabolic Summation 1, 2, 3, 4, 5, 6, 7, 8, 9, 10, 11, 12, 13, 14, 15, 16, 17, 18, 19, 20
441
4.00
0
0
0
50.1
126.047
10 Parabolic Summation 1, 2, 3, 4, 5, 6, 7, 8, 9, 10, 11, 12, 13, 14, 15, 16, 17, 18, 19, 20
410
4.00
0
0
0
50.1
130.859
Data Set 4
97
1 Parabolic Hybrid
1, 2, 3, 4, 5, 6, 7, 8, 9, 10, 11, 12, 13, 14, 15, 16, 17, 18, 19, 20
421
8.00
0
0
0
50.1
125.656
2 Parabolic Hybrid
1, 2, 3, 4, 5, 6, 7, 8, 9, 10, 11, 12, 13, 14, 15, 16, 17, 18, 19, 20
499
8.00
0
0
0
50.1
131.484
3 Parabolic Hybrid
1, 2, 3, 4, 5, 6, 7, 8, 9, 10, 11, 12, 13, 14, 15, 16, 17, 18, 19, 20
307
8.00
0
0
0
50.1
126.093
4 Parabolic Hybrid
1, 2, 3, 4, 5, 6, 7, 8, 9, 10, 11, 12, 13, 14, 15, 16, 17, 18, 19, 20
600
8.00
0
0
0
50.1
130.375
5 Parabolic Hybrid
1, 2, 3, 4, 5, 6, 7, 8, 9, 10, 11, 12, 13, 14, 15, 16, 17, 18, 19, 20
523
8.00
0
0
0
50.1
133.797
6 Parabolic Hybrid
1, 2, 3, 4, 5, 6, 7, 8, 9, 10, 11, 12, 13, 14, 15, 16, 17, 18, 19, 20
216
8.00
0
0
0
50.1
128.422
7 Parabolic Hybrid
1, 2, 3, 4, 5, 6, 7, 8, 9, 10, 11, 12, 13, 14, 15, 16, 17, 18, 19, 20
361
8.00
0
0
0
50.1
130.797
8 Parabolic Hybrid
1, 2, 3, 4, 5, 6, 7, 8, 9, 10, 11, 12, 13, 14, 15, 16, 17, 18, 19, 20
696
8.00
0
0
0
50.1
137.375
9 Parabolic Hybrid
1, 2, 3, 4, 5, 6, 7, 8, 9, 10, 11, 12, 13, 14, 15, 16, 17, 18, 19, 20
197
8.00
0
0
0
50.1
128.672
10 Parabolic Hybrid
1, 2, 3, 4, 5, 6, 7, 8, 9, 10, 11, 12, 13, 14, 15, 16, 17, 18, 19, 20
807
8.00
0
0
0
50.1
133.203
1 Linear
Minimum
1, 2, 3, 4, 5, 6, 7, 12, 13, 15, 18, 9, 20, 8, 10, 11, 19, 14, 17, 16
1929
0.60
8
731
4911
294.65
141.265
2 Linear
Minimum
1, 2, 3, 5, 8, 11, 14, 16, 17, 18, 19, 4, 6, 9, 7, 10, 13, 12, 15, 20
1637
0.55
9
768
5452
321.7
141.563
3 Linear
Minimum
1, 2, 3, 4, 5, 6, 8, 9, 10, 11, 12, 13, 14, 7, 16, 17, 15, 19, 20, 18
1702
0.83
3
319
738
86
132.656
4 Linear
Minimum
1, 2, 3, 4, 7, 8, 9, 10, 11, 14, 16, 6, 5, 19, 20, 13, 15, 12, 18, 17
659
0.65
7
634
3510
224.6
140.266
5 Linear
Minimum
1, 2, 3, 4, 5, 6, 7, 8, 9, 10, 11, 12, 13, 14, 15, 16, 17, 18, 19, 20
725
1.00
0
0
0
49.1
125.297
6 Linear
Minimum
1, 2, 3, 4, 5, 6, 7, 8, 10, 11, 13, 14, 15, 12, 9, 17, 18, 19, 20, 16
1178
0.80
3
362
873
92.75
133.672
7 Linear
Minimum
1, 2, 3, 4, 5, 6, 8, 9, 10, 11, 12, 13, 14, 7, 19, 20, 15, 17, 16, 18
1974
0.75
5
455
1942
146.2
139.906
8 Linear
Minimum
1, 2, 3, 5, 8, 9, 10, 12, 13, 14, 15, 16, 7, 6, 4, 20, 11, 19, 17, 18
710
0.65
7
594
3056
201.9
144.812
9 Linear
Minimum
1, 2, 3, 4, 5, 6, 7, 8, 9, 10, 11, 12, 13, 14, 15, 16, 17, 18, 19, 20
1849
1.00
0
0
0
49.1
133.062
Minimum
10 Linear
2, 3, 4, 6, 7, 8, 9, 10, 5, 1, 16, 18, 19, 20, 12, 17, 11, 13, 14, 15
312
0.60
8
654
4053
251.75
150.203
1 Linear
Summation 1, 2, 3, 4, 5, 6, 7, 8, 9, 10, 11, 12, 13, 15, 16, 14, 19, 20, 17, 18
1993
3.67
3
273
749
86.55
144.657
2 Linear
Summation 1, 2, 3, 4, 5, 6, 7, 8, 9, 10, 11, 12, 13, 14, 15, 16, 17, 18, 19, 20
829
4.00
0
0
0
49.1
131.5
3 Linear
Summation 1, 2, 3, 4, 5, 6, 7, 8, 9, 10, 11, 12, 13, 14, 15, 16, 17, 18, 19, 20
763
4.00
0
0
0
49.1
129.171
4 Linear
Summation 1, 2, 3, 4, 5, 6, 7, 8, 9, 10, 11, 12, 13, 14, 15, 16, 17, 18, 19, 20
540
4.00
0
0
0
49.1
126.344
5 Linear
Summation 1, 2, 3, 4, 5, 6, 7, 8, 9, 10, 11, 12, 13, 14, 15, 16, 17, 18, 19, 20
639
4.00
0
0
0
49.1
129.062
6 Linear
Summation 1, 2, 3, 4, 5, 6, 7, 8, 9, 10, 11, 12, 13, 14, 15, 16, 17, 18, 19, 20
1286
4.00
0
0
0
49.1
135.61
7 Linear
Summation 1, 2, 3, 4, 5, 6, 7, 8, 9, 10, 11, 12, 13, 14, 15, 16, 17, 18, 19, 20
531
4.00
0
0
0
49.1
126.813
8 Linear
Summation 1, 2, 3, 4, 5, 6, 8, 9, 10, 11, 12, 13, 14, 7, 16, 17, 15, 19, 20, 18
1883
3.64
3
319
738
86
141.25
9 Linear
Summation 1, 2, 3, 4, 5, 6, 7, 8, 9, 10, 11, 12, 13, 14, 15, 16, 17, 18, 19, 20
218
4.00
0
0
0
49.1
124.266
98
10 Linear
Summation 1, 2, 3, 4, 5, 6, 7, 8, 9, 10, 11, 12, 13, 14, 15, 16, 17, 18, 19, 20
1930
4.00
0
0
0
49.1
141.922
8.00
0
0
0
49.1
125.328
1 Linear
Hybrid
1, 2, 3, 4, 5, 6, 7, 8, 9, 10, 11, 12, 13, 14, 15, 16, 17, 18, 19, 20
271
2 Linear
Hybrid
1, 2, 3, 4, 5, 6, 8, 9, 10, 11, 12, 7, 14, 16, 17, 13, 15, 19, 20, 18
1987
7.61
4
268
949
96.55
144.312
3 Linear
Hybrid
1, 2, 3, 4, 5, 6, 7, 8, 9, 10, 11, 12, 13, 14, 15, 16, 17, 18, 19, 20
539
8.00
0
0
0
49.1
130.312
4 Linear
Hybrid
1, 2, 3, 4, 5, 6, 7, 8, 9, 10, 11, 12, 13, 14, 15, 16, 17, 18, 19, 20
315
8.00
0
0
0
49.1
124.297
5 Linear
Hybrid
1, 2, 3, 4, 5, 6, 7, 8, 9, 10, 11, 12, 13, 14, 15, 16, 17, 18, 19, 20
1456
8.00
0
0
0
49.1
137.984
6 Linear
Hybrid
1, 2, 3, 4, 5, 6, 7, 8, 9, 10, 11, 12, 13, 14, 15, 16, 17, 18, 19, 20
381
8.00
0
0
0
49.1
130.843
7 Linear
Hybrid
1, 2, 3, 4, 5, 6, 7, 8, 9, 10, 11, 12, 13, 14, 15, 16, 17, 18, 19, 20
424
8.00
0
0
0
49.1
130.813
8 Linear
Hybrid
1, 2, 3, 4, 5, 6, 7, 8, 9, 10, 11, 12, 13, 14, 15, 16, 17, 18, 19, 20
849
8.00
0
0
0
49.1
137.079
9 Linear
Hybrid
1, 2, 3, 4, 5, 6, 7, 8, 9, 10, 11, 12, 13, 14, 15, 16, 17, 18, 19, 20
267
8.00
0
0
0
49.1
128.844
10 Linear
Hybrid
1, 2, 3, 4, 5, 6, 7, 8, 9, 10, 11, 12, 13, 14, 15, 16, 17, 18, 19, 20
220
8.00
0
0
0
49.1
129.718
1 Parabolic Minimum
1, 2, 3, 4, 5, 6, 7, 8, 9, 10, 11, 12, 13, 14, 15, 16, 17, 18, 19, 20
1848
1.00
0
0
0
49.1
137.671
2 Parabolic Minimum
1, 2, 4, 5, 8, 10, 3, 13, 14, 16, 17, 18, 19, 6, 9, 7, 11, 15, 12, 20
441
0.36
8
723
4134
255.8
148.297
3 Parabolic Minimum
1, 2, 3, 4, 6, 7, 8, 9, 10, 11, 17, 5, 19, 20, 14, 13, 12, 15, 16, 18
1755
0.42
7
634
3860
242.1
141.359
4 Parabolic Minimum
1, 2, 3, 4, 5, 8, 9, 10, 11, 14, 15, 16, 7, 6, 19, 20, 12, 13, 17, 18
1192
0.49
6
548
2749
186.55
134.313
5 Parabolic Minimum
1, 2, 3, 4, 5, 6, 8, 9, 10, 11, 12, 7, 14, 15, 16, 13, 18, 19, 20, 17
1487
0.72
3
273
738
86
134.406
6 Parabolic Minimum
1, 2, 3, 4, 5, 8, 9, 10, 11, 12, 13, 14, 7, 6, 16, 17, 15, 19, 20, 18
1513
0.64
4
352
1090
103.6
138.234
7 Parabolic Minimum
1, 2, 3, 4, 5, 6, 7, 16, 17, 18, 19, 20, 8, 9, 10, 11, 12, 13, 14, 15
1724
0.36
8
731
5848
341.5
143.468
8 Parabolic Minimum
1, 2, 3, 4, 5, 6, 7, 8, 9, 10, 11, 12, 13, 14, 15, 17, 16, 19, 20, 18
1976
0.76
2
237
362
67.2
130.484
9 Parabolic Minimum
1, 2, 3, 4, 5, 8, 10, 14, 18, 19, 20, 11, 6, 7, 9, 12, 15, 16, 17, 13
1096
0.30
9
815
5950
346.6
141.422
10 Parabolic Minimum
1, 2, 3, 4, 5, 6, 7, 8, 9, 10, 11, 12, 13, 14, 15, 16, 17, 18, 19, 20
53
1.00
0
0
0
49.1
118.25
1 Parabolic Summation 1, 2, 3, 4, 5, 6, 7, 8, 9, 10, 11, 12, 13, 14, 15, 16, 17, 18, 19, 20
669
4.00
0
0
0
49.1
131.297
2 Parabolic Summation 1, 2, 3, 4, 5, 6, 7, 8, 9, 10, 11, 12, 13, 14, 15, 16, 17, 18, 19, 20
682
4.00
0
0
0
49.1
130.781
3 Parabolic Summation 1, 2, 3, 4, 5, 6, 7, 8, 9, 10, 11, 12, 13, 14, 15, 16, 17, 18, 19, 20
1713
4.00
0
0
0
49.1
139.234
4 Parabolic Summation 1, 2, 3, 4, 5, 6, 7, 8, 9, 10, 11, 12, 13, 14, 15, 16, 17, 18, 19, 20
804
4.00
0
0
0
49.1
131.985
5 Parabolic Summation 1, 2, 3, 4, 5, 6, 7, 8, 9, 10, 11, 12, 13, 14, 15, 16, 17, 18, 19, 20
536
4.00
0
0
0
49.1
129.781
6 Parabolic Summation 1, 2, 3, 4, 5, 6, 7, 8, 9, 10, 11, 12, 13, 14, 15, 16, 17, 18, 19, 20
236
4.00
0
0
0
49.1
128.172
7 Parabolic Summation 1, 2, 3, 4, 5, 6, 7, 8, 9, 10, 11, 12, 13, 14, 15, 16, 17, 18, 19, 20
485
4.00
0
0
0
49.1
128.234
8 Parabolic Summation 1, 2, 3, 4, 5, 6, 7, 8, 9, 10, 11, 12, 13, 14, 15, 16, 17, 18, 19, 20
160
4.00
0
0
0
49.1
126.485
99
9 Parabolic Summation 1, 2, 3, 4, 5, 6, 7, 8, 9, 10, 11, 12, 13, 14, 15, 16, 17, 18, 19, 20
187
4.00
0
0
0
49.1
65.765
10 Parabolic Summation 1, 2, 3, 4, 5, 6, 7, 8, 9, 10, 11, 12, 13, 14, 15, 16, 17, 18, 19, 20
271
4.00
0
0
0
49.1
124.453
1 Parabolic Hybrid
1, 2, 3, 4, 5, 6, 7, 8, 9, 10, 11, 12, 13, 14, 15, 16, 17, 18, 19, 20
336
8.00
0
0
0
49.1
126.656
2 Parabolic Hybrid
1, 2, 3, 4, 5, 6, 7, 8, 9, 10, 11, 12, 13, 14, 15, 16, 17, 18, 19, 20
227
8.00
0
0
0
49.1
129.64
3 Parabolic Hybrid
1, 2, 3, 4, 5, 6, 7, 8, 9, 10, 11, 12, 13, 14, 15, 16, 17, 18, 19, 20
425
8.00
0
0
0
49.1
129.579
4 Parabolic Hybrid
1, 2, 3, 4, 5, 6, 7, 8, 9, 10, 11, 12, 13, 14, 15, 17, 16, 19, 20, 18
1864
7.53
2
237
362
67.2
141.156
5 Parabolic Hybrid
1, 2, 3, 4, 5, 6, 7, 8, 9, 10, 11, 12, 13, 14, 15, 16, 17, 18, 19, 20
344
8.00
0
0
0
49.1
127.968
6 Parabolic Hybrid
1, 2, 3, 4, 5, 6, 7, 8, 9, 10, 11, 12, 13, 14, 15, 16, 17, 18, 19, 20
376
8.00
0
0
0
49.1
131.562
7 Parabolic Hybrid
1, 2, 3, 4, 5, 6, 7, 8, 9, 10, 11, 12, 13, 14, 15, 16, 17, 18, 19, 20
423
8.00
0
0
0
49.1
132.812
8 Parabolic Hybrid
1, 2, 3, 4, 5, 6, 7, 8, 9, 10, 11, 12, 13, 14, 15, 16, 17, 18, 19, 20
360
8.00
0
0
0
49.1
133.468
9 Parabolic Hybrid
1, 2, 3, 4, 5, 6, 7, 8, 9, 10, 11, 12, 13, 14, 15, 16, 17, 18, 19, 20
456
8.00
0
0
0
49.1
128
Data Set 5
10 Parabolic Hybrid
1, 2, 3, 4, 5, 6, 7, 8, 9, 10, 11, 12, 13, 14, 15, 16, 17, 18, 19, 20
559
8.00
0
0
0
49.1
128.719
1 Linear
Minimum
1, 2, 4, 5, 6, 7, 8, 11, 12, 3, 15, 18, 19, 20, 9, 10, 13, 17, 14, 16
1695
0.65
7
644
3761
237.15
137.953
2 Linear
Minimum
1, 2, 3, 4, 5, 6, 8, 9, 11, 12, 14, 15, 13, 7, 10, 17, 19, 20, 18, 16
423
0.75
5
456
1534
125.8
128.906
3 Linear
Minimum
1, 2, 3, 4, 5, 6, 7, 8, 9, 10, 11, 12, 13, 14, 15, 16, 17, 18, 19, 20
1485
1.00
0
0
0
49.1
131.579
4 Linear
Minimum
1, 2, 3, 4, 5, 6, 7, 8, 9, 10, 11, 12, 13, 14, 15, 16, 17, 18, 19, 20
389
1.00
0
0
0
49.1
121.344
5 Linear
Minimum
1, 2, 3, 5, 6, 8, 10, 15, 16, 17, 11, 4, 12, 7, 19, 20, 13, 9, 14, 18
588
0.60
8
673
3961
247.15
140.953
6 Linear
Minimum
1, 2, 3, 4, 5, 6, 8, 9, 10, 11, 12, 7, 15, 16, 17, 13, 14, 19, 20, 18
1891
0.80
4
268
1006
99.4
132.609
7 Linear
Minimum
1, 2, 4, 5, 6, 7, 8, 9, 11, 13, 3, 16, 19, 20, 10, 12, 17, 14, 15, 18
1803
0.65
7
619
3637
230.95
136.438
8 Linear
Minimum
1, 2, 3, 4, 5, 6, 7, 8, 9, 10, 11, 12, 13, 14, 15, 16, 17, 18, 19, 20
1231
1.00
0
0
0
49.1
132.593
9 Linear
Minimum
1, 2, 3, 4, 6, 7, 8, 10, 12, 13, 14, 15, 5, 17, 9, 11, 19, 20, 16, 18
1241
0.75
5
455
1913
144.75
137.453
10 Linear
Minimum
1, 2, 3, 4, 5, 6, 7, 8, 9, 10, 11, 12, 13, 14, 15, 16, 17, 18, 19, 20
1026
1.00
0
0
0
49.1
126.141
1 Linear
Summation 1, 2, 3, 4, 5, 6, 7, 8, 9, 10, 11, 12, 13, 14, 15, 16, 17, 18, 19, 20
417
4.00
0
0
0
49.1
130.141
2 Linear
Summation 1, 2, 3, 4, 5, 6, 7, 8, 9, 10, 11, 12, 13, 14, 15, 16, 17, 18, 19, 20
1314
4.00
0
0
0
49.1
135.765
3 Linear
Summation 1, 2, 3, 4, 5, 6, 7, 8, 9, 10, 11, 12, 13, 14, 15, 16, 17, 18, 19, 20
303
4.00
0
0
0
49.1
125.39
4 Linear
Summation 1, 2, 3, 4, 5, 6, 8, 9, 10, 7, 12, 13, 11, 15, 14, 17, 18, 19, 20, 16
1987
3.57
4
362
738
86
137.109
5 Linear
Summation 1, 2, 3, 4, 5, 6, 7, 8, 9, 10, 11, 12, 13, 14, 15, 16, 17, 18, 19, 20
242
4.00
0
0
0
49.1
126.796
6 Linear
Summation 1, 2, 3, 4, 5, 6, 7, 8, 9, 10, 11, 12, 13, 14, 15, 16, 17, 18, 19, 20
388
4.00
0
0
0
49.1
127.422
7 Linear
Summation 1, 2, 3, 4, 5, 6, 7, 8, 9, 10, 11, 12, 13, 14, 15, 16, 17, 18, 19, 20
1309
4.00
0
0
0
49.1
137.781
100
8 Linear
Summation 1, 2, 3, 4, 5, 6, 7, 8, 9, 10, 11, 12, 13, 14, 15, 16, 17, 18, 19, 20
1556
4.00
0
0
0
49.1
140.344
9 Linear
Summation 1, 2, 3, 4, 5, 6, 7, 8, 9, 10, 11, 12, 13, 14, 15, 16, 17, 18, 19, 20
324
4.00
0
0
0
49.1
124.813
10 Linear
Summation 1, 2, 3, 4, 5, 6, 7, 8, 9, 10, 11, 12, 13, 14, 15, 16, 17, 18, 19, 20
336
4.00
0
0
0
49.1
124.547
1 Linear
Hybrid
1, 2, 3, 4, 5, 6, 7, 8, 9, 10, 11, 12, 13, 14, 15, 16, 17, 18, 19, 20
541
8.00
0
0
0
49.1
134.141
2 Linear
Hybrid
1, 2, 3, 4, 5, 6, 7, 8, 9, 10, 11, 12, 13, 14, 15, 16, 17, 18, 19, 20
808
8.00
0
0
0
49.1
133.938
3 Linear
Hybrid
1, 2, 3, 4, 5, 6, 7, 8, 9, 10, 11, 12, 13, 14, 15, 16, 17, 18, 19, 20
223
8.00
0
0
0
49.1
128.296
4 Linear
Hybrid
1, 2, 3, 4, 5, 6, 7, 8, 9, 10, 11, 12, 13, 14, 15, 16, 17, 18, 19, 20
469
8.00
0
0
0
49.1
132.109
5 Linear
Hybrid
1, 2, 3, 4, 5, 6, 7, 8, 9, 10, 11, 12, 13, 14, 15, 16, 17, 18, 19, 20
165
8.00
0
0
0
49.1
125.25
6 Linear
Hybrid
1, 2, 3, 4, 5, 6, 7, 8, 9, 10, 11, 12, 13, 14, 15, 16, 17, 18, 19, 20
502
8.00
0
0
0
49.1
130.922
7 Linear
Hybrid
1, 2, 3, 4, 5, 6, 7, 8, 9, 10, 11, 12, 13, 14, 15, 16, 17, 18, 19, 20
423
8.00
0
0
0
49.1
130.329
8 Linear
Hybrid
1, 2, 3, 4, 5, 6, 7, 8, 9, 10, 11, 12, 13, 14, 15, 16, 17, 18, 19, 20
1267
8.00
0
0
0
49.1
141.531
9 Linear
Hybrid
1, 2, 3, 4, 5, 6, 7, 8, 9, 10, 11, 12, 13, 14, 15, 16, 17, 18, 19, 20
359
8.00
0
0
0
49.1
132.672
10 Linear
Hybrid
1, 2, 3, 4, 5, 6, 7, 8, 9, 10, 11, 12, 13, 14, 15, 16, 17, 18, 19, 20
346
8.00
0
0
0
49.1
128.5
1 Parabolic Minimum
1, 2, 3, 4, 5, 6, 7, 8, 9, 10, 11, 12, 13, 14, 15, 16, 17, 18, 19, 20
819
1.00
0
0
0
49.1
126.578
2 Parabolic Minimum
1, 2, 3, 4, 5, 8, 9, 10, 11, 12, 7, 15, 17, 6, 19, 20, 13, 14, 16, 18
1067
0.49
6
527
2630
180.6
144.5
3 Parabolic Minimum
1, 2, 4, 5, 8, 10, 11, 3, 13, 14, 15, 6, 7, 9, 17, 18, 19, 20, 12, 16
714
0.49
6
548
2394
168.8
131.672
4 Parabolic Minimum
1, 4, 6, 8, 9, 10, 12, 14, 15, 3, 18, 7, 2, 20, 5, 11, 13, 17, 19, 16
598
0.30
9
817
5171
307.65
146.829
5 Parabolic Minimum
1, 3, 4, 5, 6, 7, 10, 14, 2, 16, 17, 18, 9, 20, 8, 11, 12, 15, 13, 19
509
0.36
8
731
4738
286
146.469
6 Parabolic Minimum
1, 2, 3, 5, 6, 7, 8, 10, 13, 4, 16, 18, 19, 20, 9, 17, 11, 12, 14, 15
1376
0.42
7
644
3786
238.4
149.234
7 Parabolic Minimum
1, 2, 3, 5, 7, 8, 10, 11, 12, 13, 14, 4, 6, 16, 18, 9, 20, 17, 15, 19
1698
0.49
6
501
2242
161.2
141.797
8 Parabolic Minimum
2, 3, 5, 8, 10, 11, 12, 13, 14, 6, 1, 17, 4, 7, 19, 20, 9, 15, 16, 18
306
0.36
8
644
3989
248.55
149.156
9 Parabolic Minimum
1, 2, 3, 7, 8, 9, 10, 11, 12, 4, 6, 16, 17, 5, 19, 20, 14, 13, 15, 18
270
0.42
7
580
3108
204.5
144.282
10 Parabolic Minimum
2, 3, 4, 5, 10, 11, 12, 14, 6, 1, 17, 18, 19, 20, 7, 8, 9, 13, 15, 16
1098
0.36
8
738
4906
294.4
146.547
1 Parabolic Summation 1, 2, 3, 4, 5, 6, 7, 8, 9, 10, 11, 12, 13, 14, 15, 16, 17, 18, 19, 20
646
4.00
0
0
0
49.1
127.953
2 Parabolic Summation 1, 2, 3, 4, 5, 6, 7, 8, 9, 10, 11, 12, 13, 14, 15, 16, 17, 18, 19, 20
394
4.00
0
0
0
49.1
131.563
3 Parabolic Summation 1, 2, 3, 4, 5, 6, 7, 8, 9, 10, 11, 12, 13, 14, 15, 16, 17, 18, 19, 20
342
4.00
0
0
0
49.1
129.469
4 Parabolic Summation 1, 2, 3, 4, 5, 6, 7, 8, 9, 10, 11, 12, 13, 14, 15, 16, 17, 18, 19, 20
730
4.00
0
0
0
49.1
133.469
5 Parabolic Summation 1, 2, 3, 4, 5, 6, 7, 8, 9, 10, 11, 12, 13, 14, 15, 16, 17, 18, 19, 20
370
4.00
0
0
0
49.1
126.547
6 Parabolic Summation 1, 2, 3, 5, 6, 7, 8, 9, 10, 11, 12, 4, 14, 15, 16, 17, 13, 19, 20, 18
1448
3.32
3
329
834
90.8
141.828
101
7 Parabolic Summation 1, 2, 3, 4, 5, 6, 7, 8, 9, 10, 11, 12, 13, 14, 15, 16, 17, 18, 19, 20
936
4.00
0
0
0
49.1
136.672
8 Parabolic Summation 1, 2, 3, 4, 5, 6, 7, 8, 9, 10, 11, 12, 13, 14, 15, 16, 17, 18, 19, 20
483
4.00
0
0
0
49.1
130.703
9 Parabolic Summation 1, 2, 3, 4, 5, 6, 7, 8, 9, 10, 11, 12, 13, 14, 15, 16, 17, 18, 19, 20
240
4.00
0
0
0
49.1
128.688
10 Parabolic Summation 1, 2, 3, 4, 5, 6, 7, 8, 9, 10, 11, 12, 13, 14, 15, 16, 17, 18, 19, 20
946
4.00
0
0
0
49.1
137.141
1 Parabolic Hybrid
1, 2, 3, 4, 5, 6, 7, 8, 9, 10, 11, 12, 13, 14, 15, 16, 17, 18, 19, 20
512
8.00
0
0
0
49.1
135.141
2 Parabolic Hybrid
1, 2, 3, 4, 5, 6, 7, 8, 9, 10, 11, 12, 13, 14, 15, 16, 17, 18, 19, 20
405
8.00
0
0
0
49.1
130.437
3 Parabolic Hybrid
1, 2, 3, 4, 5, 6, 7, 8, 9, 10, 11, 12, 13, 14, 15, 16, 17, 18, 19, 20
473
8.00
0
0
0
49.1
131.203
4 Parabolic Hybrid
1, 2, 3, 4, 5, 6, 7, 8, 9, 10, 11, 12, 13, 14, 15, 16, 17, 18, 19, 20
290
8.00
0
0
0
49.1
134.562
5 Parabolic Hybrid
1, 2, 3, 4, 5, 6, 7, 8, 9, 10, 11, 12, 13, 14, 15, 16, 17, 18, 19, 20
1569
8.00
0
0
0
49.1
141.718
6 Parabolic Hybrid
1, 2, 3, 4, 5, 6, 7, 8, 9, 10, 11, 12, 13, 14, 15, 16, 17, 18, 19, 20
333
8.00
0
0
0
49.1
132.078
7 Parabolic Hybrid
1, 2, 3, 4, 5, 6, 7, 8, 9, 10, 11, 12, 13, 14, 15, 16, 17, 18, 19, 20
950
8.00
0
0
0
49.1
138.047
8 Parabolic Hybrid
1, 2, 3, 4, 5, 6, 7, 8, 9, 10, 11, 12, 13, 14, 15, 16, 17, 18, 19, 20
279
8.00
0
0
0
49.1
129.312
9 Parabolic Hybrid
1, 2, 3, 4, 5, 6, 7, 8, 9, 10, 11, 12, 13, 14, 15, 16, 17, 18, 19, 20
273
8.00
0
0
0
49.1
130.156
Data Set 6
10 Parabolic Hybrid
1, 2, 3, 4, 5, 6, 7, 8, 9, 10, 11, 12, 13, 14, 15, 16, 17, 18, 19, 20
501
8.00
0
0
0
49.1
131
1 Linear
Minimum
1, 4, 5, 6, 7, 8, 9, 10, 2, 3, 11, 13, 15, 16, 17, 18, 19, 20, 12, 14
1109
0.75
5
553
2175
170.3
133.656
2 Linear
Minimum
1, 2, 4, 5, 6, 7, 8, 9, 10, 3, 13, 15, 18, 19, 20, 11, 12, 14, 16, 17
686
0.70
6
608
3268
224.95
138.485
3 Linear
Minimum
1, 2, 3, 4, 5, 6, 7, 8, 9, 10, 11, 12, 13, 14, 15, 16, 17, 18, 19, 20
325
1.00
0
0
0
61.55
113.25
4 Linear
Minimum
1, 2, 4, 6, 7, 9, 10, 11, 3, 8, 13, 14, 15, 5, 19, 20, 16, 12, 17, 18
684
0.65
7
782
3119
217.5
137.078
5 Linear
Minimum
1, 2, 4, 5, 6, 7, 3, 11, 13, 14, 15, 17, 18, 19, 20, 8, 9, 10, 12, 16
616
0.66
6
775
3868
254.95
140.828
6 Linear
Minimum
1, 2, 4, 5, 6, 7, 8, 10, 3, 13, 16, 18, 19, 20, 9, 15, 11, 12, 14, 17
826
0.65
7
777
4587
290.9
140.641
7 Linear
Minimum
1, 2, 3, 4, 5, 6, 7, 9, 11, 13, 15, 17, 18, 20, 8, 19, 10, 12, 16, 14
1972
0.66
6
775
3219
222.5
135.985
8 Linear
Minimum
1, 2, 3, 4, 5, 6, 7, 8, 9, 10, 11, 12, 13, 14, 15, 16, 17, 18, 19, 20
1444
1.00
0
0
0
61.55
136
9 Linear
Minimum
1, 3, 4, 5, 9, 10, 14, 15, 16, 2, 19, 20, 13, 18, 6, 7, 8, 12, 11, 17
449
0.55
9
1003
6892
406.15
139.5
10 Linear
Minimum
1, 2, 3, 4, 5, 6, 7, 8, 9, 10, 11, 12, 13, 14, 15, 16, 17, 18, 19, 20
870
1.00
0
0
0
61.55
122.141
1 Linear
Summation 1, 2, 3, 4, 5, 6, 7, 8, 9, 10, 11, 12, 13, 14, 15, 16, 17, 18, 19, 20
468
4.00
0
0
0
61.55
124.531
2 Linear
Summation 1, 2, 3, 4, 5, 6, 7, 8, 9, 10, 11, 12, 13, 14, 15, 16, 17, 18, 20, 19
1997
3.90
1
97
97
66.4
141.25
3 Linear
Summation 1, 2, 3, 4, 5, 6, 7, 8, 9, 10, 11, 12, 13, 14, 15, 16, 17, 18, 19, 20
338
4.00
0
0
0
61.55
124.781
4 Linear
Summation 1, 2, 3, 4, 5, 6, 7, 8, 9, 10, 11, 12, 13, 14, 15, 16, 17, 18, 19, 20
686
4.00
0
0
0
61.55
129.688
5 Linear
Summation 1, 2, 3, 4, 5, 6, 7, 8, 9, 10, 11, 12, 13, 14, 15, 16, 17, 18, 19, 20
686
4.00
0
0
0
61.55
128.203
102
6 Linear
Summation 1, 2, 3, 4, 5, 6, 7, 8, 9, 10, 11, 12, 13, 14, 15, 16, 17, 18, 19, 20
527
4.00
0
0
0
61.55
129.359
7 Linear
Summation 1, 2, 3, 4, 5, 7, 8, 9, 6, 12, 13, 10, 11, 16, 17, 18, 19, 20, 14, 15
1803
3.51
5
387
1602
141.65
144.656
8 Linear
Summation 1, 2, 3, 4, 5, 6, 7, 8, 9, 10, 11, 12, 13, 14, 15, 16, 17, 18, 19, 20
235
4.00
0
0
0
61.55
122.11
9 Linear
Summation 1, 2, 3, 4, 5, 6, 7, 8, 9, 10, 11, 12, 13, 14, 15, 16, 17, 18, 19, 20
352
4.00
0
0
0
61.55
126.469
10 Linear
Summation 1, 3, 4, 5, 6, 7, 2, 9, 10, 11, 12, 13, 8, 15, 16, 17, 18, 19, 20, 14
1872
3.63
3
388
1161
119.6
143.344
1 Linear
Hybrid
1, 2, 3, 4, 5, 6, 7, 8, 9, 10, 11, 12, 13, 14, 15, 16, 17, 18, 19, 20
251
8.00
0
0
0
61.55
124.407
2 Linear
Hybrid
1, 2, 3, 4, 5, 6, 7, 8, 9, 10, 11, 12, 13, 14, 15, 16, 17, 18, 19, 20
996
8.00
0
0
0
61.55
133.438
3 Linear
Hybrid
1, 2, 3, 4, 5, 6, 7, 8, 9, 10, 11, 12, 13, 14, 15, 16, 17, 18, 19, 20
847
8.00
0
0
0
61.55
132.75
4 Linear
Hybrid
1, 2, 3, 4, 5, 6, 7, 8, 9, 10, 11, 12, 13, 14, 15, 16, 17, 18, 19, 20
421
8.00
0
0
0
61.55
127.922
5 Linear
Hybrid
1, 2, 3, 4, 5, 6, 7, 8, 9, 10, 11, 12, 13, 14, 15, 16, 17, 18, 19, 20
414
8.00
0
0
0
61.55
125.968
6 Linear
Hybrid
1, 2, 3, 4, 5, 6, 7, 8, 9, 10, 11, 12, 13, 14, 15, 16, 17, 18, 19, 20
321
8.00
0
0
0
61.55
128.734
7 Linear
Hybrid
1, 2, 3, 4, 5, 6, 7, 8, 9, 10, 11, 12, 13, 14, 15, 16, 17, 18, 19, 20
348
8.00
0
0
0
61.55
129.391
8 Linear
Hybrid
1, 2, 3, 4, 5, 6, 7, 8, 9, 10, 11, 12, 13, 14, 15, 16, 17, 18, 19, 20
1616
8.00
0
0
0
61.55
152.656
9 Linear
Hybrid
1, 2, 3, 4, 5, 6, 7, 8, 9, 10, 11, 12, 13, 14, 15, 16, 17, 18, 19, 20
513
8.00
0
0
0
61.55
130.578
10 Linear
Hybrid
1, 2, 3, 4, 5, 6, 7, 8, 9, 10, 11, 12, 13, 14, 15, 16, 17, 18, 19, 20
292
8.00
0
0
0
61.55
131.234
1 Parabolic Minimum
1, 2, 3, 4, 5, 6, 7, 8, 9, 10, 11, 12, 13, 14, 15, 16, 17, 20, 19, 18
1982
0.81
2
139
236
73.35
137.703
2 Parabolic Minimum
1, 2, 3, 4, 5, 6, 7, 8, 9, 10, 11, 12, 13, 14, 15, 16, 17, 18, 19, 20
1406
1.00
0
0
0
61.55
134.61
3 Parabolic Minimum
1, 2, 3, 4, 5, 6, 7, 8, 9, 10, 11, 12, 13, 14, 15, 16, 17, 18, 19, 20
317
1.00
0
0
0
61.55
116.203
4 Parabolic Minimum
1, 2, 3, 4, 5, 6, 7, 8, 9, 10, 11, 12, 13, 14, 15, 16, 17, 18, 19, 20
976
1.00
0
0
0
61.55
125.718
5 Parabolic Minimum
1, 2, 3, 4, 5, 6, 7, 8, 9, 10, 11, 12, 13, 14, 15, 16, 17, 18, 19, 20
164
1.00
0
0
0
61.55
119.516
6 Parabolic Minimum
1, 2, 3, 4, 5, 6, 7, 8, 9, 10, 11, 12, 13, 14, 15, 16, 17, 18, 19, 20
358
1.00
0
0
0
61.55
116.094
7 Parabolic Minimum
1, 2, 3, 4, 5, 6, 7, 8, 9, 10, 11, 12, 13, 14, 15, 16, 17, 18, 19, 20
1305
1.00
0
0
0
61.55
130.875
8 Parabolic Minimum
1, 2, 4, 5, 6, 10, 3, 12, 13, 14, 15, 16, 17, 18, 19, 7, 8, 9, 11, 20
1912
0.44
6
778
3857
254.4
153.954
9 Parabolic Minimum
1, 2, 3, 4, 5, 6, 7, 8, 9, 10, 11, 12, 13, 14, 15, 16, 17, 18, 19, 20
404
1.00
0
0
0
61.55
121.047
10 Parabolic Minimum
1, 2, 3, 4, 5, 6, 7, 8, 9, 10, 11, 12, 13, 14, 15, 16, 17, 18, 19, 20
1469
1.00
0
0
0
61.55
133.516
1 Parabolic Summation 1, 2, 3, 4, 5, 6, 7, 8, 9, 10, 11, 12, 13, 14, 15, 16, 17, 18, 19, 20
311
4.00
0
0
0
61.55
127.14
2 Parabolic Summation 1, 2, 3, 4, 5, 6, 7, 8, 9, 10, 11, 12, 13, 14, 15, 16, 17, 18, 19, 20
774
4.00
0
0
0
61.55
140.047
3 Parabolic Summation 1, 2, 3, 4, 5, 6, 7, 8, 9, 10, 11, 12, 13, 14, 15, 16, 17, 18, 19, 20
124
4.00
0
0
0
61.55
131.75
4 Parabolic Summation 1, 2, 3, 4, 5, 6, 7, 8, 9, 10, 11, 12, 13, 14, 15, 16, 17, 18, 19, 20
132
4.00
0
0
0
61.55
124.672
103
5 Parabolic Summation 1, 2, 3, 4, 5, 6, 7, 8, 9, 10, 11, 12, 13, 14, 15, 16, 17, 18, 19, 20
266
4.00
0
0
0
61.55
133.765
6 Parabolic Summation 1, 2, 3, 4, 5, 6, 7, 8, 9, 10, 11, 12, 13, 14, 15, 16, 17, 18, 19, 20
534
4.00
0
0
0
61.55
139.704
7 Parabolic Summation 1, 2, 3, 4, 5, 6, 7, 8, 9, 10, 11, 12, 13, 14, 15, 16, 17, 18, 19, 20
329
4.00
0
0
0
61.55
134.234
8 Parabolic Summation 1, 2, 4, 5, 6, 3, 8, 9, 10, 7, 11, 13, 14, 15, 12, 18, 19, 20, 16, 17
1443
3.13
6
303
1373
130.2
150.735
9 Parabolic Summation 1, 2, 3, 4, 5, 6, 7, 8, 9, 10, 11, 12, 13, 14, 15, 16, 17, 18, 19, 20
216
4.00
0
0
0
61.55
130.516
10 Parabolic Summation 1, 2, 3, 4, 5, 6, 7, 8, 9, 10, 11, 12, 13, 14, 15, 16, 17, 18, 19, 20
600
4.00
0
0
0
61.55
138.406
1 Parabolic Hybrid
1, 2, 3, 4, 5, 6, 7, 8, 9, 10, 11, 12, 13, 14, 15, 16, 17, 18, 19, 20
498
8.00
0
0
0
61.55
140.297
2 Parabolic Hybrid
1, 2, 3, 4, 5, 6, 7, 8, 9, 10, 11, 12, 13, 14, 15, 16, 17, 18, 19, 20
315
8.00
0
0
0
61.55
135.406
3 Parabolic Hybrid
1, 2, 3, 4, 5, 6, 7, 8, 9, 10, 11, 12, 13, 14, 15, 16, 17, 18, 19, 20
1017
8.00
0
0
0
61.55
146.766
4 Parabolic Hybrid
1, 2, 3, 4, 5, 6, 7, 8, 9, 10, 11, 12, 13, 14, 15, 16, 17, 18, 19, 20
1663
8.00
0
0
0
61.55
156.781
5 Parabolic Hybrid
1, 2, 3, 4, 5, 6, 7, 8, 9, 10, 11, 12, 13, 14, 15, 16, 17, 18, 19, 20
338
8.00
0
0
0
61.55
131.954
6 Parabolic Hybrid
1, 2, 3, 4, 5, 6, 7, 8, 9, 10, 11, 12, 13, 14, 15, 16, 17, 18, 19, 20
528
8.00
0
0
0
61.55
139.828
7 Parabolic Hybrid
1, 2, 3, 4, 5, 6, 7, 8, 9, 10, 11, 12, 13, 14, 15, 17, 18, 19, 20, 16
1909
7.70
1
221
221
72.6
148.141
8 Parabolic Hybrid
1, 2, 3, 4, 5, 6, 7, 8, 9, 10, 11, 12, 13, 14, 15, 16, 17, 18, 19, 20
1184
8.00
0
0
0
61.55
148.156
9 Parabolic Hybrid
1, 2, 3, 4, 5, 6, 7, 8, 9, 10, 11, 12, 13, 14, 15, 16, 17, 18, 19, 20
311
8.00
0
0
0
61.55
140.468
10 Parabolic Hybrid
1, 2, 3, 4, 5, 6, 7, 8, 9, 10, 11, 12, 13, 14, 15, 16, 17, 18, 19, 20
453
8.00
0
0
0
61.55
139.172