www.ValueInvestingCongress.com
8th annual Spring value investing congress •
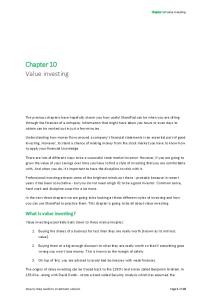
May 7, 2013 • Las Vegas, NV Dumb and Dumber Zeke Ashton, Centaur Capital Partners
Join us for the 9th Annual New York Value Investing Congress!
To register and benefit from a special discount go to www.ValueInvestingCongress.com/SAVE
Learning From Mistakes Value Investing Congress – May 2013
Zeke Ashton Centaur Capital Partners
Legal Disclaimer THIS PRESENTATION IS FOR INFORMATIONAL AND EDUCATIONAL PURPOSES ONLY AND IS NOT INTENDED AS INVESTMENT ADVICE. NOTHING CONTAINED HEREIN SHALL CONSTITUTE A SOLICITATION, RECOMMENDATION OR ENDORSEMENT TO BUY OR SELL ANY SECURITY OR OTHER FINANCIAL INSTRUMENT. INVESTMENT FUNDS MANAGED BY CENTAUR CAPITAL PARTNERS (“CCP”) MAY OWN STOCK IN THE COMPANIES DISCUSSED IN THIS PRESENTATION. CCP HAS NO OBLIGATION TO UPDATE THIS INFORMATION AND THE VIEWS EXPRESSED IN THIS PRESENTATION ARE SUBJECT TO CHANGE. WE MAKE NO REPRESENTATION OR WARRANTIES AS TO THE ACCURACY, COMPLETENESS OR TIMELINESS OF THE INFORMATION, TEXT, GRAPHICS OR OTHER ITEMS CONTAINED IN THIS PRESENTATION. WE EXPRESSLY DISCLAIM ALL LIABILITY FOR ERRORS OR OMISSIONS IN, OR THE MISUSE OR MISINTERPRETATION OF, ANY INFORMATION CONTAINED IN THIS PRESENTATION.
2
About Centaur Capital Partners
Founded in 2002; based in Southlake, TX
Centaur specializes in value-oriented investing strategies based on fundamental securities research and analysis
The Centaur investment process emphasizes risk-averse, reliable returns.
Investment advisor to the Centaur Value Fund Long/Short (long-biased) private investment partnership Launched in 2002
Portfolio manager for Tilson Dividend Fund (TILDX) Launched in 2005 Long-only equity strategy that seeks to identify undervalued equities and emphasizes income through dividends & covered call options 3
Centaur Value Fund Cumulative Returns Value of $100,000 Invested at Inception $400,000
Net Profit of $294,766 $350,000
$300,000 Centaur Value Fund S&P 500
$250,000
$200,000
Net Profit of $113,383 $150,000
$100,000
$50,000
2002
2003
2004
2005
2006
2007
2008
2009
2010
2011
2012
2013
*Returns shown through 3/31/13 4
Mistakes are Inevitable
5
Thoughts on Mistakes
“We are trying to make new and interesting mistakes, not the same stupid
“ Agonizing over errors is a mistake. But acknowledging them and analyzing them can be useful” - Warren Buffett
Just when I thought you couldn’t possibly be any dumber, you go out and do something like this … and totally redeem yourself!” – Harry, after Lloyd trades the van for a moped
ones over and over again.” - Jeffrey Bronchik, Cove Street Capital
6
Categories of Mistakes
Emotional
Analytical
EXAMPLES Shiny New Toy Beer Goggles Attack of the Analysts
EXAMPLES Trailing 12 Month Mirage Hubble Effect The Missing Link
7
Shiny New Toy
8
Shiny New Toy
“This is the best investment ever” syndrome
Similar to infatuation one gets on a first date
Causes chronic over-sizing of new ideas in the portfolio.
Over-weighting of positive attributes; the negative attributes and risk factors often take time to make themselves known.
We have learned that the most dangerous idea in the portfolio is often the newest.
“You never really know a stock until you’ve owned it for a year.”
9
Beer Goggles
10
Beer Goggles
Often occurs when good ideas are difficult to find
Typically stems from pressure to keep up with a rising market
Relaxing of standards and discipline
Results in sub-standard ideas entering the portfolio
Stocks that looked ugly 6 months ago look like beauty queens when you start to get desperate for ideas.
Can also result in holding on to ideas that should be monetized due to concerns about being under-invested. 11
Attack of the Analysts
12
Attack of the Analysts
This occurs when you make what you think is a good investment decision
Negative sentiment becomes overwhelming
Sell-side analysts downgrade the stock and compete with each other to invent the worst possible scenario.
Idea is pounded in the press; your own investors tell you it’s stupid.
You finally give in and sell at the worst possible time, and you look up 24 months later and the stock has doubled. 13
Trailing Twelve Month Mirage Lloyd: What the hell are we doing here, Harry? We’ve gotta get out of this town! Harry: Oh yeah, and go where? Where are we gonna go? Lloyd: I’ll tell you where. Someplace warm. A place where the beer flows like wine. Where beautiful women instinctively flock like salmon of Capistrano. I’m talking about a little place called Aspen. Harry: Oh, I don’t know, Lloyd. The French are so annoying.
14
Trailing Twelve Month Mirage
Caused by the standard investor convention of putting earnings multiples in “trailing twelve month” context.
For many businesses, the TTM may be a good approximation of earnings power. But it should never be assumed.
Be especially careful valuing variable and cyclical businesses.
Professional athletes have “career years.” Businesses have “perfect storms.”
Our research template usually starts with a 10 year financial table so that we can see a fuller history of the business. 15
TTM Mirage Case Study: RAIL 2007 Year
Revenue
Net Inc
OCF
FCF
2001
$210.3
($3.5)
$8.5
$6.3
2002
$225.5
($8.6)
$3.8
$3.2
2003
$244.3
($7.4)
$18.4
$18.0
2004
$482.2
($24.9)
($0.6)
($2.8)
2005
$927.2
$45.4
$65.8
$58.3
2006
$1,444.8
$128.7
$154.2
$147.3
2007
$817.0
$26.5
$41.4
$35.3
2008
$746.4
$4.6
($23.1)
($30.1)
2009
$248.5
$4.9
$22.9
$18.6
16
RAIL Stock Chart 2005-2013
17
The Hubble Effect
18
Occupational Hazards of DCF Models
“If you change the assumptions even a little bit, you can end up in a whole new galaxy.”
Discounted Cash Flow analysis is a very useful tool, but limitations must be acknowledged. Best to use DCF as a sanity check and “what-if” scenario generator.
Occupational Hazards of DCF models
DCF assumes all generated cash is returned to investors If cash isn’t returned to investors, consideration must be given to the uses of that cash. It is easy to anchor on a DCF number “False precision” and illusion of rigor 19
The Missing Link
20
The Missing Link
Often occurs in net asset value or “sum-of-the-parts” analysis Particularly common when valuing natural resource & real estate companies But can also easily happening when valuing companies with multiple business units.
Missing Variables from Analysis: Time Delta between asset inflation and investor hurdle rate Frictional Costs (taxes, costs to develop assets) Operating Costs and Management Comp (value leakage)
We often apply a multiple to corporate overhead as part of our sumof-the-parts and NAV analysis. We tend to use a multiple of 5-9X 21
Missing Link Case Study: JOE Late 2009
Enterprise Value of ~$2.5 billion Bull argument: 585,000 acres, implied EV / acre of ~$4,300 35,000 acres surrounding new airport development at $60K per acre = $2.1 billion; Coming real estate recovery and low borrowing costs
Missing Variables from Analysis:
50-75 years that will be required to sell down assets. JOE needed to spend money on development Corporate expenses were ~$25 million / year Delta between assumed 3% inflation rate and 10% hurdle rate over 50 years 22
JOE: How the Math Works
Enterprise Value of $2.5 billion 585,000 acres JOE sells 11,700 acres / year for 50 years Let’s pretend they get $10K / acre in Year 1 and every year thereafter they get an inflation-adjusted $10K We used 3% for inflation. First year revenue: $117 million Year 50 revenue: $498 million We assume zero operating costs and zero taxes BUT……….. We discounted back the resulting revenue at 10% rate Results in EV of $1.6 billion ($17.50 stock price on 92M shares ) NOTE: We have no investment opinion on JOE. This is just a mathematical thought experiment to illustrate the Missing Link 23
JOE Stock Chart 2008 -2013
24
Final Thoughts on Mistakes QUESTIONS TO CONSIDER
Do you have a defined process for making decisions? Do you analyze your bad outcomes to pinpoint possible mistakes? Do your mistakes tend to fall on the emotional side or the analytical side most often?
ACTIONS TO CONSIDER
Finalize research / make initial new major purchase decisions outside market hours. For each stock you own, indicate a price at which the next action should be taken or contemplated (add, trim, or sell). For each stock you have researched, indicate a price at which you would consider taking action (i.e., “trigger price”) Make an effort to differentiate process and outcome. Not all bad outcomes are due to mistakes. Accept mistakes as part of the learning process. 25
Intriguing Play on a Real Estate Recovery
A lower-risk way to play the real estate recovery Title insurers are almost like a royalty on real estate activity. Rational industry with only four major players Top two players comprise 60% market share and ~80% profit share. Title companies are leveraged to both increases in volume and increases in prices. Also provide escrow services, closing documentation, and other real estate-related services. Title insurers get paid on virtually every real estate transaction in the United States
Mortgage Refinancing - $1,000 avg. premium Home sale (new homes or existing) - $2,000 avg. premium Commercial property ($7,800 avg. premium) 26
A Low-Risk Real Estate Investment US Title Insurance Industry – Market Share
Source: ALTA Nine Months 2012 27
The Tale of the Tape
Market and valuation data as of May 2, 2013
28
Which One Is Better?
FAF is more of a pure-play on title insurance / escrow FNF has a side business of LBO-type investments (restaurants, Remy auto parts, Ceridian, timber, etc). FNF has historically been the industry profitability leader. FAF is improving operating efficiency and is a strong #2. Importantly, neither carries leverage typical of most real estate investment vehicles at insurance subsidiaries. FNF has significant leverage in its private equity portfolio companies. FAF is a leader in international title insurance, which is starting to become more common outside the U.S. My preference currently is for FAF; but I expect that both will work out if real estate transaction volumes and prices improve. 29
Zeke Ashton
Centaur Capital Partners
Q&A