34
3 Interpretation and first applications of derivatives and integrals 3.1 Average rates of change, instantaneous rates of change and derivatives The average rate of change of a function Textbook: Section 2.3 To introduce this concept, let’s look at an example involving average speed. The average speed at which an object travels, over a given time interval, is given by the formula average speed =
distance travelled in the time interval . the length of the time interval
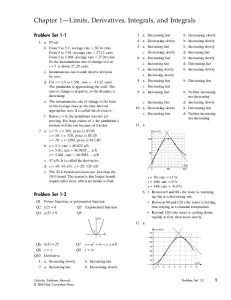
Example 3.1.1. The following graph represents the distance s(t) in metres of a cheetah from her starting point as she runs down a gazelle, where time t is measured in seconds. y 40
y = s(t)
30 20 10 t 1
2
3
4
5
6
Estimate: (a) the average speed of the cheetah as t varies from 0 to 3 seconds
(b) the average speed of the cheetah as t varies from 3 to 5 seconds
(c) the average speed of the cheetah as t varies from 4 to 6 seconds.
Remark 3.1.2. We have computed the average speed of the cheetah over various time intervals. Since speed is the rate of change of s(t), this is the same as the average rate of change of s(t) over the given time intervals.
35 Definition 3.1.3. Let y = f (x) and fix two different points x1 and x2 so that f (x1 ) and f (x2 ) are both defined. Also, set y1 = f (x1 ) and y2 = f (x2 ). The average rate of change of y with respect to x as x varies from x1 to x2 is defined to be y2 − y1 . x2 − x1
This is also referred to as the average rate of change of f (x) as x varies from x1 to x2 .
Observe that the average rate of change of f (x) as x varies from x1 to x2 is the same as the slope of the straight line joining the points (x1 , f (x1 )) and (x2 , f (x2 )).
Example 3.1.4. Compute the average rate of change of f (x) = 21 x2 + 1 as x varies from −2 to 1.
Warning. A common mistake is to think that the word “average” in “average rate of change” means that to find the average rate of change of a function, you should compute various numbers which have something to do with rate of change, find their sum and then divide by how many numbers you have chosen. This is wrong. You should only find the average rate of change by using the formula at the top of this page.
36 Instantaneous rates of change and the derivative Textbook: Section 2.6 To contrast the idea of the instantaneous rate of change of a function with the average rate of change, let’s think about the cheetah example again. In this context, the average rate of change is the average speed over a time interval, and the instantaneous rate of change is the speed at a given instant of time. Example 3.1.5. The following graph represents the distance s(t) in metres of a cheetah from her starting point as she runs down a gazelle, where time t is measured in seconds. y 40
y = s(t)
30 20 10 t 1
2
3
4
Estimate the speed of the cheetah at t = 2 seconds.
5
6
37 The discussion in the previous example should hopefully convince you that the instantaneous rate of change of a function f (x) at an x-value x1 should be what you get by taking the average rate of change as x varies from x1 to x2 , and letting x2 get closer and closer to x1 .
Definition 3.1.6. If f (x) is a function and x1 is a fixed x-value, then the instantaneous rate of change of f (x) at x = x1 is defined to be f ′ (x1 ). Definition 3.1.7. If f (x) is a function, then the rate of change of f (x) or the instantaneous rate of change of f (x) is defined to be f ′ (x). If we need to make it clear which variable we have to differentiate with respect to, we will talk about the rate of change of f (x) with respect to x. Example 3.1.8. What is the rate of change of f (x) =
−x3 + 4x at x = 1? 5
Example 3.1.9 (Textbook, Exercise 2.6.11). The circumference C, in centimetres, of a healing wound is given by C(r) = 2π r where r is the radius of the wound in centimetres. What is the rate of change of the circumference with respect to the radius?
38 Yet another name for the derivative of a quantity is the “growth rate”. Example 3.1.10 (Textbook, Exercise 2.6.18). The population of a city grows from an initial size of 100, 000 to a population of P(t) = 100,000 + 2000t 2 after t years. (a) Find a formula for the growth rate after t years.
(b) Find the population of the city after 10 years.
(c) What is the growth rate after 10 years?
3.2 Using antiderivatives to find populations from growth rates Textbook: Section 5.1 If we know the growth rate of a population and the initial population, then we can calculate the value of the population at any time. We can do this by antidifferentiation, and using the initial population to find the value of the constant of integration C. Example 3.2.1. Suppose that a city has P(t) inhabitants after t years, an initial population of 100,000 and a population growth rate of P′ (t) = 4000t. Find a general formula for P(t) and use this to find the population of the city after 10 years.
39
3.3 Accumulated changes and definite integrals Textbook: Section 5.2 The definite integral over an interval of the rate of change of a quantity can be interpreted as the change in the value of that quantity—that is, the difference between the final value from the initial value. To put this in symbols: if F(x) is a quantity of interest and we know F ′ (x), then we can find the change in F(x) as Z x varies from x1 to x2 , that is, F(x2 ) − F(x1 ), by x2
computing the definite integral
x1
F ′ (x) dx. This is because by the FTC2,
change in value of F(x) = F(x2 ) − F(x1 ) =
Z x2 x1
F ′ (x) dx.
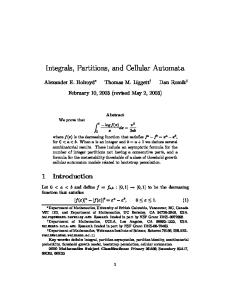
Because a definite integral represents the net signed area under a graph, this gives us a way to estimate F(x2 ) − F(x1 ) directly from the graph y = F ′ (x). Example 3.3.1. A scientist measures the rate of blood flow b′ (t) along a child’s aorta, in millilitres per second, where t is time in seconds and b(t) is the total volume of blood that has flowed through the aorta time t. This graph illustrates the results over the course of a single heartbeat:
40
y
30 y = b′ (t)
20 10
0.2
0.4
0.6
0.8
1.0
t
Estimate the volume of blood passing through the aorta between t = 0 and t = 1.
40
3.4 The average value of a function Textbook: Section 5.3 Definition 3.4.1. The average value of a function f (x) as x varies from x = a to x = b is Z b 1 yav = f (x) dx. b−a a
Example 3.4.2. Find the average value of the function f (x) = x2 + 1 as x varies between −2 and 5.
Example 3.4.3. The population of a city grows from an initial size of 100, 000 to a population of P(t) = 100,000 + 2000t 2 after t years. Find the average population of the city over the first 10 years.
Warning. The average value of a function is different to the average of some numbers. You should only find the average value of a function by using the integral formula in Definition 3.4.1.