LIETUVOS EKONOMIKOS TYRIMAS 2004/2005 (2)
A SURVEY OF THE LITHUANIAN ECONOMY 2004/2005 (2)
Vilnius 2005
2
Parengė/Prepared by: Monika Kačinskienė
Išversta/Translated by: Aneta Piasecka Asta Tobulevičienė Monika Kačinskienė Projektą finansuoja/Funded by: „Constructus“ „Mažeikių nafta“ prekybos namai „Ragutis“ „Rimi Lietuva“ „Tamro“ „VST“
3
Lietuvos laisvosios rinkos institutas Lithuanian Free Market Institute
4
© Lietuvos laisvosios rinkos institutas ISSN 1648 - 4673
5
TURINYS
CONTENTS
ĮŽANGA ...............................................................6
INTRODUCTION .............................................42
1 skyrius. MAKROEKONOMIKA ...................8
Part 1. MACROECONOMICS .....................44
1.1. Spartesnį šalies ekonomikos augimą stabdo reformų trūkumas ..................................8 1.1.1. Pasaulio ekonomikos augimas ...........10 1.1.2. Šešėlinė ekonomika ...........................12 1.2. Importas ir eksportas ................................14 1.3. Vartotojų ir gamintojų kainos auga sparčiau .......................................16 1.4. Nedarbo rodiklius toliau mažina ekonomikos augimas ir emigracija ..................19 1.5. Mokesčių našta didės ...............................22 1.6. Litas ir JAV doleris ...................................24
1.1. Economic growth will slow down this year .................................................44 1.1.1. The world economic growth .............46 1.1.2. The shadow economy ........................48 1.2. Export is growing faster than import again ................................................................50 1.3. A bigger price increase expected this year ..........................................................52 1.4. Unemployment is falling steadily .............57 1.5. The tax burden will increase .....................59 1.6. The litas and the US dollar .......................62
2 skyrius. NAMŲ ŪKIAI .................................25
Chapter 2. HOUSEHOLDS ..........................63
2.1. Namų ūkių auga lėtai, bet tolygiai ............25 2.2. Darbo užmokestis augo labai nežymiai ....27 2.3. Namų ūkiai šiemet turėtų drąsiau investuoti, dalį pinigų vis dar ir sutaupyti .......29
2.1. Household income is growing slowly but steadily .....................................................63 2.2. Earnings grew negligibly ..........................65 2.3. Household will invest and save more this year .........................................67
3 skyrius. ĮMONIŲ FINANSAI IR INVESTICIJOS ...........................................32 3.1. Įmonių finansiniai rodikliai stabilūs ir po truputį gerėja ...........................................32 3.2. Investicijoms skiriama pelno dalis mažėja ..32
4 skyrius. PINIGAI ..........................................34
Chapter 3. CORPORATE FINANCES AND INVESTMENTS .....................................70 3.1. Financial indicators are stable ..................70 3.2. The share of reinvested profits is falling ..........................................................71
4.1. Skola auga, VVP pelningumas dar mažėjo .......................................................34 4.2. Skolinimosi kaina stabilizavosi, skolinimasis ir toliau auga ...............................35 4.3. Taupymas auga lėtai .................................36
Chapter 4. MONEY ........................................72
IŠVADOS ..........................................................38
CONCLUSIONS ..............................................76
TYRIMO EKSPERTAI .....................................80
SURVEY PARTICIPANTS..............................80
4.1. Yield on government securities fell ..........72 4.2. Interest on loans has stabilised and borrowing continues to grow ....................73 4.3. The growth of savings declined ................74
6
ÁÞANGA
ĮŽANGA Lietuvos laisvosios rinkos institutas (LLRI) pristato penkioliktąjį Lietuvos ekonomikos tyrimą, kuriame pateikiami rinkos dalyvių 2004 m. ekonomikos rodiklių vertinimai ir patikslintos prognozės 2005-iesiems. Šis tyrimas buvo atliktas 2005 m. sausio-vasario mėnesiais. LLRI tyrimas buvo pradėtas 1997 m. Jis remiasi rinkos dalyvių sutarimo paradigma, grindžiama racionalių lūkesčių teorija.1 Ši teorija teigia, kad ekonominis kintamasis gali būti siejamas su pastebimais procesais, o rinkos dalyviai formuoja savo vertinimus ir prognozes, susijusias su šiais procesais, panaudodami visą jiems prieinamą informaciją. Vertinimai ir prognozės yra tuo patikimesni, kuo daugiau informacijos turi rinkos dalyviai. Tikėtina, kad daugiausia informacijos apie ekonomikos procesus turi asmenys, nuolat naudojantys ją savo tiesioginėje veikloje, o jų veiklos sėkmė atspindi informacijos apdorojimo gebėjimus. Pagrindinis LLRI tyrimo tikslas – pateikti Lietuvos ekonomikos rodiklių vertinimus ir prognozes, paremtas rinkos dalyvių nuomone, apžvelgti veiksnius, galėjusius turėti įtakos respondentų vertinimams ir lūkesčiams. Šiuo tyrimu taip pat siekiama palyginti rinkos dalyvių vertinimus su oficialių institucijų ir kitų šaltinių duomenimis, pateikti ryškesnių skirtumų interpretacijas. LLRI tyrimas yra grindžiamas kitokia metodologija nei oficiali statistika, tad juo siekiama pateikti alternatyvius ekonomikos rodiklių vertinimus ir prognozes. LLRI tyrimas skiriasi nuo oficialios statistikos trimis esminiais aspektais. Pirma, LLRI tyrimo metu pagrindinius apibendrinimus daro patys rinkos dalyviai, tuo tarpu Lietuvos Statistikos departamentas (SD) iš verslo aplinkos renka unikalią, neapibendrintą informaciją, kurią vėliau apibendrina statistiniais metodais. Antra, LLRI tyrimas remiasi geranorišku rinkos dalyvių dalyvavimu vertinant rinkos procesus, o SD
1
gauna iš įmonių privalomas detalias ataskaitas (namų ūkiai gali atsisakyti dalyvauti tyrime). Trečia, LLRI tyrimo metu nagrinėjami laisvai pasirinkti rodikliai, o jų apibrėžimus lemia jų nauda planuojant ekonominę veiklą. SD tiria privalomą rodiklių sąrašą pagal suderintą metodiką. Be to, LLRI parenka įvairiapusišką informaciją ir operatyviai pateikia tyrimo rezultatus. Šios prielaidos leidžia tikėtis, kad LLRI tyrimas turi praktinę vertę rinkos dalyviams. Rinkos dalyvių prognozės pateikiamos 4 skyriuose. Pirmasis skyrius nagrinėja bendrojo vidaus produkto (BVP) augimą, šešėlinės ekonomikos dalį BVP, importo ir eksporto augimą, vartojimo ir gamintojų kainų pokyčius, nedarbo lygį, mokesčių naštos dydį nuo BVP ir prognozuojamą lito ir JAV dolerio kursą. Antrajame skyriuje aptariami namų ūkių rodikliai: darbo užmokestis, namų ūkių pajamos bei investicijoms ir santaupoms skiriamos pajamų dalys. Trečiasis skyrius yra skirtas įmonių rodikliams: įmonių pelningumui, nuosavo kapitalo grąžai ir investicijoms, mokslui ir inovacijoms skiriamai išlaidų daliai. Ketvirtame skyriuje pristatome skolinimosi 1 ir 5 metams litais kainą, 3 mėnesių trukmės VVP pelningumą bei ne bankų paskolų rinkos dalį. Kiekvieno skyriaus pabaigoje lentelėje pateikiami apibendrinti tyrimo rezultatai. Šioje apklausoje dalyvavo 42 ekspertai. Respondentų atranka nėra reprezentacinė: tyrimo dalyviai neskirstomi pagal jų atstovaujamas veiklos rūšis, įmones ar regionus – dalyvauti apklausoje kviečiami sėkmingai dirbančių įmonių darbuotojai. Respondentai prašomi nurodyti ne atstovaujamos įmonės ar šakos rodiklius, bet bendras šalies realijas atitinkančias reikšmes, remdamiesi visa jiems prieinama informacija. Reikia paminėti, kad apklausos respondentų prašome nurodyti tik tų rodiklių vertinimus ir prognozes, kuriuos, jų nuomone, jie gali įvertinti. Dauguma šios apklausos respondentų dalyvavo LLRI tyrime ir anksčiau. Apklausos dalyvių sąrašas pateikiamas knygos pabaigoje.
Vienas žinomiausių ekspertų sutarimo paradigma grindžiamų tyrimų yra nuo 1946 m. JAV atliekamas “Livingston” tyrimas. Jo rezultatai reguliariai skelbiami Filadelfijos Federalinio Rezervo banko interneto puslapyje http://www.phil.frb.org.
ÁÞANGA Apibendrintos LLRI tyrimo dalyvių prognozės yra lyginamos su oficialių Lietuvos ir tarptautinių institucijų, taip pat privačių finansų įstaigų prognozėmis. Lyginant rodiklius atsižvelgiama į apibrėžimų skirtumus. Reikia atkreipti dėmesį, kad kai kurie iš LLRI tyrimo rodiklių – šešėlinė ekonomika, namų ūkių investicijos, įmonių investuojamo pelno dalis, įmonių išlaidų dalis mokslui ir inovacijoms ir ne bankų paskolų rinkos dalis – nėra nagrinėjami arba yra nereguliariai tiriami oficialių institucijų. Be to, oficialios institucijos nepateikia daugelio rodiklių prognozių. Tad LLRI tyrimo rezultatai yra šia prasme unikalūs.
7 Kaip ir anksčiau, ekspertų vertinimai ir prognozės lyginami ne tik su kitais šaltiniais, bet ir su jų anksčiau pateiktomis prognozėmis. Studijoje taip pat nagrinėjamos rinkos dalyvių vertinimų ir prognozių tendencijos remiantis ankstesnių, jau dvylikos apklausų rezultatais. LLRI dėkoja tyrimo dalyviams ir rėmėjams, taip pat visiems, suteikusiems pastabų ir pasiūlymų.
8
1 skyrius. MAKROEKONOMIKA 1.1. Spartesnį šalies ekonomikos augimą stabdo reformų trūkumas 2005 m. sausio vasario mėnesiais LLRI atlikto tyrimo duomenimis Lietuvos ūkis 2004 metais augo stabiliai, tačiau lėčiau nei 2003 m. Rinkos dalyvių nuomone, 2004 m. Lietuvos bendrasis vidaus produktas (BVP) išaugo 6,8 proc. Manoma, kad 2005 m. šalies ūkio plėtra bus lėtesnė – per šiuos metus Lietuvos ekonomika turėtų augti 6,3 proc. LLRI tyrime bendrasis vidaus produktas suprantamas kaip per tam tikrą laikotarpį galutiniam vartojimui šalies viduje pagamintų prekių ir suteiktų paslaugų vertė, įtraukiant ir šešėlinėje rinkoje sukurtą vertę. LLRI tyrimų rezultatai rodo, kad rinkos dalyvių vertinimai ir lūkesčiai dėl šalies ekonomikos plėtros išlieka gana optimistiniai nors yra santūresni nei anksčiau. Ekspertai beveik nepakeitė savo anksčiau išsakytų 2004 metų ūkio plėtros vertinimų: 2004 m. BVP augimo įvertis – 6,8 proc. - yra tik viena procentine dalimi mažesnis už prieš pusę metų pateiktas prognozes. Kaip ir prognozuota, 2004 m. ūkio augimas išliko spartus; vis dėlto jis smarkiai atsiliko nuo 2003 metų tempų. Nuo 2000 m. bendrasis vidaus produktas, eliminavus sezoninius ir atsitiktinius svyravimus, palyginti su kiekvienu ankstesniu ketvirčiu, nuolat didėjo: per ketvirtį Lietuvos BVP išauga vidutiniškai po 1,8 proc. Ir tarp tyrime dalyvavusių ekspertų, ir tarp oficialių vietos ir tarptautinių institucijų jaučiamas sutarimas, kad Lietuvos BVP augimo ciklas per 2003-2004 m. buvo didžiausias ir šiuo metu stabilizuojasi1. Tyrimo duomenimis, ekonomikos augimą ir toliau lemia vidaus rinkos ir eksporto plėtra (žr. 1.2 skirsnį),
MAKROEKONOMIKA
vartojimas bei po truputį atsigaunančios užsienio investicijos. Rinkos dalyviai palankiai vertino importo ir eksporto augimą 2004 m., ir šiais metais tikisi dar spartesnės tarptautinės prekybos raidos. Dėl besitęsiančios ūkio plėtros ir jos skatinamo nedarbo mažėjimo (žr. skirsnį 1.4) turėtų toliau didėti darbo užmokestis (žr. skirsnį 2.2). O teigiamus lūkesčius skatina ir gana sėkmingi pirmieji narystės Europos Sąjungoje metai. Tarptautiniai ekspertai tvirtina, kad narystė Europos Sąjungoje per kelerius ateinančius metus turėtų paspartinti augimą2. Tačiau kad euras prisidėtų prie šalies ekonomikos plėtros (ekonomistų prognozėmis, ekonomika, įvedus eurą, galėtų augti maždaug 0,2–0,4 proc. greičiau), reikia griežtinti iždo politiką, siekti tolesnio rinkos liberalizavimo, nepasiduoti pagundai ekonomiką skatinti didinant valdžios išlaidas.3 Kita vertus, plėtrą stabdo keli veiksniai: pirmiausia, tai reformų strateginėse srityse nebuvimas, kurį atspindi ir kelerius metus trukęs (bei vargiai ar pasibaigęs) „investicijų badmetis“ 4 . Antra, BVP augimo rodikliams įtaką daro ir gyventojų emigracija, ir ypač augantis kvalifikuotos darbo jėgos trūkumas. Ekonomiką kuria žmonės, todėl masinis jų išvykimas gana greitai pradeda daryti įtaką ir ekonominiams rodikliams. Jau kurį laiką rekordiškai išaugusios ir nemažėjančios naftos kainos dar negalėjo stipriai paveikti nei pasaulio, nei Lietuvos ekonominės plėtros, kadangi kartu su didėjančia naftos paklausa augo ir pasiūla. Tačiau užsienio specialistai perspėja, kad galimybė didinti žaliavos gavybą yra ribota, todėl ir toliau augančios naftos kainos gali tapti grėsme pasaulio ekonomikos plėtrai. Jaučiamą naftos kainų šuolio neigiamą įtaką dalinai atsvėrė didėjanti vidaus paklausa ir augantis eksportas. Kita vertus, augančios naftos kainos dalinai veikė
Paskutiniais Lietuvos statistikos duomenimis, Lietuvos BVP 2003 metais išaugo 9,7 proc., EK išankstiniais skaičiavimais – 8,9 proc. Europos komiteto 2002 m. atlikto tyrimo „Lietuvos integracijos į ES finansinių, ekonominių ir socialinių pasekmių susisteminimas ir analizė“ išvadose teigiama, kad dėl integracijos į ES poveikio Lietuvos BVP 2002-2009 metais augs apie 1,14 proc. sparčiau. 3 Šarkinas R., Balcerovičius L. Žr. ELTA, „Įvedus eurą, ekonomika augs 02-04 procentinio punkto greičiau“, 2005-02-28. 4 Tiesioginės užsienio investicijos (TUI) Lietuvoje 2002-2003 m. sudarė atitinkamai 3818 ir 3967 mln. eurų, o 2004 m. ūgtelėjo iki 4337 mln. Pagal sukauptas TUI vienam žmogui, Lietuva vis dar užima vieną paskutiniųjų vietų ES. 1 2
MAKROEKONOMIKA
9
ekonomikos plėtrą dėl reikšmingo „Mažeikių naftos“ indėlio į Lietuvos BVP. LLRI parengtoje tyrimo medžiagoje ekspertų vertinimai atspindi oficialių vidaus bei tarptautinių institucijų prognozių bendrąsias tendencijas. Tradiciškai santūriau vertinę Lietuvos ūkio augimą, naujausiame tyrime rinkos dalyviai pateikia vertinimus, kurie labai artimi oficialiajai statistikai (žr. 1.1 grafiką). Patikslintais Lietuvos statistikos departamento (SD) duomenimis, per 2004 metus šalies BVP išaugo 6,7 proc. 5. Kaip ir anksčiau, labiausiai padidėjo apdirbamosios gamybos, didmeninės ir mažmeninės prekybos, paslaugų (ypač transporto remonto ir asmeninių bei namų ūkio reikmenų taisymo) pridėtinė vertė (beveik po 11 proc.). Taip pat išaugo transporto, sandėliavimo ir ryšių (9,2 proc.), viešbučių ir restoranų (7,2 proc.) pridėtinė vertė. Sparčiai išaugus pridėtinei vertei 2003 m., o 2004 m. padidėjus statybos sąnaudų kainoms, statybų kainų augimas gerokai sulėtėjo.6 Pridėtinės vertės didėjimas su gamyba susijusiose veiklos rūšyse sudaro vieną iš pagrindinių vartojimo augimo sąlygų7. 1.1 grafikas BVP augimas, proc. 10 8 5,1 6 4 4,9 2 0 -2 -4 -6
9,7 6,5
6,8
4,2
5,2
4 -1,8
7,4
6,7
7,0
6,8
6,3
2,2
-4,2
1998 1999 2000 2001 2002 2003 2004 2005p LLRI tyrimas
LSD, FM
Šaltinis: Lietuvos statistikos departamentas, Lietuvos finansų ministerija, Lietuvos laisvosios rinkos institutas
Finansų ministerija praeitų metų gale sumažino savo BVP prognozes 2004 metams puse procento – iki 6,5 proc. Statistikos departamento ir Finansų ministerijos 2004 m. skelbiamas ex poste įvertis yra 6,7 proc. Taigi LLRI tyrimo dalyvių vertinimai yra tik viena procentine dalimi aukštesni už šiuos oficialiosios šalies statistikos rodiklius. 2005 m. pradžioje tiek Finansų ministerijos specialistai, tiek ir rinkos dalyviai tikėjosi santūresnio ekonomikos augimo šiais metais. Vis dėlto FM 2005 m. balandžio mėnesį paskelbė naujas – daug optimistiškesnes šalies ekonomikos augimo 2005 m. prognozes ir, pakėlusi savo rodiklius 0,5 proc., mano, kad ekonomika augs net 7 proc. O rinkos dalyvių nuomone, ekonomika šiemet turėtų lėtėti dar labiau – jų prognozėmis, augimas šiais metais tesieks 6,3 proc. Palyginti su kitų institucijų prognozėmis, rinkos dalyvių vertinimai yra vidutiniai (žr. 1.1 lentelę). Jie artimi EK, TVF ir „Nordea“ specialistų skelbiamiems rodikliams. Anksčiau pasižymėjusi gan žemais vertinimais, EK rudenį jau antrą kartą padidino 2004 m. šalies ekonomikos augimo prognozes – šįkart iki 6,7 proc.; visgi kitais metais, ir EK ekspertų nuomone, augimas turėtų lėtėti ir siekti apie 6,4 proc.8. Visos institucijos sutinka dėl bendros ūkio plėtros dinamikos. Kaip ir rinkos dalyviai, daugelis institucijų mažino 2004 m. augimo vertinimus ir 2005 m. prognozes. „Nordea“ specialistai, smarkiai mažinę savo 2004-2005 m. prognozes, mano, kad Lietuvos augimo ciklas iki 2003 m. aukštumų jau nebekils. Su jais sutinka ir kiti, numatantys mažesnį BVP augimą 2005 m. (žr 1.1 lentelę) Būtų sunku, o ir nelabai realistiška tikėtis, kad Lietuvos BVP augs ankstesnių metų tempais savaime, be rimtesnių reformų. Ekonomikos augimą būtina nuolat skatinti, ir ne tik tose srityse, kurios tiesiogiai apibrėžiamos kaip ekonominės. Nereformuojamos tokios sritys kaip sveikatos apsauga, viešasis administravimas, biudžeto deficitas, švietimas ar pensijų sistema ne tik kad neskatina šalies ūkio plėtros, bet ir tampa bet kokio augimo stabdžiu.
Lietuvos statistikos departamentas, www.std.lt. Lietuvos statistikos departamentas, „2004 metais bendrasis vidaus produktas padidėjo 6,7 procento“, 2005-03-10, www.std.lt. 7 ELTA, „Pirmąjį pusmetį Lietuvos BVP išaugo 7,2 proc.“, 2003-09-09. 8 European Commission, European Economy, Economic Forecasts, Spring 2004, p. 96–97. http://europa.eu.int/comm/economy_finance/publications/european_economy/2004/ee204en.pdf 5 6
10
MAKROEKONOMIKA
1.1 lentelė Lietuvos BVP augimo prognozës* SEB HBM LLRI EK „Nord/LB“ TVF „Nordea“ VB FM PB PwC
2004
2005
7,3 7,0 (7,5) 6,8 (6,9) 6,7 (7,1) 6,7 (6,6) 6.6 (7,0) 6,6 (7,0) 6,6 (6,8) 6,7 (6,5) 6,5 (6,0) 6,4
7,1 6,8 6,3 (6,5) 6,4 (6,6) 5,9 (6,7) 7,0 (6,3) 6,1 (6,6) 6,8 7,0 (6,5) 6,2 (6,0) 5,9
* skliausteliuose pateiktos ankstesnės prognozės Santrumpos: SEB – Skandinaviska Enskilda Banken9, HBM – „Hansabank“ Markets10, LLRI – Lietuvos laisvosios rinkos instituto tyrimas, EK – Europos Komisija11, Nord/LB“12, TVF – Tarptautinis valiutos fondas13, “Nordea“14 VB - Vilniaus bankas15, FM – Finansų ministerija16, PB – Pasaulio Bankas17, PwC – Price waterhouseCoopers18.
1.1.1. Pasaulio ekonomikos augimas Lietuvos ūkio raida yra glaudžiai susijusi su situacija pasaulio rinkose ir vis labiau priklauso nuo pasaulio ekonominės plėtros tendencijų. Spartesnis pasaulio ekonomikos ir pagrindinių Lietuvos prekybinių partnerių rinkų augimas turėtų pozityviai veikti Lietuvos ūkio plėtrą. Vertėtų susimąstyti, kodėl sparčiai augant JAV, Azijos, buvusios Sovietų Sąjungos ekonomikoms ir atsigaunant euro zonai, Lietuvos ekonomikos plėtra
lėtėjo. Įvertinus situaciją pasaulio rinkose, galima būtų daryti išvadą, kad lėtesnis ekonomikos augimas yra ne išorinių veiksnių pasekmė, o tiesioginis vidinės ekonominės politikos rezultatas. Pasaulio ekonomika, gavusi impulsą 2003 pabaigoje, praeitais metais gana stabiliai stiprėjo19. Vis dėlto antroje metų pusėje, iš dalies dėl kilusių naftos kainų, ekonomikos augimas JAV ir Kinijoje šiek tiek lėtėjo, o Japonijoje netgi buvo jaučiama ekonominė stagnacija – tris paskutinius 2004 metų ketvirčius šalyje buvo užregistruotas neigiamas ekonomikos augimas. Nepaisant to, Tarptautinis valiutos fondas šių metų balandžio mėnesį dar kartą pagerino savo 2004 m. pasaulio ekonomikos augimo vertinimus, šį kartą iki 5,1 proc. Jau rudenį buvo skelbta, kad jei pasitvirtintų TVF tuometinės prognozės (rugsėjo mėnesį TVF tikėjosi 5 proc. augimo), tai būtų sparčiausias pasaulio ekonomikos augimas nuo 1973 m. Naujausiais TVF duomenimis, metinis pasaulio ekonomikos augimas netgi pralenkė lūkesčius. Plėtrą skatino didėjantys ūkio subjektų pasitikėjimas ir įmonių pelnas, stiprėjanti nekilnojamojo turto rinka, atsigaunančios vertybinių popierių biržos, mažėjantis nedarbas20. EK ekspertų vertinimai, nors ne tokie aukšti kaip TVF, taip pat gana optimistiški: jie mano, kad pasaulinis ūkis augo 4,5 proc. 2004 m., o 2005 m. augs 4,3 proc.21. The Economist skelbia 4,4 proc. augimą 2004 m. Optimistiškai situaciją vertina ir ECB ekspertai – jie 2005 metais pasaulio ekonomiką tikisi augsiant 4,7 proc.22. Vieno iš pagrindinių postūmių augimui pasaulio ekonomika ir vėl turėtų sulaukti iš Jungtinių Amerikos Valstijų: šios šalies ekonomika, TVF specialistų teigimu, 2004 metais augo 3,9 proc., o šiemet turėtų kilti dar 3,6 proc. 2005 m. kovo mėnesį „Bloomberg
ELTA, 2004 10 07, www.elta.lt. HansaBank Markets, „The Baltic Outlook“, 2004 -11-08, p. 3. 11 European Commission, Commission’s Autumn Economic Forecasts 2004-2006, April 2005, http://europa.eu.int/comm/economy_finance/ publications/european_economy/forecasts_en. 12 Nord/LB Lietuva, „Lietuvos ekonomikos apžvalga“, 2005/3, 2005 04 13, http://www.nordlb.lt/files/Ataskaitos/Lithuanian/lsa_2005_ 2.pdf. 13 IMF, “World Economic Outlook”, April 2005, p. 217. http://www.imf.org/external/pubs/ft/weo/2004/02/pdf/chapter1.pdf. 14 ”Nordea”, Economic Outlook, February 2005, p. 37. 15 Vilniaus bankas, „Lietuvos makroekonomikos apžvalga“, Nr. 4/20, 2005 02, p. 12. 16 LR finansų ministerija, „Lietuvos ekonominių rodiklių projekcijos 2005–2008 metams“, www.finmin.lt. 17 World Bank EU-8 Quarterly Economic Report, April 2005. 18 Nastaravičius, M. Lietuva tebeauga sparčiausiai iš ES narių. – Verslo žinios, 2004-06-03, p. 9. 19 Augimą labiausiai skatino augantis įmonių pelnas ir nekilnojamojo turto rinkos plėtra. BBC News, „World growth ‚fastest since 1973‘“, 2004 09 29. 20 The Wall Street Journal 2004- 09- 06 pranešė, kad nedarbo lygis JAV nukrito iki 5,4 proc. ir yra žemiausias nuo 2001 metų spalio. Euro zonos nedarbo lygis nuo praėjusių metų nesumažėjo ir tebėra 9 proc. The Wall Street Journal2004-09- 03, The Economist, 2004 09 11, p. 100. 21 European Commission, European Economy, Economic Forecasts, Spring 2005, http://europa.eu.int/comm/economy_finance/publications/ european_economy/forecasts_en.htm. 22 ECB, Monthly Bulletin, March 2005, p. 68. 9
10
MAKROEKONOMIKA News“ apklausti ekonomistai taip pat padidino JAV ekonomikos prieaugio prognozę nuo 3,6 iki 3,8 proc.23 The Economist apklausti ekspertai pateikia beveik identiškas prognozes ir po 3,9 proc. augimo 2004 m. šiemet tikisi 3,8 proc. augimo24. EK padidino savo 2004 metų vertinimus dviem procentiniais punktais; jų duomenimis, JAV ekonomika praėjusiais metais išaugo 4,4 proc. Visgi 2005 m.
11 vartojimo29, dauguma sutinka, kad mažesnė vidaus rinkos paklausa ir lėtesnis privatus vartojimas šiandien yra pagrindiniai veiksniai, verčiantys abejoti, ar euro zonos ekonomika artimiausiu laikotarpiu sustiprės. The Economist tyrimo dalyviai taip pat sumažino savo praėjusiųjų metų vertinimus iki 1,5 proc., tikisi, kad 2005-aisiais euro zonos ekonomika augs 1,9 proc.30. 1.2 lentelė
EK tikisi šiek tiek lėtesnės – 3 proc. – plėtros25. Be JAV, stiprią įtaką pasaulio ekonomikai turėtų daryti spartus Azijos, ypač Kinijos ir Indijos, NVS bei OPEC šalių ekonomikų augimas. Daugelis Pietų Amerikos šalių taip pat augo sparčiau nei tikėtasi, smarkiai pralenkdamos Lietuvos augimo tempus26. Praėjusiais metais tikėtasi, kad euro zona taip pat pradės atsigauti po ekonominės stagnacijos 2003 m. pirmoje pusėje. Beveik visos tarptautinės organizacijos 2004 m. viduryje didino euro zonos augimo prognozes27. Bet praėjusių metų gale bei šių metų pradžioje dauguma jų prognozes bei vertinimus taip pat vieningai mažino. Europos centrinis bankas (ECB), atsižvelgdamas į didėjančias naftos kainas ir stiprėjantį eurą, gruodžio mėnesį sumažino savo prognozes. ECB nuomone, 2004 metais euro zonos ekonomika augo 1,8 proc., panašiai turėtų augti ir šiemet – nuo 1,2 iki 2 proc. Anksčiau buvo prognozuotas atitinkamai 1,9 ir 2,3 proc. augimas.28 Savo prognozes 2005 m. nuo 2 proc. iki 1,6 proc. sumažino ir Europos Komisija (ES-25 –nuo 2,5 proc. iki 2 proc.). Pagrindiniais euro zonos ekonomikos augimo varikliais, turinčiais pažadinti ES ekonomiką, ekspertai mano esant išorinę rinkos paklausą, augančias išlaidas investicijoms, naujų darbo vietų augimą ir eksportą. Vis dėlto, nors EK tikisi atsigaunančio privataus
BVP augimo prognozës 2004 TVF Pasaulis JAV Euro zona ES-25 ES-15 Japonija NVS Rusija Kinija
5,1 3,9 1,6
1,0 8,2 7,1 9,5
EK 4,5 4,4 2,0 2,4 2,3 2,7 -
2005 TVF 4,3 3,6 2,3
1,6 6,5 6,0 8,5
EK 4,3 3,6 1,6 2,0 1,9 1,1 -
Šaltinis: Tarptautinis valiutos fondas31, Europos Komisija32
Ilgalaikę Lietuvos ūkio plėtrą ir rinkos dalyvių lūkesčius ilgai teigiamai veikė tęsiamas privatizavimas ir demonopolizavimas. Nuo 2003 m. pradžios buvo demonopolizuota telekomunikacijų rinka, 2004 m. sausio 1 d. baigėsi stipriųjų alkoholinių gėrimų gamybos valstybės monopolis. Žingsnis žengtas ir naftos verslo srityje, nes iki narystės ES „Mažeikių nafta“, dėl įėjimo į rinką barjerų, buvo absoliuti (nenatūrali) monopolija33. Kitiems naftos produktų importuotojams taikytas 15 proc. naftos produktų importo tarifas po gegužės 1 d. sumažėjo iki nepilnų 5 proc.34.
ELTA,„Analitikai didina JAV ekonomikos augimo prognozes“, 2005-03-09, www.elta.lt The Economist, „Economic and Financial Indicators“, 2005- 04- 02, p. 88. 25 European Commission, European economy, Economic Forecasts, Spring 2005, http://europa.eu.int/comm/economy_finance/publications/ european_economy/forecasts_en. 26 CESifo World Economic Survey, 3/2004, pp. 4-9. The Economist, Emerging Market Indicators, 2005 04 09, p. 90. 27 Rugsėjo mėnesį „Eurostat“ padidino euro zonos ekonomikos augimo prognozes dviem procentiniais punktais iki 1,6–2,2 proc. 2004 metams bei vienu punktu iki 1,8–2,8 proc. 2005-iesiems. Europos Komisija prognozavo, kad šiemet euro zonos ekonomika augs 1,7 proc. (ES – 2 proc.), palyginti su 0,4 proc. (ES – 0,8 proc.) 2003 m. 28 ECB, Monthly Bulletin, p. 68. 29 Taip pat žr. CESifo World Economic Survey, 3/2004, p. 4. 30 The Economist, „Economic and Financial Indicators“, 2005- 04 -09, p. 88. 31 IMF, „World Economic Outlook”, Spring 2004, http://www.imf.org/external/pubs/ft/weo/2004/01/pdf/chapter1.pdf; World Economic Outlook, Fall 2004, BBC News, „World growth ‘fastest since 1973’“, 2004-09-29. 32 European Commission, Commission’s Spring Economic Forecasts 2004-2006, Brussels, April 2005, http://europa.eu.int/comm/economy_finance/publications/european_economy/forecasts_en.htm 33 Natūraliai rinkoje dominuojančių įmonių pavyzdžiai yra „Lietuvos dujos“, „Vakarų ir Rytų skirstomieji tinklai“, „Lietuvos geležinkeliai,“ telekomas. Be MN, nenatūraliomis (rinkoje dominuojančiomis padedant valdžiai) monopolijomis galima vadinti „Lietuvos paštą“, šilumos, transporto, švietimo, bei sveikatos apsaugos sektorius. 34 Grižibauskienė E. Monopolijų apsuptyje, – Veidas, Nr. 41, 2004-10-07, p. 16–17. 23 24
12 2004 metais lūkesčius teigiamai veikė ir vis dar spartūs privatizacijos tempai. Pernai šalyje iš viso buvo sudaryti 576 sandoriai ir valstybės turto privatizuota už daugiau nei 410 mln. Lt35. Privatizuoti Nacionalinės vertybinių popierių birža ir Lietuvos centrinis vertybinių popierių depozitoriumas. Už 100 mln. Lt parduoda 34 proc. „Lietuvos dujų“ akcijų, privatizuoti „Alita“ ir „Anykščių vynas“, „Lietuvos kino studija“ ir „Kruonio hidroakumuliacinės elektrinės statyba“, metų gale baigtas ir „Klaipėdos laivų remonto“ privatizavimo sandoris.36 Per šių metų pirmą ketvirtį jau sudaryti 165 sandoriai, privatizuota draudimo bendrovė „Lietuvos eksporto ir importo draudimas“, sudarytas sandoris dėl 68,69 proc. „Spaudos“ akcijų pardavimo. Džiugu, kad šių metų kovo mėnesį Vyriausybė pritarė programai, pagal kurią investuotojams dar kartą siūloma nacionalinė oro bendrovė „Lietuvos avialinijos“. Vis dėlto daugelio svarbių sričių privatizacija vis dar stabdoma. Kalbos apie „Lietuvos geležinkelių“ privatizaciją ir rinkos liberalizavimą dar yra tuščios. Vyriausybė į šios rinkos liberalizavimą žiūri lanksčiau (tai numatyta ir ES direktyvose), tačiau yra tvirtai pareiškusi, kad viešoji geležinkelių infrastruktūra neprivatizuojama37. Jau pasibaigus privatizavimo konkursui buvo nuspręsta atidėti ir „Rytų skirstomųjų tinklų“ privatizavimą. Kita vertus, vien tik privatizavimas ne visuomet išsprendžia problemas. Dažnai valstybės vaidmuo tam tikrose rinkose išlieka labai panašus ir privatizavus tose rinkose veikiančias įmones. Pavyzdžiui, energetikos srityje: nors neseniai privatizuotos ir „Lietuvos dujos“, ir „Vakarų skirstomieji tinklai“, įmonės negali rinkoje veikti visiškai laisvai, o jų produkcijos kainos vis dar reguliuojamos valstybės. Šiais metais tyrimo ekspertai laukia kiek lėtesnio ekonomikos augimo. Jų nuomone, šalies ekonomika per 2005 m. turėtų ūgtelėti 6,3 proc. Tokiems vertinimams įtaką daro reformų strateginėse ūkio šakose nebuvimas, neprognozuojama valstybės politika, ypač nenuspėjama Vyriausybės mokesčių politika, nemažėjanti šešėlinė ekonomika. 1.1.2. Šešėlinė ekonomika LLRI tyrimo duomenimis, lūkesčiai, kad šešėlinė ekonomika mažės, nepasitvirtino, netgi atvirkščiai – pasak rinkos dalyvių, šešėlinė ekonomika šalyje 35 36
MAKROEKONOMIKA pastaruoju metu išaugo (žr. grafiką 1.2). Šešėlinė ekonomika apibūdinama kaip per metus galutiniam vartojimui šalies viduje pagamintų prekių ir suteiktų paslaugų, oficialiai nedeklaruojamų dėl mokesčių ar reguliavimų, dalis visame BVP. Rinkos dalyvių nuomone, per paskutinius ketverius metus šešėlinės ekonomikos dalis BVP išlieka panaši ir sudaro maždaug apie penktadalį šalies ekonomikos. Naujausiojo tyrimo duomenimis, 2004 m. šešėlinė ekonomika sudarė 20,8 proc. BVP. Šiais metais ji turėtų beveik nekisti – rinkos dalyvių nuomone, 2005 m. ji sudarys 20,6 proc. visos šalies ekonomikos. Pažvelgę į ankstesnes 2004 ir 2005 metų prognozes, matome, kad rinkos dalyvių lūkesčiai per praėjusius metus kito. 2004 metų pavasarį, veikiami teigiamų lūkesčių dėl narystės Europos Sąjungoje bei laukdami ilgai brandintos mokesčių reformos, rinkos dalyviai pirmą kartą po trejų metų pertraukos prognozavo šešėlinės ekonomikos mažėjimą nuo stabilių 20 proc. 2002–2003 m. iki 18,6 proc. 2004-aisiais. Vis dėlto prieš pusę metų šešėlinės ekonomikos vertinimai buvo beveik procentu padidinti, o šiame tyrime jie kilo dar daugiau – nuo 19,5 proc. iki beveik 21 proc. Šešėlinei ekonomikai smukti trukdo nemažėjanti – ir, manoma, didėsianti – mokesčių našta (žr. 1.5 skirsnį), mokesčių politikos nenuoseklumas ir nenuspėjamumas, griežtas darbo santykių reguliavimas, cigarečių, degalų akcizas, negerėjančios individualiųjų įmonių verslo sąlygos. LLRI tyrimo duomenimis, daugiau nei 41 proc. žmonių, oficialiai dirbančių už minimalią algą, gauna atlyginimus vokeliuose. Šis rodiklis nekinta jau kelerius metus iš eilės, taigi situacija šešėlinio darbo srityje negerėja. Specialistų nuomone, šis rodiklis nesumažės, kol nemažės darbo apmokestinimas. Nors rinkos dalyviai prieš metus tikėjosi, kad narystė ES sumažins šešėlinės ekonomikos dalį, galima laukti ir priešingo efekto. Iš tiesų, Lietuvos narystė ES gali ir padidinti šešėlinės ekonomikos dalį BVP. Jau ir dabar šešėlinės ekonomikos prognozės rodo, kad „šešėlių mažėjimo“ artimiausiu metu rinkos dalyviai nesitiki. Taikantis prie ES taisyklių ir akcizų, prekės brangsta, didėja Lietuvos ir jos kaimynių už ES sienos kainų skirtumas – tai skatina kontrabandą. Šešėlinei eko-
ELTA, „Vasarį Lietuvoje privatizuota turto už 17,4 mln. litų“, 2005-03-01. Jonuškaitė T. „Pernai privatizuota už daugiau nei 410 mln. Lt“. VŽ Online, 2005-01-03.
MAKROEKONOMIKA nomikai augti padeda ir pernelyg sudėtingos legalaus verslo sąlygos: rinką reguliuojančios įvairios, dažnai dviprasmiškos taisyklės, komplikuotas licencijavimas, griežtas darbo santykių reguliavimas, daug kainuojantis reikalavimų įgyvendinimas. Kovoje su kontrabanda vis dar naudojamos trumpalaikės priemonės, nėra vientisos ilgalaikės strategijos, efektyviai pagrįstos kainų tarp kaimyninių šalių skirtumo mažinimu, nereikalingų apribojimų šalinimu, savavališkos veiklos galimybių mažinimu bei administracinių ir muitinių procedūrų supaprastinimu38. Nors Vyriausybės atstovai mano, kad rinkos dalyviai turėtų džiaugtis tuo, kad buvo išsiderėtas akcizų su ES suderinimo septynerių metų pereinamasis laikotarpis39, iš tiesų jau dabar kai kurie akcizai Lietuvoje viršija ES nustatytus minimalius tarifus40. Nuo 2003 m. kovo įsigaliojus naujiems tabako gaminių akcizams (akcizas buvo padidintas nuo 36 iki 53,9 lito už tūkstantį cigarečių vienetų41), tabako gaminiai pabrango 20-30 centų, o nuo 2004 m. pradžios, vėl padidinus tabako gaminių akcizą42, 20-ies cigarečių pakelis, priklausomai nuo cigarečių rūšies, brango dar 0,24–0,35 lito43. Pagal ES reikalavimus, iki 2009 m. pabaigos cigarečių akcizo mokestis Lietuvoje turi sudaryti 57 proc. mažmeninės cigarečių kainos44. Ir nors Lietuvoje taikomi tabako gaminių akcizai kol kas dar yra vieni mažiausių ES, Rusijoje bendra cigarečių akcizo našta yra beveik 9 kartus mažesnė. Tai yra pakankama paskata cigarečių kontrabandai45. Todėl nenuostabu, kad Lietuvos kontrabandos rodikliai praėjusiais metais sumušė visus nepriklausomybės metų rekordus. Ir jei jau 2002 metais, Lietuvos prekybininkų duomenimis, nelegalūs produktai užėmė apie 30 proc. šalies tabako rinkos,46 galima neabejoti, kad 2004-2005 metų rodikliai bus dar didesni.
13
1.2 grafikas Ðeðëlinës ekonomikos dalis BVP, proc.
40 30
27 24
22
20
22
19
20
20
21
21
10 0
1997 1998 1999 2000 2001 2002 2003 2004 2005p
Šaltinis: LLRI tyrimas
Šešėlinei ekonomikai mažėti trukdo ir nemažėjanti individualiųjų įmonių (IĮ) mokesčių našta. Nuo 2003 m. individualiosios įmonės, be 15 proc. pelno mokesčio, privalo mokėti ir 15 proc. pajamų mokestį nuo tos pajamų dalies, kurią IĮ savininkai naudoja savo reikmėms. Individualiųjų įmonių verslo sąlygos pablogėjo 2003 m. lapkričio mėnesį priėmus Individualiųjų įmonių įstatymą. Be kitų apribojimų įstatyme numatyta, kad fizinis asmuo gali turėti tik vieną individualiąją įmonę, individualiosios įmonės savininku gali būti tik vienas fizinis asmuo, o santuoką sudaręs asmuo turi gauti raštišką sutuoktinio sutikimą steigti individualiąją įmonę. Be to, individualiųjų įmonių savininkai negali būti tikrųjų ūkinių bendrijų nariais ar komandinių ūkinių bendrijų tikraisiais nariais. Taip siekiama apginti kreditorių interesus. Tačiau tokios nuostatos įteisina nepagrįstą asmens teisių suvaržymą, netgi skatina įmonių uždarymą, nes dėl finansinės ir organizacinės naštos ne visos įmonės nori ar gali reorganizuotis47. Tikėtina, kad tai daugelį individualiųjų įmonių savininkų stumia į šešėlį.
Pečiulis G. Lietuvos geležinkeliai rieda privatizavimo link ? – Veidas, Nr. 41, 2004-10-07, p. 26–28. LLRI, “Kontrabandos ekonominių priežasčių tyrimas”, 2004 m., p. 9. Kmieliauskas L, Kontrabandos perspektyvos geros, verslo – prastesnės – Verslo žinios, 2004-07-02, p. 4. 39 Pagal ES reikalavimus, iki 2009 m. gruodžio 31 d. cigarečių akcizo mokestis Lietuvoje turi sudaryti 57% cigarečių mažmeninės kainos. Kmieliauskas L. Mažesni akcizai stabdytų cigarečių kontrabandą. – Verslo žinios, 2004-06-17, p. 5. 40 Kmieliauskas, L., Kontrabandos perspektyvos geros, verslo - prastesnės. –Verslo žinios, 2004 -07- 02, p. 4. 41 Specifinis akcizo elementas buvo padidintas 30,6 iki 42,6 lito už tūkstantį cigarečių vienetų. Lietuva yra įsipareigojusi didinti cigarečių akcizą, kol jis pasieks minimalią ES akcizo norma 2009 m. pabaigoje. Nuo 2003 m. minimali tabako akcizo norma ES šalyse negali būti mažesnė kaip 64 eurai (220,8 lito) už 1000 cigarečių. 42 Specifinis cigarečių akcizas padidintas nuo 42,6 lito iki 47,5 lito už 1 tūkst. cigarečių, o advalorinis tarifas – nuo 10 proc. iki 15 proc. 43 BNS, „2004-aisiais brangs tabakas, degalai ir šiluma, tačiau kartu didės atlyginimai ir pensijos”, 2003 12 31. 44 Pagirtinas Vyriausybės sprendimas pasinaudoti pereinamuoju laikotarpiu ir atidėti akcizų didinimą dar metams. Kmieliauskas L. Mažesni akcizai stabdytų cigarečių kontrabandą.– Verslo žinios, 2004-06-17. p. 5. 45 VSAT duomenimis, 71 proc. sulaikytų kontrabandinių cigarečių buvo vežama iš Rusijos Federacijos Kaliningrado srities, 20 proc. - iš Baltarusijos. Zr. LLRI, “Kontrabandos ekonominių priežasčių tyrimas”, p. 21. 46 Ambrazas G. Akcizų didinimas skatina šešėlinę ekonomiką, – Respublika, 2002-11-28; Markevičienė E. Brangstančios cigaretės skatina nelegalią prekybą. – Lietuvos žinios, 2002- 11-27. 47 Plačiau apie LLRI išvadas dėl Individualiųjų įmonių įstatymo projekto http://www.lrinka.lt/Tyrimai/Imones/Indim.phtml. 37 38
14 Apibendrinant, rinkos dalyviai mano, kad šalies ūkis ir toliau sparčiai auga, nors ir nepasiekdamas 2003 m. aukštumų. Augimą skatina vidaus rinkos plėtra, veikiama kylančio darbo užmokesčio ir gausėjančių investicijų; išnyko paskutiniai prekybos barjerai bei pagerėjo eksporto sąlygos, skatinusios eksporto augimą Lietuvai įstojus į ES; taip pat narystė paskatino specializaciją daugelyje sričių. Plėtrą stabdo reformų strateginėse srityse nebuvimas, didėjančios šešėlinės ekonomikos augimas, kurį laiką neaugusios ir, palyginti su ankstesniais metais bei kaimyninėmis šalimis, dar ir dabar labai negausios užsienio investicijos, gyventojų emigracija bei augantis kvalifikuotos darbo jėgos trūkumas.
1.2. Importas ir eksportas LLRI tyrime vertinamas deklaruojamų ir nedeklaruojamų importuotų ir eksportuotų prekių ir paslaugų vertės pokytis. Tiek eksporto, tiek importo augimas, rinkos dalyvių ex poste vertinimais, pranoko išankstinius lūkesčius. Eksporto augimo tempai, tyrimo dalyvių nuomone, ir vėl yra spartesni nei importo. Rinkos dalyvių vertinimu, 2004 m. eksportas augo 13,2 proc., o importas – 12,4 proc., palyginti su atitinkamai 12 proc. ir 11,4 proc. 2003-aisiais. Šiais metais jie turėtų augti dar sparčiau: eksportas 13,8 proc. o importas 12,6 proc. Rinkos dalyvių 2004 m. užsienio prekybos ex poste įverčiai yra aukštesni nei ankstesnės prognozės. Importo vertinimai kilo beveik vienu, o eksporto – pusantro procento, palyginti su praėjusiame tyrime skelbtomis prognozėmis. Tačiau lygindami su prieš metus pateiktais lūkesčiais, matysime, kad importo ir eksporto įverčiai kito labai nežymiai – jie yra vos 0,3 procento didesni. Rinkos dalyvių nuomone, Lietuvos užsienio prekyba vis dar sparčiai auga, ir jos mastai bei tempai artimoje ateityje mažėti neturėtų. Mažesni praėjusių metų rodikliai galėjo atspindėti kurį laiką trukusį investicijų badmetį, taigi ir mažesnį importuojamų investicinių prekių poreikį. Kita vertus, importo piniginė reikšmė galėjo mažėti silpnėjant doleriui, kuris vis dar neretai buvo naudojamas importo atsiskaitymams. Mažesni eksporto
MAKROEKONOMIKA vertinimai, skelbti praėjusiųjų metų rudenį, atspindi vangų pagrindinių Lietuvos įmonių eksporto rinkų atsigavimą bei išaugusius – ir nepasiteisinusius – lūkesčius apie staigius pokyčius ES narystės išvakarėse. Didesnius eksporto nei importo rodiklius galėjo lemti keli veiksniai. Pirmiausia, narystė ES gerokai pakoregavo importo dinamiką. Lietuvos įstojimo į Europos Sąjungą įtaka importui iš daugumos trečiųjų šalių yra kur kas didesnė nei įtaka eksportui į šias šalis. Ūkio ministerijos vertinimais, kadangi Europos Sąjungos taikomi importo muitai daugeliu atvejų yra didesni nei Lietuvoje ir kadangi tų importuojamų prekių, kurioms taikomi muitai didėja, importo dalis yra žymiai didesnė, importo „pabrangimas“ po prisijungimo prie ES jaučiamas ryškiau nei „atpigimas“48. Kaip rodo LR ūkio ministerijos atliktas tyrimas, apie 30 proc. prekių, įvežamų iš pagrindinių užsienio prekybos partnerių trečiosiose šalyse, vidutiniškai brango 5,6 proc.49. Kita vertus, importo iš trečiųjų šalių pabrangimą gali kompensuoti pigesnių alternatyvų kitose valstybėse ieškojimas ar nuolaidų iš tiekėjų ir gamintojų išsiderėjimas, taip pat supaprastėjusių importo procedūrų bei netarifinių barjerų išnykimo skatinamas bei piginamas importas iš ES šalių. Oficialioji Lietuvos statistika pateikia aukštesnius, nei rinkos dalyviai numatė, šių metų eksporto bei importo rodiklius. Ūkio ministerijos skelbiamais duomenimis per 2004 m., palyginti su 2003 m., eksportas išaugo 21 proc., o importas – 15,8 proc. Labiausiai 2004 m. didėjo tarpinio vartojimo prekių ir vartojimo prekių prekyba.50 Aukštesni oficialiosios statistikos rodikliai atspindi ir metodologinius pokyčius – nuo šiol eksportas ir importas į ES šalis skaičiuojamas nebe pagal muitinės, o pagal įmonių pateiktus rodiklius. Užsienio prekybos augimas yra neabejotinai įspūdingas. Šiandienos rinkos dalyvių lūkesčius ir, atitinkamai, aukštus vertinimus ir prognozes, (ypač eksporto srityje), skatina po truputį bandanti atsigauti euro zonos ir spartėjanti JAV ekonomikos plėtra (žr. 1.1 skirsnį), paskutinių prekybos barjerų išnykimas Lietuvai tapus ES nare, taip pat didėjančios naftos ir metalų kainos. Importo augimo lūkesčius skatina sparčiau augančios gyventojų pajamos, perkamoji galia ir vartojimas bei po kelių metų stagnacijos šiek tiek atsigaunantys investiciniai procesai51.
LR ūkio ministerija, „Prekybos režimo pokyčių, Lietuvai tapus ES nare, su trečiosiomis šalimis 2002 metų importo ir eksporto duomenų pagrindu įvertinimas“, http://www.ukmin.lt/index.php/lt/Prekyba/Uzsienio/Pokyciai2002. 49 Andružytė R., Nečiūnienė L. Muitus įveiks derybomis. – Verslo žinios, 2003-08-20. 50 Lietuvos statistikos departamentas, www.std.lt. 51 Daugiau apie investicinius procesus žr. Linkaitis, M. Investicijų badmetis baigėsi, – Verslo žinios, 2004-09-23, p. 1. 48
MAKROEKONOMIKA
15 aisiais55. „Eurochambres“ vertinimu, nors eksporto augimo prognozė ir pozityvi, Lietuvos ūkio plėtros pagrindiniu varikliu artimiausiu metu visgi turėtų būti vidaus prekyba56.
1.3 grafikas Uþsienio prekybos augimas, proc. 20 16 12 8
16,4 12
12
13,0
12,2
11,4
2001
2002
13,2
13,8
12,4
12,6
4 0
importas
2003
2004
2005p
eksportas
Šaltinis: LLRI tyrimas
Rinkos dalyvių eksporto ir importo dinamikos vertinimai kitų institucijų kontekste yra vidutiniai. „Nordea“ pateikia žemiausius eksporto 2004 m. vertinimus: eksportas, jų skaičiavimais, išaugo 4 proc., o importas 14 –proc. 2005 m. „Nordea“ specialistai tikisi 8 proc. eksporto ir 9 proc. importo augimo.52 „Hansabanko“ ekspertai optimistiškesni: jų nuomone, eksportas augo 12,2 proc. 2004 m., ir kils dar 7,5 proc. 2005-aisiais, o importas, praėjusiais metais augęs 15,3 proc., šiemet turėtų ūgtelėti dar 9,2 proc. „Hansabanko“ specialistai mano, kad dėl vis dar didėsiančio namų ūkių vartojimo ir investicinių prekių paklausos, importas 2005 m. augs sparčiau nei eksportas.53 Vilniaus banko (VB) finansų ekspertai sutinka, kad importą skatins auganti gyventojų perkamoji galia, vartojimo prekių paklausa bei ES struktūrinių fondų skatinamos bendrovių investicijos. VB nuomone, jei „Mažeikių nafta“ ir toliau dirbs sklandžiai, eksportas 2005 m. turėtų augti labai panašiais tempais kaip ir pernai.54. Rinkos dalyvių lūkesčiai šiek tiek skiriasi nuo Europos Komisijos prognozuojamų tendencijų. EK paskutinėje apžvalgoje didino savo ankstesnę Lietuvos užsienio prekybos prognozę. Komisijos ekspertai, tikėjęsi panašaus ir eksporto, ir importo augimo (8,8 proc. ir 8,9 proc.) 2004 m., laukia spartesnio eksporto augimo (9 proc., palyginti su 8,5 proc. importo) 2005-
2004 m. svarbiausiu prekybos partneriu išlieka Europos Sąjungos valstybės. Nors dauguma prekybos su šiomis šalimis barjerų buvo panaikinti prieš oficialios narystės sutarties pasirašymą, vis dėlto per praėjusiuosius metus prekybos apimtys su ES smarkiai išaugo. Lietuvos prekių eksporto57 į ES-25 2004 m. vertė sudarė 66,4 proc. bendro Lietuvos eksporto, o tai beveik trečdaliu daugiau nei 2003 m. Importo vertė iš ES-25 2004 m. sudarė 63 proc. bendro Lietuvos importo, palyginti su 44,5 proc. 2003-aisiais. Importo į NVS apimtys beveik nepasikeitė ir dabar sudaro 27 proc. Lietuvos importo, o eksportas į šias šalis sudaro apie 16 proc.58. Gegužės 1 d. Lietuvai įstojus į ES, iš esmės pasikeitė Lietuvos prekybos režimas ir su Europos Sąjungos, ir su trečiosiomis šalimis. Ir jei, Ūkio ministerijos vertinimais, po narystės ES prekyba su trečiosiomis šalimis, galėjo tapti labiau komplikuota ir „pabranginti“ kai kurių prekių importą iš šių šalių, vis dėlto prekybai su ES buvo pašalinti paskutiniai barjerai. Įstojus į ES buvo panaikinti tarifiniai ir netarifiniai (pvz., antidempingo muitai, gaminių atitikties įvertinimai) prekybos barjerai su ES šalimis narėmis. Nuo 2004 m. gegužės 1 d. dar panaikinti importo muitai ir kiti apribojimai kai kuriems žemės ūkio gaminiams ir, kaip minėta, netarifiniai barjerai, pvz., muitinės procedūros. Apribojimų sumažėjimas atsispindi ir išaugusiuose prekybos su šiomis šalimis rodikliuose. Nors dėl nepasiteisinusių lūkesčių, lėtesnio nei tikėtasi eksporto rinkų atsigavimo, lėtėjusių investicinių procesų ir pasikeitusio prekybos režimo su trečiosiomis šalimis prieš pusę metų rinkos dalyviai pateikė mažesnes prognozes, dabar jie mano, kad užsienio prekyba tebeauga sparčiai. Kaip ir praėjusiais metais, 2005 m. eksportas turėtų augti sparčiau nei importas.
Nordea, Economic Outlook, p. 37. Hansabank Markets, The Baltic Outlook, p. 21. 54 Vilniaus bankas, “Lietuvos makroekonomikos apžvalga” 4 (20), 2005 02, p. 25. 55 European Commission, European Economy, Economic Forecasts, Spring 2005. http://europa.eu.int/comm/economy_finance/publications/ european_economy/forecasts_en. 56 Eurochambres’ Economic Survey 2004, “The Business Climate in Europe’s Regions in 2004”, p.14. 57 Nors oficialiai po 2004 m. gegužės 1d. eksportas į ES šalis-nares ir kandidates nebėra eksportas, o tik išvežimas, o importas – įvežimas, metodologiniais sumetimas šiame tyrime prekyba su ES šalimis vis dar bus vadinama uzsienio prekyba, o išvežimas ir įvežimas importu bei eksportu. 58 LR ūkio Ministerija, “Lietuvos užsienio prekybos apžvalga”, 2004. 52 53
16 1.3. Vartotojų ir gamintojų kainos auga sparčiau Rinkos dalyviai didino savo kainų augimo prognozes, ir mano kainas 2004 m. augus sparčiau nei 2003-aisiais, bei prognozuoja, kad spartus augimas išliks ir šiais metais. LLRI tyrimo dalyviai vertina prekių ir paslaugų, skirtų vartojimui namų ūkyje, bei prekių, kurias gamintojai perka ir naudoja tolesniame vertės kūrimo procese, vidutinių kainų pokytį laikotarpio pabaigoje. Pasak rinkos dalyvių, 2004 m., po 2003-aisiais vyravusio lėto kainų augimo, tiek vartojimo, tiek gamintojų perkamų prekių ir paslaugų kainos augo žymiai sparčiau: vartotojų kainos išaugo 2,96 proc., o gamintojų 3,3 proc., palyginti su 0,8 proc. augimu 2003 metais. Kainas kilti skatina pasikeitęs prekybos režimas bei akcizai (žr. 1.2 ir 1.5 skirsnius), smarkiai kilusios naftos kainos ir ilgalaikio vartojimo auginama vidaus paklausa (žr. 2.3 skirsnį). O paklausos augimui įtakos turi mažėjantis nedarbas (žr. 1.4 skirsnį) ir kylantis darbo užmokestis (žr. 2.2 skirsnį). Naujausiame tyrime kainų augimo prognozes buvo antrą kartą smarkiai padidintos. Jei prieš pusę metų ypač ryškus buvo pokytis vertinant gamintojų prekių ir paslaugų kainų augimą (rinkos dalyviai per 40 proc. padidino savo žiemą išsakytus 2004 m. vertinimus), tai šį kartą jie drąsiai didino tiek gamintojų, tiek ir vartotojų kainų augimo rodiklius: vartotojų kainų 2004 m. augimo ex poste įvertis yra 21 proc. aukštesnis už ankstesnes prognozes, gamintojų kainų vertinimas padidėjo beveik trečdaliu. Palyginti su prieš metus skelbtomis prognozėmis, gamintojų kainų įvertis kilo beveik 40 procentų. Vartojimo prekių kainų indekso didinimą iš dalies lėmė lūkesčiai, kad stojimas į ES skatins neapibrėžtą infliacijos šuolį, brangs nafta, nemažės statybų bumas59. Infliaciją taip pat turėtų skatinti reguliuojamų sektorių kainų didėjimas, kasmet augančios valdžios išlaidos, brangstančios transporto paslaugos bei dėl darbuotojų stygiaus augantys atlyginimai.
MAKROEKONOMIKA Kainų kilimą veikia ir nemažėjantis vartojimas. Priešingai nei 2003 m., augant namų ūkių pajamoms, sparčiai daugėjo ne sutaupomų pinigų ar investicijų, bet kasdieniam vartojimui skiriamų lėšų. Iš tiesų, Lietuvoje jau antrus metus pastebimas besitęsiantis akivaizdus vartojimo bumas. Finansų ministerijos duomenimis, realus vartojimas, 2004 m. augęs 8,7 proc., šiemet paaugs dar beveik tiek pat 8,4 proc.60. Ekonomistų nuomone, kainas jau dabar gali didinti nuogąstavimai dėl kilsiančių kainų po euro įvedimo. Vadovaudamiesi tokiais nuogąstavimais, žmonės gali bandyti prieš 2007 m. išleisti pinigus ir prisipirkti prekių. Kai kurie gyventojai, ekspertų nuomone, linkę jau dabar pradėti kaupti atsargas.61 Visgi būtų neteisinga tvirtinti, kad visos kainos vienašališkai kilo. Pavyzdžiui, maisto produktų prekybos su ES liberalizavimas sudarė sąlygas padidinti mėsos ir pieno produktų eksporto kainas bei importuoti tam tikras prekes pigiau, be muito. Taigi kainos kito dvejopai: vienos sumažėjo, kitos padidėjo. Todėl bendras kainų lygio pasikeitimas neatspindi skirtingų vartotojų patirties: vartojantys importinius pieno produktus, importinius alkoholinius gėrimus arba besinaudojantys kai kurių bendrovių ryšio paslaugomis galėjo kompensuoti bendrą maisto prekių, sveikatos ir transporto kainų pakilimą. Nors pagrindines kainų dinamikos tendencijas oficialiosios šalies institucijos ir tyrimo dalyviai vertina panašiai, vis dėlto skirtingai nei ankstesnių tyrimų metu, rinkos dalyvių kainų pokyčių vertinimas šįkart yra drąsesnis už oficialiąją šalies statistiką (žr. 1.4 grafiką). Rugsėjo mėnesį Finansų ministerija, prieš tai keletą kartų per metus mažinusi savo 2004 m. prognozes, metų gale rodiklius didino net dukart, keldama juos daugiau nei dvigubai: paskutiniais Finansų ministerijos duomenimis, bendrasis vartojimo prekių kainų indeksas 2004 m. buvo 2,9 proc., palyginti su -1,3 proc. 2003-aisiais. Naujausiais duomenimis, FM prognozuoja kiek mažesnę – apie 2,2 proc. - infliaciją 2005 metams.62 Europos Komisijos ekonomikos ekspertai taip pat sutinka, kad 2003 m. vyravusi defliacija63, 2004 m.
LR finansų ministerija, „Lietuvos ūkio plėtros prognozė 2004–2007 metams“, www.finmin.lt. LR finansų ministerija, “Lietuvos ekonominių rodiklių projekcijos 2005-2008 metams”, www.finmin.lt. 61 „Delfi“, „Prieš įvedant eurą laukiama masinio atsargų pirkimo“, 2005-03-23; “Įsivedus eurą kainos didės, pripažino R. Šarkinas”, Lietuvos bankas, 200 -11-02. 62 LR finansų ministerija, „Lietuvos ūkio plėtros prognozė 2004–2007 metams“, www.finmin.lt 63 Kainų augimą stabdė pagausėjęs importinių pigesnių prekių influksas, darbo našumas, lenkiantis vidutinio darbo užmokesčio augimą, bei vis dar auganti konkurencija mažmeninėje rinkoje. 59 60
MAKROEKONOMIKA
17
užleido vietą nuosaikiai – 1,7 proc. – infliacijai, kuri 2005 m. turėtų pasiekti 2,9 proc. lygį64. Tarptautinis valiutos fondas, kaip ir ankstesnėse ekonomikos apžvalgose, numatė kiek žemesnį – 0,6 proc. – infliacijos rodiklį 2004 m., bet tikisi, kad šiais metais infliacija bus didesnė ir sudarys 2,5 proc. Statistikos departamento duomenimis, gruodžio mėnesį metinė infliacija, palyginti su 2003 m. gruodžiu, sudarė 2,9 proc.65 Tai vis dar mažiausias kainų augimo rodiklis Baltijos šalyse: Latvijoje 2004 m. šis rodiklis siekė 7,3 proc., o Estijoje – 5 proc.66 Euro zonos infliacija 2004 m. buvo 2,1 proc., 2005 m. laukiama 1,9 proc. augsiančių kainų67. 1.4 grafikas Vartotojø kainø pokyèiai, proc. 6 5 4 3 2 1 0 -1 -2
5,5
2,4
2,4
2,3 1,4
3,3
2,9 2,9
2,58
2,2
2 1,4
0,3
-1
2,5
0,8
-1,3
1998 1999 2000 2001 2002 2003 2004 2005p 2006p LSD, FM
LLRI tyrimas
Šaltinis: Lietuvos statistikos departamentas, Lietuvos finansų ministerija, LLRI tyrimas
Kalbant apie LLRI tyrimo ir oficialiosios statistikos vartotojų kainų pokyčių duomenis, būtina atkreipti dėmesį į tai, kad tam pačiam dydžiui apskaičiuoti naudojami skirtingi įrankiai: LLRI tyrimo ekspertai vertina visų vartojimo prekių ir paslaugų vidutinio kainų lygio pokytį, o SD skaičiuoja vartojimo prekių ir paslaugų krepšelio vidutinių kainų pokytį. Krepšelio sandara ir pokyčiai turi nemažą įtaką Statistikos departamento vartojimo kainų indeksui. 2005 m. pradžioje, kaip ir kiekvienais metais, pakoregavus prekių ir paslaugų krepšelio, naudojamo kainų pokyčiams skaičiuoti, sudėtį, labiausiai sumažėjo bendrų
vartojimo išlaidų maisto ir nealkoholinių gėrimų lyginamasis svoris, o labiausiai padidėjo transporto grupės prekių ir paslaugų dalis. Visgi maistas ir nealkoholiniai gėrimai tebesudaro didžiausią vartojimo prekių ir paslaugų krepšelio dalį (28 proc.), po jo – būstas ir kuras bei transportas68. Oficialiais duomenimis, infliaciją labiausiai veikė sveikatos apsaugos, transporto, bei maisto produktų ir nealkoholinių gėrimų brangimas. Transporto grupės prekės ir paslaugos dėl brangusių dyzelinių degalų per metus pabrango 5,4 procento. Maisto produktai ir nealkoholiniai gėrimai, palyginti su 2004 m. sausio mėn., brango 5,0 proc. Sveikatos priežiūra brango labiausiai – per aptariamą laikotarpį daugiau kaip 10 proc.69. Būtent šis komponentas kelia didžiausią susirūpinimą, kadangi sveikatos priežiūra yra brangesnė nei nurodoma oficialioje statistikoje, ir neoficialiai ji reikalauja iš gyventojų bene didžiausių sąnaudų. Kainos šoktelėjo ir statybų sektoriuje: brangstant mašinų eksploatacijai, kylant darbo užmokesčiui ir žaliavų kainoms, statybų kainos nuo praėjusių metų pradžios išaugo 6,7 proc. Brangstanti nafta per devynis praėjusių metų mėnesius gamintojų parduodamos produkcijos kainas padidino beveik dešimtadaliu (be rafinuotų naftos produktų, kainų augimo tempas būtų keletą kartų mažesnis ir sudarytų 2,6 proc.). 70 LLRI tyrimo dalyvių nuomone, 2004 m. gamintojų kainos ūgtelėjo 3,3 proc. Kadangi rafinuotų naftos produktų gamyba Lietuvos pramonės struktūroje sudaro gana didelę dalį, šių produktų kainų kitimas daro nemažą įtaką gamintojų kainų indekso rodikliams. Taigi kainų įverčių padvigubinimas per pastaruosius metus gali būti tiesiogiai susijęs su naftos kainų šuoliu: išsakydami savo prognozes praėjusiame tyrime, rinkos dalyviai dar neturėjo informacijos apie rudens naftos kainų dinamiką. Ūkio ministerijos duomenimis, visos pramonės gamintojų parduotos produkcijos kainos 2004 m., palyginti su praėjusiais metais, padidėjo 6 proc.: išgaunamosios ir apdirbamosios pramonės kainos padidėjo 4,1 proc., elektros, dujų ir vandens tiekimo kainos sumažėjo 1,5 proc.71
European Commission, Commission‘s Autumn Economic Forecasts 2004-2006. http://europa.eu.int/comm/economy_finance/publications/european_economy/2004/ee504en.pdf 65 Lietuvos statistikos departamentas, 2005 02, www.std.lt. 66 Vilniaus bankas, „Užsienio verslo pulsas“, 2005- 03-10. 67 Commissions Autumn Economic Forecasts 2004-2006, 2004 10 26. 68 Lietuvos statistikos departamentas, „Lietuvos ekonominė ir socialinė raida“,1/2005, p. 54-58. 69 Ibid, p. 58. 70 ELTA, „Pramonės produkcijos kainos šiemet išaugo beveik dešimtadaliu“, 2004-10-07. 71 LR ūkio ministerija, „Lietuvos Respublikos ekonominės ir socialinės būklės 2004 metais apžvalga“. p. 7. 64
18 Gamintojų kainų lygiui, įstojus į ES, įtakos taip pat turi žymiai padidėjęs, jei lyginsime su ES nepriklausančiomis šalimis (žr. 1.2 skirsnį), bendras importo muitų lygis, darantis įtaką kai kurių Lietuvos gamintojų vartojamų žaliavų brangimui72. Kainas „augino“ ir spartesnis užsienio rinkų atsigavimas (net ir įvertinus lėtesnį euro-zonos augimą) (žr. 1.1 skirsnį). Tikėtina, kad LLRI tyrimo gamintojų kainų augimo rezultatams įtakos turi ir užsienio rinkų plėtros prognozės. Sparčiau kylant Vakarų bei Azijos šalių ūkiui, turėtų toliau augti žaliavų kainos. Be abejo, artimiausiu metu nemažą poveikį darys ir naftos kainų dinamika. Augančios naftos kainos privertė daugelį pramonininkų ieškoti būdų kompensuoti gamybos sąnaudas, tačiau artimiausiu metu jau žadama peržiūrėti bei kelti ir produktų kainas73. Dėl augančių naftos kainų bei rinkos sąlygų smarkiai pabrango suskystintos dujos74. Narystė Europos Sąjungoje neabejotinai veikė kainų dinamiką šalyje. Vietinės kainos kyla dėl subsidijų eksportui už ES ribų bei neimportuojamų į Lietuvą subsidijuotų žemės ūkio produktų iš ES. Taip pat, kaip jau minėta, pasikeitus užsienio prekybos režimui, brango daugelis importuojamų prekių ir žaliavų75. Svarbu paminėti, kad SD skaičiuoja gamintojų parduodamų prekių kainų pokyčius, o LLRI tyrimo dalyviai vertina gamintojų perkamų prekių kainų pokytį, taigi LLRI tyrime į gamintojų kainas yra įskaitomos importuojamos prekės, bet neįtraukiamos eksportuojamosios. Prekybos pokyčiai dėl skirtingos metodikos turėtų būti geriau atspindimi rinkos dalyvių vertinimuose ir prognozėse (o jie ir yra aukštesni), nes Lietuvos narystė Europos Sąjungoje didžiausią įtaką turėjo būtent importuojamoms prekėms.
MAKROEKONOMIKA 1.5 grafikas Gamintojø prekiø ir paslaugø kainø pokyèiai, proc. 30 25 20 15 10 5 0 -5 -10
23,3 18
8,6 6 2,7
1,5
2,4
3,3
2,7 1,8
1
6,8
3,6
0,8 -0,2
-3,9
-4,5
1997 1998 1999 2000 2001 2002 2003 2004 2005p LLRI tyrimas
LSD
Šaltiniai: LLRI tyrimai, Lietuvos statistikos departamentas
Be to, rinkos dalyvių prognozėms, kad sparčiau augs tiek vartotojų, tiek ir gamintojų kainos įtakos, turi valdžios sprendimai, kurių daugelis yra susiję su stojimu į ES. Nuo 2004-ųjų pradžios padidinus tabako gaminių ir degalų akcizus, brango cigaretės, variklių benzinas, gazolis ir žibalas76. Įsigalioję nauji degalų akcizo tarifai priartėjo prie buvusių minimalių ES akcizų tarifų77. Nuo 2004 m. įsigaliojo 5 proc. PVM už vaistus ir medicinos prekes78, buvo panaikintas 0 proc. PVM tarifas biodegalams, karstams bei laidojimo paslaugoms, tarptautiniams keleivių vežimams. Nuo sausio 1 d. statybai skirta žemė apmokestinama 15 proc. PVM. Nuo gegužės mėnesio buvo panaikintas lengvatinis 9 proc. PVM tarifas už gyvenamųjų patalpų šildymą: PVM tarifas šilumos energijai padidintas iki 18 proc. Kainas didino ir nuo 2005 m. pradžios pakilusios dujų ir elektros kainos. Degalų brangimą lydėjo ir kai kurių vartojimo prekių kainų augimas. „Lietuvos avialinijos“, atsižvelgdamos į 2004 m. antroje pusėje pasaulio rinkoje smar-
72 LR ūkio ministerija, „Prekybos režimo pokyčių, Lietuvai tapus ES nare, su trečiosiomis šalimis 2002 metų importo ir eksporto duomenų pagrindų įvertinimas“, http://www.ukmin.lt/index.php/lt/Prekyba/Uzsienio/Pokyciai2002. 73 Verslo žinios, „Peržengė ribą“, 2004-10-15, p.2. 74 Pačkauskaitė A. Suskystintos dujos brangsta įkandin naftos.– Verslo žinios, 2004-10-01, p. 3. 75 Ūkio ministerijos atlikto tyrimo duomenimis, importas iš Rusijos vidutiniškai brangs 1,8 proc., iš JAV – 14,8 proc., iš Ukrainos – 16,6 proc., Baltarusijos – 10 proc., Japonijos – 8,9 proc., Kinijos – 7,8 proc., Kazachstano – 6,5 proc. 76 Variklių akcizas padidėjo nuo 1250 litų iki 1318 litų, žibalo – nuo 720 litų iki 1002 litų, gazolio – nuo 860 litų iki 1002 litų už toną. Specifinis cigarečių akcizas padidintas nuo 42,6 lito iki 47,5 lito už 1 tūkst. cigarečių, o advalorinis tarifas – nuo 10 proc. iki 15 proc. Litras benzino degalinėse brango vidutiniškai 6 centais (2,6 proc.), dyzelino - 14 centų (6,9 proc.), o 20-ies cigarečių pakelis, priklausomai nuo cigarečių rūšies, pabrangs 0,24-0,35 lito. BNS, „2004-aisiais brangs tabakas, degalai ir šiluma, tačiau kartu didės atlyginimai ir pensijos“, 200 -12-31. 77 Europos Sąjunga nuo 2004 m. sausio 1 d. vėl padidino minimalų bešvinio benzino akcizo mokestį nuo 287 eurų už tūkstantį litrų iki 359 eurų. Lietuvos prašymu Europos Komisija pasiūlė Tarybai suteikti Lietuvai pereinamuosius laikotarpius minimaliems ES akcizo tarifams pasiekti: benzino – iki 2011 m., dyzelino – per pirmąjį etapą – iki 2011 m., antrąjį – iki 2013 m., elektros energijos, gamtinių dujų – iki 2010 m. 78 Kai kurie vaistai buvo apmokestinti jau nuo 2002 m. liepos mėnesio.
MAKROEKONOMIKA
19
kiai išaugusias naftos kainas, pradėjo taikyti degalų mokestį – 28 Lt už skrydžio segmentą, nuo spalio 1 d. apie 40 proc. brango taksi paslaugos, numatoma kelti ir kelionių autobusu kainas79. Be pasaulio rinkų tendencijų, naftos kainoms mūsų šalyje, įstojus į ES, įtakos turi muito mokesčio naftos produktams sumažinimas nuo 15 proc. iki 5 proc. Dėl ES taikomo 10 proc. aplinkosaugos mokesčio turi brangti seni automobiliai, taip pat iš trečiųjų šalių įvežami nauji automobiliai.
Šį kartą ir vietinių, ir tarptautinių institucijų 2004– 2005 metų naujausi vertinimai atrodo labai panašiai. Mažesnius rodiklius skelbė tik tos organizacijos, kurios tyrimus atliko dar rudenį, kai metinis kainų kilimas nebuvo taip smarkiai jaučiamas. Kaip ir buvo galima tikėtis, visos institucijos, praėjusį kartą pateikusios mažesnes prognozes, šįkart jas didino; jos taip pat didino ir savo 2005 m. prognozes. „Nordea“, EK, TVF, nors pateikia mažesnius rodiklius 2004 m., šiais metais tikisi didesnio infliacijos šuolio.
Kita vertus, kainoms dar sparčiau kilti trukdo stiprėjanti konkurencija vidaus rinkoje, kurią didina auganti vidaus pasiūla smulkaus eksporto rinkoms ir išaugęs lito kursas. Mažėjimo linkme kainų lygį veikia ir augantis darbo našumas. Didelę įtaką bendram kainų lygio kritimui turėjo vis dar pingančios ryšių grupės prekės ir paslaugos, mažėjančios poilsio ir kultūros sferos prekių bei paslaugų kainos ir dėl konkurencijos – drabužių ir avalynės kainos80.
Rinkos dalyviai prognozuoja, kad 2005 m. vartojimo prekių ir paslaugų kainos didės 3,3 proc., gamintojų – 3,6 proc. Tokie lūkesčiai pirmiausia yra siejami su toliau mažėsiančiu nedarbu bei sparčiai didėsiančiu darbo užmokesčiu ir namų ūkių pajamomis, savo ruožtu auginančiomis vidaus vartojimą (žr. skirsnį 1.2), taip pat su augančiomis naftos kainomis86, laipsnišku mokesčių su ES derinimu, didinamais akcizais. Kaip ir minėta, kainų kilimą gali skatinti ir žmonių įsitikinimas, kad įvedus eurą kils kainos, – tai skatina vartojimą, „prisipirkimą“. Apskritai spartesnis kainų kilimas augant BVP yra natūralus reiškinys, ir šiuo metu Lietuvoje pasiekti tempai toli gražu nėra bauginantys. Kad augant gyvenimo lygiui kyla ir kainos – sena tiesa, žinoma kaip Balassa-Samuelson efektas. Taigi kol Lietuvos ekonomika vysis senąsias ES nares, infliacija šalyje tikrai turėtų būti natūralesnis procesas nei prieš keletą matų vyravusi defliacija.
1.3 lentelė Vartojimo prekiø ir paslaugø kainos* LLRI** HBM „Nord/LB“ FM VB EK „Nordea“ TVF
2004
2005
2,9 (2,5) 3,0 (2,5) 2,9 (2,9) 2,9 (2,7) 2,9 (1,5) 1,2 (1,0) 1,2 (1,0) 1,2 (0,6)
3,28 (2,8) 3,2 2,9 (2,1) 2,2 (2,6) 2,8 (2,0) 2,9 (2,2) 2,4 (2,6) 2,9 (2,5)
* skliausteliuose pateikiamos ankstesnės prognozės ** metų pabaigoje Santrumpos: FM – Finansų ministerija, VB – Vilniaus bankas, EK – Europos Komisija81, HBM – „Hansabankas“ Markets82, LLRI – Lietuvos laisvosios rinkos instituto tyrimas, „Nordea“83, „Nord/LB“ – „Nord/LB“ Lietuva84, TVF – Tarptautinis valiutos fondas85.
1.4. Nedarbo rodiklius toliau mažina ekonomikos augimas ir emigracija Nedarbo lygis suprantamas kaip bedarbių – darbingo amžiaus asmenų, neturinčių darbo ir ieškančių jo, bet nebūtinai užsiregistravusių Darbo biržoje – skaičiaus ir darbo jėgos santykis. Darbo jėga – tai visi darbingo amžiaus gyventojai. LLRI tyrimo dalyviai buvo prašomi įvertinti realų nedarbo lygį šalyje.
Nors auganti konkurencija muša vežimų kainas, kai kurie vežikai, argumentuodami augančiomis naftos kainomis, visgi mano jas kilsiant. UAB „Vilniaus dobilas“ prezidentas Remigijus Žitkevičius teigia, kad dėl išaugusių kuro kainų vežimo paslaugos turėtų brangti apie 15–20 proc. ELTA, 2004-07-05; Jakubauskas R. Taksi – pabrango, vežėjai autobusais – lūkuriuoja.– Verslo žinios, 2004-10-04. 80 Lietuvos statistikos departamentas, „Rugpjūčio mėn. Lietuvoje užfiksuota 0,4 procento defliacija“, 2004-09-08. 81 Kainų augimas apskaičiuotas visai pramonei, išskyrus statybas. Eurostat Euro-Indicators, „Industrial producer prices stable in euro-zone and EU25“, 2004-08-03. 82 European Commission, Economic Forecasts 2004-2006. 83 Hansabank Markets, „Baltijos regiono apžvalga“, 2004-11-08, p. 25. 84 Nordea, „Economic Outlook“, 2005 02, p. 37. 85 Nord/LB Lietuva, „Lietuvos ekonomikos apžvalga“, 2005/3, 2005-04-13. 86 International Monetary Fund, World Economic Outlook, April 2005, p. 217, http://www.imf.org/external/pubs /ft/weo/2004/01/pdf/appendix.pdf. 79
20
MAKROEKONOMIKA
Tyrimo duomenimis, stabiliai ir sparčiai augant ekonomikai padėtis darbo rinkoje ir toliau gerėja. Pasak rinkos dalyvių, 2004 m. pabaigoje nedarbo lygis buvo 9,6 proc., palyginti su 11 proc. 2003 m. pabaigoje. Tikimasi, kad nedarbas ir toliau gan sparčiai mažės ir 2005 m. pabaigoje sudarys 8,4 proc. 1.6 grafikas Nedarbo lygis, proc. 24 20 16 12 8
15,3 13,0
16,1
17,5
14,1
13,9
12,6 12,4 10,5
13,0*
12,9
12,7
11,0
11,4 9,6
10,9
8,4
4 0
1997 1998 1999 2000 2001 2002 2003 2004 2005p LLRI tyrimas
LSD/FM**
**2004-2007 m. prognozės – vidutinis metinis nedarbo lygis Šaltiniai: Lietuvos laisvosios rinkos institutas, Lietuvos finansų ministerija, Lietuvos statistikos departamentas.
Nedarbo mažėjimą veikia besitęsianti ūkio plėtra ir viltis, kad įmonių padėtis ir toliau gerės (žr. 3.1 skirsnį). Nedarbo duomenis taip pat gana smarkiai koregavo lietuvių migracija į ES darbo rinkas. Jau po gegužės 1 d. į ES šalis plūstelėjo banga norinčių užsidirbti Lietuvos piliečių. Manoma, kad šiuo metu užsienio šalyse dirba apie 200–300 tūkstančių Lietuvos gyventojų, ir jų kasdien daugėja. Kita vertus, mažinti nedarbą trukdo verslui ir darbui nepalankūs mokesčių politikos pakeitimai (žr. 1.5 skirsnį), griežtinamas darbo santykių reguliavimas (žr. toliau). Nedarbo mažėjimą stabdo ir 2004 m. gegužės 1 d. vėl padidintas privalomasis minimalus atlyginimas nuo 450 iki 500 Lt.87 Nuspręsta nuo šių metų liepos mėnesio minimalų atlyginimą kelti dar 10 proc. Tokie sprendimai ne tik žlugdo smulkųjį verslą
Lietuvos regionuose, bet ir toliau riboja nekvalifikuotų darbuotojų, kurie sudaro didžiausią bedarbių dalį, paklausą 88. Būtent didelis nekvalifikuotų bedarbių skaičius bei kvalifikuotų specialistų stoka yra kitos svarbios nedarbo mažėjimo kliūtys. Personalo specialistų teigimu, tinkamų darbininkų stygių nuolat jaučia statybos, siuvimo, automobilių, tekstilės, baldų pramonės, konditerijos įmonės89. Taigi esamas nedarbo lygis nereiškia, kad nėra laisvų darbo vietų. Darbo biržos duomenimis, laisvų darbo vietų praėjusių metų pabaigoje buvo dešimtadaliu daugiau nei registruotų bedarbių. Išliekantis aukštas nedarbo lygis rodo, kad trūksta galinčiųjų tas laisvas vietas užimti. Taigi pagrindine problema šiandien tampa ne nedarbas, o kvalifikuotos darbo jėgos trūkumas. Į klausimą „Ar paskutiniu metu įmonėse jaučiamas kvalifikuotų darbuotojų trūkumas?“ tyrimo dalyviai beveik vienbalsiai atsakė teigiamai, neretai pabrėždami, kad „net labai“. Ir nors nekvalifikuota darbo jėga pirmoji siekia pasinaudoti geriau apmokamomis galimybėmis kitose ES šalyse, šiuo metu labai jaučiama ir ryški kvalifikuotos darbo jėgos migracija į vakarus, aitrinanti problemą Lietuvos darbo rinkoje. Kone pagrindinė tokios situacijos priežastis – neefektyvi Lietuvos švietimo sistema ir didelis atotrūkis tarp studijų programų ir darbo rinkos poreikių90. Europos švietimo fondo duomenimis, Lietuva Europoje pirmauja pagal specialistų, turinčių aukštąjį išsilavinimą, skaičių. Deja, darbdaviai jų įgytas profesines žinias linkę vertinti gana skeptiškai. Pasaulio banko studijoje skelbiama, kad Lietuva taip pat „pirmauja“ ir pagal žmonių, turinčių aukštąjį išsilavinimą, ir dirbančių tokio išsilavinimo nereikalaujančiose darbo vietose – kad ir tekstilės pramonėje – skaičių.91 Visos apžvelgtos institucijos sutinka dėl bendrų darbo rinkos tendencijų ir prognozuoja tolesnį nedarbo mažėjimą. Kaip ir anksčiau, rinkos dalyvių nedarbo lygio prognozės yra mažesnės ir už oficialiąsias, SD ir FM skelbiamas šalies prognozes (žr. 1.6 grafiką)92, ir už kitų institucijų prognozes. Reikia paminėti, kad
87 Europos prognozavimo tinklas (EPT) prognozuoja, kad brangesnė nei 50 JAV dolerių nafta pasaulinį infliacijos lygį 2004–2008 m. padidins 0,7 proc. ELTA, „EPT: brangesnė nei 50 JAV dolerių nafta sumažins pasaulinį BVP“, 2004- 10-11.. 88 2003 m. rugsėjo 1 d. minimalus atlyginimas buvo pakeltas nuo 430 iki 450 Lt. 89 SD gyventojų užimtumo tyrimo duomenimis, profesijos neturintys asmenys sudaro beveik pusę visų bedarbių. 90 ELTA, „Vilniuje vienam bedarbiui – trys laisvos darbo vietos statyboje“, 2004-09-06. 91 Socialinės analizės ir konsultavimo centro (SAKC) projekto „Žmogiškųjų išteklių plėtros būklės Lietuvoje įvertinimas“, atlikto 2003 m. Socialinės apsaugos ir darbo ministerijos bei Lietuvos darbo rinkos mokymo tarnybos užsakymu, išvadose teigiama, kad Lietuvoje maždaug 46 proc. dirbančiųjų turi aukštojo išsilavinimo diplomus, apie 70 proc. aukštąjį išsilavinimą turinčių žmonių niekada nedirbo pagal specialybę, o realus tokios kvalifikacijos specialistų poreikis siekia 25 proc. Taip pat žr. „Veidas“, 2004 -07-29, p. 31–32. 92 “Lithuania: Investment Climate Assessment”, The World Bank, December 2004
MAKROEKONOMIKA
21
Nedarbo lygis, proc. 20 16 12
9,4
8 4 0
Taigi palyginti su kitų institucijų prognozėmis, rinkos dalyvių prognozės yra ganėtinai žemos (žr. 1.4 lentelę), tačiau reikia atkreipti dėmesį į tai, kad dauguma institucijų pateikia vidutinio metinio nedarbo lygio prognozes, o rinkos dalyviai prognozuoja nedarbo lygį metų pabaigoje. Rinkos dalyvių tyrimo rezulta-
17,9 18,7
4
5,9
6,1
9,1
9,7
10,6 10,8
Lenkija
* 2004 m. liepos mėnesį. ** užimtumo tyrimo duomenimis, skliausteliuose pateikiamos ankstesnės prognozės. Santrumpos: „Nord/LB“ – „Nord/LB Lietuva“94 FM – Finansų ministerija 95, „Nordea“ 96, LLRI – Lietuvos laisvosios rinkos instituto tyrimas, HBM – „Hansabank Markes“97, EK – Europos Komisija98
1.7 grafikas
Slovakija
10,4 (11,2) 10,2 (10,5) 9,0 (9,2) 8,4 (8,9)
Ispanija
10,2 (10,6) 10,9 (10,3)
Lietuva
10,8 (11,4) 11,4 (11,3) 11,3 11,2 (11,6) 11,0 (11,5) 10,6 (10,0) 9,6 (9,6)
Latvija
2005
ES vidurkis
EK FM** „Eurostat“* HBM „Nordea“ „Nord/LB“ LLRI
2004
Estija
Nedarbo Lietuvoje prognozës, proc.
Slovënija
1.4 lentelė
Nors nedarbas Lietuvoje vis dar vienas didžiausių Europos Sąjungoje (Lietuvą lenkia tik Lenkija (2004 m. 19 proc., 2005 m. prognozė – 18,7 proc.) ir Slovakija (atitinkamai 18,4 proc ir 17,9 proc.) ir Ispanija (2005 m. prognozė – 10,8 proc.)), jis sparčiai mažėja (žr. 1.7 grafiką). „Eurostat“ Lietuvoje (kartu su Estija bei Slovakija) praeitais metais užfiksavo žymiausią nedarbingumo sumažėjimą ES. „Eurostat“ duomenimis, nedarbas Lietuvoje 2004 m. liepos mėnesį buvo 11,3 proc., o tuo pat metu 2003 metais – 12,6 proc.99.
Vengrija
Remdamasi Statistikos departamento užimtumo tyrimo rezultatais, Finansų ministerija skelbia, kad vidutinis metinis nedarbo lygis nukrito nuo 12,4 proc. 2003 m. iki 11,4 proc. 2004 m. nedarbo lygis, FM ekspertų nuomone, per 2005 metus turėtų sumažėti dar puse procento – iki 10,9 proc.93.
tai artimesni tik „Nord/LB“ specialistų prognozėms. Dauguma kitų institucijų, tarp jų ir Europos Komisija bei LR finansų ministerija, tikisi šalyje panašaus – ir maždaug 1,5-2 proc. didesnio nei rinkos dalyvių prognozuojamo - nedarbo lygio. Visos institucijos laukia tolygaus nedarbo mažėjimo šiais bei kitais metais. Nors nė viena institucija neprognozavo nedarbo lygio augimo, kelios visgi kėlė savo ankstesnes nedarbo prognozes: „Nord/LB“ net dukart koregavo savo 2004 m. prognozes – pirmą kartą nuo 8,7 proc. iki 10 proc., o 2005 m. balandžio mėn. (ex poste vertinimu), dar kartą – iki 10,6 proc. FM taip pat didino ir savo praėjusių metų vertinimus, ir šių metų prognozes. Visi kiti pozityviau vertino Lietuvos darbo biržos dinamiką ir mažino nedarbingumo procentą.
Kipras
Darbo biržos (DB) rodikliai LLRI tyrimuose nebenaudojami, kadangi nuo 2004 m. sausio mėnesio Darbo birža skaičiuoja nedirbančių asmenų procentą nuo darbingo amžiaus gyventojų skaičiaus, o dauguma tarptautinių institucijų bei LLRI – bedarbių skaičiaus ir darbo jėgos santykį. Tad dėl skirtingų skaičiavimo metodų galutiniai DB bei LLRI duomenys negali būti lyginami. Kaip oficialų Lietuvos nedarbingumo rodiklį šiame tyrime naudosime Finansų ministerijos skelbiamą skaičių.
Šaltinis: Commission‘s Autumn Economic Forecasts 2004-2006, European Commission, Oct 2004.
Nustatomas pagal gyventojų užimtumo tyrimą. Tai yra vienos didžiausių nedarbo lygio Lietuvoje prognozių (žr. lentelę 1.4). LR finansų ministerija, „Lietuvos ūkio plėtros prognozė 2004–2007 metams“, 2004-09-16. 95 Nord/LB Lietuva, „Lietuvos ekonomikos apžvalga“, 2005/3, 2005- 04- 13, http://www.nordlb.lt/files/Ataskaitos/Lithuanian/plsa_2004_i.pdf 96 LR finansų ministerija, „Lietuvos ekonominių rodiklių projekcijos 2005-2008 metams“, 2005-04. 97 Nordea, Economic Outlook, Feb 2005, p. 37. 98 Hansabank Markets, The Baltic Outlook, 2004- 07-16, p. 1. 99 European Commission, April 2005. 93 94
22 1.5. Mokesčių našta didės LLRI tyrimo dalyviai vertina mokesčių naštą kaip visų mokestinių valstybės bei savivaldybių biudžetų ir fondų pajamų santykį su bendruoju vidaus produktu. Rinkos dalyvių nuomone, 2004 m. mokesčių našta sudarė 35,4 proc., o šiais metais ji turėtų kilti iki 36,3 proc. Ex poste vertinimu, 2003 m. mokesčių našta sudarė 35 proc., ir prieš metus rinkos dalyviai prognozavo, kad per 2004–2005 metus jis nekis. Vis dėlto prieš pusę metų rinkos dalyviai pakėlė mokesčių naštos prognozę beveik pusantro procento; jų retrospektyviais vertinimais, mokesčių našta 2004 m. sudarė 35,4 proc. Mokesčių našta ir mokesčių sistemos reforma yra tapusios pagrindinėmis – ir jau gana skaudžiomis – diskusijų temomis tiek tarp šalies ekonomistų, tiek ir tarp politikų ar visuomenės veikėjų. Dauguma sutinka, kad didžiausią įtaką mokestinių prognozių ir vertinimų kaitai turi Vyriausybės mokesčių politika: pernai dėl Lietuvos narystės Europos Sąjungoje, šiemet bandant spręsti vidaus ir šalies konkurencingumo problemas. Ankstesniuose LLRI tyrimuose buvo kartota, kad mokesčių našta šalyje buvo nusistovėjusi, nes, nors mokesčiai ir didėjo, jų augimą atsvėrė gana sparti ūkio plėtra. Sėkmingai plėtojant ūkį, didėjančią mokesčių naštą gali sumažinti augančios pajamos iš neapmokestinamos arba mažesniais tarifais apmokestinamos veiklos ir kitų šaltinių. Tačiau šiemet, kai yra tikimasi šiek tiek lėtesnio ekonomikos augimo, mokesčių našta bus juntama stipriau, nes nebandoma kompensuoti dėl narystės ES didėjančių mokesčių, mažinant juos kitose sferose, ir apskritai neapsisprendžiama kokią mokesčių politiką vykdyti (jei vykdyti) ir kokius mokesčius mažinti (ir/ar didinti). Mokesčių vertinimui įtakos vis dar gali turėti Gyventojų pajamų mokesčio įstatymas, kuriame numatoma, kad nuo 2003 m. tiesioginę mokesčių naštą padidino pakeisti mokesčių tarifai ir pablogėjusios individualiųjų įmonių apmokestinimo sąlygos.100 Labiausiai didelius mokesčių naštos rodiklius veikia su darbo santykiais susijusių pa-
MAKROEKONOMIKA jamų apmokestinimas 33 proc. tarifu. Šis tarifas taip pat taikomas individualios veiklos pajamoms (su išimtimis) ir visoms kitoms pajamoms, išskyrus numatytas neapmokestinamas pajamas, tokias kaip pašalpos, indėlių palūkanos, stipendijos ir kt. Mokesčių naštą taip pat sunkina ir iki minimalaus ES lygio toliau didinami akcizų tarifai (nuo 2004 m. sausio buvo padidintas dyzelino akcizas, nuo kovo – cigarečių akcizai), pridėtinės vertės mokesčio naujovės. Nuo 2004 m. gegužės 1 d. šiluminei energijai taikytas lengvatinis 9 proc. PVM ir 5 proc. kalendorių tarifas padidinti iki 18 proc. Taip pat nuo gegužės 1 d. 18 proc. PVM tarifu pradėta apmokestinti mokslinius tyrimus. Nuo 2004 m. pradžios mokesčių naštą sunkina ir pagal naują žemės verčių žemėlapį padidinti žemės mokesčiai101, taip pat pradėtas taikyti 5 proc. PVM už vaistus ir medicinos prekes. Nuo 2004 m. sausio 1 d. pagal 2003 m. kovo mėnesį priimtą naujos redakcijos Autorių teisių ir gretutinių teisių įstatymą tuščių vaizdo ir garso kasečių bei kompaktinių plokštelių gamintojai arba jų importuotojai pradėjo mokėti 6 proc. laikmenos didmeninės kainos dydžio mokestį. Nuo 2003 m. rugsėjo 1 d. importuojami cukraus pakaitalai, sirupai bei kiti cukraus turintys gaminiai apmokestinti 20-100 proc. cukraus mokesčiu, priklausomai nuo turimo cukraus kiekio102. Nuo 2005 m. gegužės 1 d., pagal Cukraus ir perdirbtų produktų atsargų deklaravimo ir perteklinių atsargų apmokestinimo įstatymą, Lietuvos cukraus gamintojų sukaupta perteklinė produkcija turėjo būti pradėta apmokestinti ES importo muitais. Šis terminas 2005 balandžio mėn. buvo pratęstas iki 2005 lapkričio 30 d.103. ES mokesčių harmonizavimas taip pat sunkins mokesčių naštą, ir galbūt ne tik tose srityse, kuriose buvo įsipareigota pasirašant narystės sutartis. Didelius mokesčius turinčios ES senbuvės, ypač Švedija, Prancūzija ir Vokietija, bijodamos verslo perkėlimo į mažesnių ir / ar lankstesnių mokesčių šalis, siekia derinti ir įmonių pelno mokesčius.
Eurostat, „July 2004: Euro-zone unemployment stable at 9,0%,“ 2004-09-01, http://europa.eu.int/comm/eurostat/Public/datashop/printproduct/EN?catalogue=Eurostat&product=3-01092004-EN-AP-EN&mode=download. 101 Šiame įstatyme anksčiau galiojusius 8 tarifus pakeitė du – 15 ir 33 proc. tarifai. Pirmuoju dabar apmokestinamos pajamos iš paskirstytojo pelno, taip pat jūrininkų, sportininkų, atlikėjų pajamos, honorarai, pagal autorines sutartis gaunamos pajamos, pajamos iš turto nuomos ar jo pardavimo, pensijų, gyvybės draudimo išmokos. Ypač padidėjo individualiųjų įmonių mokesčių naštą – jos privalo mokėti ne tik 15 proc. pelno mokestį, bet ir pajamų mokestį nuo tos pajamų dalies, kurią įmonės savininkai naudoja savo reikmėms. (Jau trejus metus individualiosios įmonės moka 15 proc. socialinio draudimo mokestį nuo deklaruojamų pajamų papildomai pensijų daliai.). 102 2002 m. spalį Vyriausybei patikslinus nutarimą dėl žemės įvertinimo tvarkos, nuo 2003 m. žemės mokestis skaičiuojamas nuo nekilnojamojo turto vidutinės rinkos vertės sudarant žemės verčių žemėlapius. 103 Šiuo metu cukraus mokestis sudaro 1 litą už kilogramą produkcijos. 100
MAKROEKONOMIKA
23
„Eurostat“ duomenimis, 2003 m. mokesčių našta Lietuvoje buvo 28,7 proc. BVP – tai yra mažiausias rodiklis Europos Sąjungoje104. Tačiau lyginti Lietuvoje taikomą mokesčių tarifą su kitų Europos valstybių tarifu yra sudėtinga, kadangi mokesčių sistemos daugelyje ES šalių yra progresinės, o euro perkamoji galia skirtingose šalyse yra nevienoda. Todėl prasmingiau būtų lyginti, kokiu mokesčio tarifu Europos šalys apmokestina vidutinį darbo užmokestį. Pagal šį rodiklį Lietuva yra antra Europos Sąjungoje. 1.8 grafikas Santykinë mokesèiø naðta 50 40 30
36 31
32
30
33
41
41
36
36
37
37
37
34
35 33
35
36
35
34
20 10 0
1994 1995 1996 1997 1998 1999 2000 2001 2002 2003 2004 2005p
LLRI apskaièiuota, % BNP LLRI tyrimas, % BNP Šaltinis: LLRI, LLRI tyrimas
Svarbu paminėti ir kakofonijos valdančiojoje koalicijoje įtaką Lietuvos mokestinės sistemos vertinimams. Praėjusiųjų metų pabaigoje buvo nutarta neįvesti progresinio pajamų mokesčio bei atsisakyti kelių mokesčio. Tačiau dabartinė Vyriausybė jau atšaukė įstatymo patvirtintą kelių mokesčio panaikinimą, ir dabar planuojama šį mokestį palikti net iki 2007 m. pabaigos, pervadinus jį solidarumo mokesčiu. Iš socialdemokratų stovyklos jau ir vėl pasigirsta kalbų ir apie progresinius mokesčius.105 Progresiniai pajamų mokesčiai jų administravimą daro itin komplikuotą ir brangiai kainuojantį, skatina vengti mokesčių, perkelti gamybą į mažesnių mokesčių šalis. Daug efektyvesnis mokesčių naštos mažinimo ir sistemos optimizavimo būdas yra gyventojų pajamų mokesčio tarifo keitimas. Džiugu, kad pagaliau, atrodo, tarifus ketinama mažinti nuo 33 proc. iki 24 proc. Apmaudu, kad tam daryti pasirinktas neefektyviausias būdas – t. y. tarifas bus mažinamas ne iš
karto, o palaipsniui, per trejus metus: nuo 2006 metų liepos 1 dienos jis būtų sumažintas iki 27 proc., o nuo 2008 metų pradžios – iki 24 procentų. Siekiant atsverti biudžeto praradimus, įvedamas „solidarumo“ mokestis, o komercijai naudojamas gyventojų nekilnojamasis turtas pradedamas apmokestinti metiniu 1 proc. vertės mokesčiu. Jis bus apmokestinamas tomis pačiomis sąlygomis, kaip ir įmonių naudojamas turtas. Nuomojami butai nebus apmokestinami. Taigi mokesčių našta nemažės, tiesiog jos svoris vėl bus perdalinamas skirtingiems mokesčiams. Tai atsispindi ir rinkos dalyvių pateiktuose rodikliuose. Jų nuomone, mokesčių našta šiais metais turėtų ne mažėti, o priešingai – didėti. 2005 metais tikimasi vėl vos ne procentu augsiančios mokesčių naštos. Rinkos dalyvių nuomone, 2005 m. mokesčių naštos lygis pasieks 36,3 proc. Tai tik parodo, kad rinkos dalyvių lūkesčiai negerėja: praeityje, pasak jų, mokesčių našta buvo mažesnė nei ji bus artimoje ateityje. Tokie vertinimai yra priešingi tiems, kuriuos siūlo Vyriausybė, tikinanti, kad mokesčių sistemos reforma mokesčių naštą mažins. Nuo 1994 m. LLRI skaičiuoja mokesčių naštos dydį, remdamasis oficialiais statistiniais bendrojo nacionalinio produkto (BVP plius grynosios pajamos, gautos iš užsienio) ir biudžeto pajamų rodikliais. LLRI tyrimo duomenimis, oficialia bendrojo nacionalinio produkto prognoze ir biudžeto pajamų rodikliais paremti skaičiavimai rodo, kad šiemet mokesčių našta yra mažesnė negu praėjusiais metais ir sudaro 34 proc. BVP. Reiktų atkreipti dėmesį į tai, kad nors mokesčių naštos procentinė išraiška ir nežymiai sumažėjo, absoliutus mokesčių dydis bus didesnis: mokesčių našta yra skaičiuojama nuo BVP – šis rodiklis vis dar sparčiai auga, o mokesčių naštos rodiklis atitinkamai tiek nesumažėja. Vyriausybė tikina, kad tam tikrus mokesčius, o būtent – akcizo, ji didino įpareigota narystės Europos Sąjungoje sutarties. Tačiau biudžetas sudarytas ne vien iš akcizų – juos didindama valstybė galėtų sumažinti kitų mokesčių naštą. Belieka apgailestauti, kad kiekvienas pareiškimas apie kokio nors mokesčio sumažinimą yra iškart palydimas panešimo, kad šiais ar kitais metais bus įvestas naujas mokestis. Tai neskatina ir rinkos dalyvių pasitikėjimo.
104 Mokesčio tarifas nustatomas pagal didžiausią importo mokestį per metus nuo 2004 m. gegužės 1-osios, papildomai mokant 4,18 Lt mokestį už 100 kg baltojo cukraus. Verslo žinios, „Cukraus atsargas apmokestins specialiu mokesčiu.“, 2004- 06-28; Reuters-ELTA, „Naujosios ES narės nors bent trumpam išvengė baudų dėl cukraus“, 2005-04-19. 105 Eurostat News Release, „Taw burden in 2003 ranged from 29% of GDP in Lithuania and Latvia to 51% in Sweden“, Jan 28, 2005.
24
MAKROEKONOMIKA
LLRI tyrimo mokesčių naštos rodiklis atspindi tik tiesioginę mokesčių naštą. Tačiau ne mažiau svarbi yra netiesioginė mokesčių našta, kuri yra susijusi su mokesčių administravimo ir mokesčius administruojančių institucijų išlaikymo išlaidomis. Mokesčių administravimą sunkina sudėtingos mokesčių taisyklės, daugybė išimčių, įstatymų nuostatų interpretavimo vingrybės. Mokesčių administratoriams suteikta daug įgaliojimų, o mokesčių mokėtojų teisės nėra tinkamai įtvirtintos. Nuo 2004 m. gegužės 1 d. įsigaliojo Mokesčių administravimo įstatymas. Nors šiame įstatyme siekiama įtvirtinti naują mokesčių administratorių ir mokėtojų santykių modelį, jame nepakankamai ribojamos mokesčių inspektorių galios, nesumažinami privačių verslo subjektų įpareigojimai teikti informaciją, nepagrįstai ir netikslingai didinamos su informacijos pateikimu susijusios mokesčių mokėtojų išlaidos, skatinima mokėti nepriimtinus mokesčius. Siūlomų įstatymo nuostatų įgyvendinimas neleis sumažinti netiesioginės mokesčių naštos106. Taigi, kaip rodo tyrimas, vien balanso tarp mokesčių didinimo ir šį faktą švelninančių veiksnių, arba tarp vienų mokesčių mažinimo ir kitų mokesčių didinimo, neužtenka. Norint užtikrinti šalies konkurencingumą tarptautinėje rinkoje, reikia vykdyti nuoseklią mokesčių politiką ir imtis struktūrinių mokesčius mažinančių priemonių. Apibendrinant reikėtų pasakyti, kad mokesčių našta dėl Vyriausybės mokesčių politikos ir narystės ES šiemet
turėtų būti labiau juntama. Kaip rodo LLRI tyrimas, laukiamas vis dar spartus BVP augimas ir vėl turėtų šiek tiek atsverti 2004–2005 m. įsigaliojančių mokesčių didinimą. Nepaisant to, rinkos dalyvių nuomone, šiemet mes pajausime sunkėjančią mokesčių naštą.
1.6. Litas ir JAV doleris Nuo 2003 m. pradžios JAV dolerio vertė euro atžvilgiu mažėjo. Keletą kartų vertės kritimas stabtelėjo, bet neilgai. Prieš keletą mėnesių pradėjęs po truputį kilti, JAV dolerio kursas spalio pradžioje vėl krito žemiau 2,80 litų ribos. LLRI tyrimo dalyvių vertinimu, 2004 m. pabaigoje vienas JAV doleris buvo vertas 2,62 lito. Tai yra mažiau nei rudenį prognozuotas 2,88 lito kursas ir žymiai mažiau nei prieš metus prognozuotas 3,33 lito kursas. Tačiau jis yra toks pat kaip ir 2004 m. sausio mėnesį rinkoje užfiksuotas JAV dolerio ir euro kursas. Taigi rinkos dalyvių vertinimai nėra netikėti, jie neprognozuoja didesnio JAV dolerio vertės pokyčio, jų vertinimas atitinka šios valiutos vertės svyravimus rinkoje. Rinkos dalyviai prognozuoja, kad šiais metais JAV dolerio vertė lito atžvilgiu nesikeis ir 2005 m. pabaigoje sudarys 2,7 lito. Tai yra žemesnė prognozė nei siūlyta praėjusiame tyrime, kai rinkos dalyviai tikėjosi, kad dolerio kursas kils iki 2,92 proc. Nors tyrimo dalyviai nesitiki tolesnio JAV valiutos kurso kritimo artimoje ateityje, tačiau jie taip pat nemano, kad šis piniginis vienetas sustiprės.
LLRI tyrimo dalyviø vertinimai ir prognozës
BVP augimas Ðeðëlinės ekonomikos dalis BVP Eksporto augimas Importo augimas Vartotojø kainø pokytis Gamintojø kainø pokytis Nedarbas Mokesèiø naðta Lito ir JAV dolerio kursas
106 107
2003
2004
Vertinimas
Vertinimas
procentais
metinis pokytis absoliuèiai
Patik. prog.
2005
procentais
metinis pokytis absoliuèiai
7,39 19,85 11,98 11,35 0,81 0,8 10,97 35 2,88
6,82 20,81 13,22 12,42 2,96 3,3 9,6 35,4 2,62
-7,7% 4,8% 10,4% 9,4% 265,4% 312,5% -12,5% 1,3% -9,0%
-0,57 0,96 1,24 1,07 2,15 2,5 -1,37 0,45 -0,26
6,32 20,58 13,84 12,64 3,28 3,6 8,4 36,27 2,7
-7,3% -1,1% 4,7% 1,8% 10,8% 9,1% -12,5% 2,3% 3,1%
-0,5 -0,23 0,62 0,22 0,32 0,3 -1,2 0,82 0,08
Staniulytė, T. Socdemai neatsisakė progresyvinių mokesčių. –Verslo žinios, 2005-04 -11. Išsamiau apie LLRI išvadas dėl naujojo Mokesčių administravimo įstatymo projekto http://www.lrinka.lt/Tyrimai/Mokest/Mokadmin.phtml.
NAMØ ÛKIAI
2 skyrius. NAMŲ ŪKIAI 2.1. Namų ūkių pajamos auga lėtai, bet tolygiai LLRI tyrime namų ūkio pajamos – tai vidutinės piniginės pajamos, kurias per mėnesį gauna namų ūkis. Jos apima pinigines įplaukas: darbo užmokestį, pensijas, stipendijas, palūkanas, dividendus, pajamas už nuomą, dovanas, laimėjimus, kyšius, pašalpas – ir kitas deklaruojamas bei nedeklaruojamas įplaukas. Namų ūkis suprantamas kaip asmuo ar jų grupė, turinti bendrą biudžetą. Augant ekonomikai, gyventojų finansinė padėtis nuolat gerėja. 2003 m. pabaigoje, santūriai vertindami 2003 m. pajamas, rinkos dalyviai tikėjosi didelio 2004 m. namų ūkių pajamų augimo. 2004 m. viduryje rinkos dalyviai gerokai sumažino prognozuojamąsias pajamas, tačiau naujausiame tyrime jų prognozė vėl optimistinė. Rinkos dalyvių ex poste vertinimu, vidutinės piniginės namų ūkio pajamos 2004 m. buvo didesnės, nei tikėtasi ir sudarė 1980 Lt/mėn. Palyginti su 2003 m., namų ūkų pajamos išaugo 4 proc. Pajamos vienam namų ūkio nariui buvo 776 Lt/mėn. Taigi praeitais metais prognozavę namų ūkio pajamų augimo sąstingį, šįkart rinkos dalyviai optimistiškesni. Jie kelia savo 2004 m. rodiklius apie 3 proc., teigdami, kad vieno žmogaus disponuojamos piniginės pajamos per praėjusius metus išaugo beveik trisdešimčia litų. Apžvelgus kasmetinius namų ūkių pajamų įverčius, galima pastebėti, kad namų ūkių pajamos pastaruosius penkerius metus labai stabiliai augo (žr. 2.1 grafiką). Tačiau paskutinis 2004 m. pajamų įvertinimas – 1980 Lt/mėn. – neatitinka ankstesnės rinkos dalyvių prognozės – tai daug mažiau nei tikėtasi 2003-aisiais, kai tyrimo dalyviai prognozavo 2004 m. namų ūkių pajamas išaugsiant iki 2058 Lt/mėn.
25
Didžiausią įtaką prieš pusę metų smarkiai mažintai prognozei, pačių rinkos dalyvių nuomone, turėjo nepasiteisinę narystės Europos Sąjungoje lūkesčiai. Dauguma tikėjosi staigaus pajamų šuolio, susijusio su įstojimu į ES ir, šių lūkesčių vedini, optimistiškai ir stipriai didino savo 2004 m. prognozes. Jokių šuolių per pirmuosius mėnesius nepastebėję tyrimo dalyviai prognozę sumažino. Kita vertus, daug faktorių lėmė realų pajamų augimą per praėjusius metus; šį augimą atsispindi ir optimistinis 2004 m. vertinimas, ir 2005 m. prognozė. Vien sparčiai mažėjantis nedarbas ir darbo užmokesčio augimas turėjo pozityviai veikti namų ūkių pajamų augimo vertintojus. Be to, praeitais metais vėl buvo didinamos pensijos, įvairios socialinės pašalpos, kitos biudžeto išmokos. Senatvės pensijos 2004 m. didėjo net tris kartus. Nuo 2004 m. kovo 1 d. padidėjo asmenų, turinčių būtiną stažą ir gaunančių pačias mažiausias (mažesnes nei 325 litų) pensijas, senatvės ir invalidumo pensijos. Taigi mažosios pensijos padidėjo vidutiniškai 20 litų. Balandžio mėn. 20-čia litų (iki 172 Lt/mėn.) padidintos bazinės pensijos, o rugsėjo mėn. dar kartą – nuo 901 Lt iki 990 Lt – padidintos draudžiamosios pajamos, nuo kurių skaičiuojama papildomoji senatvės pensijos dalis1. Padidinus draudžiamąsias pajamas, vidutinė senatvės pensija pakilo vidutiniškai 28 Lt (nuo 344 iki 372 Lt)2. Šių metų vasario mėn. vidutinė senatvės pensija jau buvo apie 395 Lt/mėn. Praeitais metais augo ir invalidumo bei našlaičių pensijos. Vaikams našlaičiams mokamos našlaičių pensijos padidėjo nuo 25 proc. mirusiajam priklausiusios ar galėjusios priklausyti pensijos iki 30 proc.. Motinystės (tėvystės) pašalpa padidinta iki 70 proc. pašalpos gavėjo kompensuojamojo uždarbio. Nuo 2004 m. liepos 1 d. buvo pradėtos mokėti išankstinės pensijos 30 metų darbo stažą turintiems žmonėms, kuriems iki pensijos liko 5 arba mažiau metų.
1 Draudžiamosios pajamos padidintos beveik dvigubai daugiau nei tikėtasi. Prieš tai jos buvo didintos 2003 m. liepą (nuo 886 Lt iki 901 Lt), po daugiau nei 4 metų pertraukos (prieš tai didinta 1999 m. vasarį). 2 Taip pat išaugo ir „Sodros“ mokamos draudimo pašalpos bei kompensacijos, kurių dydžiai siejami su einamųjų metų draudžiamųjų pajamų dydžiu, išmokamos ligos, motinystės (tėvystės), nelaimingų atsitikimų darbe ar profesinės ligos atvejais.
26
NAMØ ÛKIAI
Kaip ir anksčiau, rinkos dalyviai prognozuoja dvigubai didesnes vidutines pinigines šalies namų ūkių pajamas, nei nurodo oficiali statistika. SD atliekamo namų ūkių biudžeto tyrimo duomenimis, 2004 m. vidutinės piniginės gyventojų disponuojamos pajamos vienam namų ūkio nariui buvo 496 Lt/mėn.3. Ir nors tai yra daug mažesnis rodiklis nei LLRI tyrimo dalyvių įvardintas, jis rodo gana spartų pajamų augimą – namų ūkių biudžeto tyrimo duomenimis, pajamos vienam gyventojui nuo 2003 m. išaugo 8,3 proc. 2.1 grafikas Disponuojamos piniginës pajamos, Lt/mën.* 900 800 700 600 500 400 300 200 100 0
747
597
557
588
647
656
776
834
710
496 350 297
364
349
359
346
384
1997 1998 1999 2000 2001 2002 2003 2004 2005p LLRI tyrimas
SD
* vienam namų ūkio nariui (2003 m. ir 2004 m. duomenys perskaičiuoti remiantis 2001 m. gyventojų surašymo duomenimis apie vidutinės šeimos dydį – 2,55 asmens). Šaltinis: Lietuvos statistikos departamentas, LLRI tyrimas
Skirtumą tarp LLRI tyrimo ir SD namų ūkių biudžetų tyrimo duomenų lemia metodologinė apklausų specifika. Dėl finansinių motyvų SD apklausos apima daugiau skurdesnių namų ūkių. Kita priežastis – dalis gyventojų greičiausiai atsisako dalyvauti apklausose, nenorėdami atskleisti savo tikrosios finansinės padėties, arba apklausose nurodo ne visas pajamas. Tai akivaizdu, pažvelgus į vartojimo rodiklius, kurie dažnai viršija gaunamas pajamas. 2002 m. vasarą LLRI atlikto Lietuvos namų ūkių tyrimo duomenimis4, Lietuvos gyventojai yra linkę nuslėpti iki 37 proc. gaunamų pajamų. Rinkos dalyvių nuomone, gyventojų finansinė padėtis šiais metais turėtų gerėti, tačiau ji nesieks anksčiau prognozuoto lygio. Prognozuojama, kad 2005 m. namų ūkių pajamos augs 7 proc. ir sieks 2127 Lt/
mėn. Pajamos vienam ūkio nariui bus 834 Lt/mėn. Namų ūkių pajamas 2005 m. turėtų didinti įvairios socialinės išmokos ir augantis darbo užmokestis. 2005 m. biudžeto projekte numatyta skirti 41 mln. litų paramą šeimoms, mokant po 50 litų kiekvienam vaikui nuo 3 iki 7 metų. Kompensuojant vystyklų brangimą dėl 18 proc. PVM, nuo sausio 1 dienos nuo 750 iki 1000 litų bus didinama išmoka gimus vaikui. Bus didinama ir parama šeimoms, auginančioms vaikus iki vienerių metų, bei mokamos valstybinės pensijos motinoms, užauginusioms 7 ir daugiau vaikų. Nuo sausio mėnesio turėtų didėti slaugos pašalpos. 2005 m. dar dešimtadaliu turėtų paaugti ir pensijos, – šių metų biudžete pensijoms didinti numatyta per 100 mln. litų.5 Šiais metais nuspęsta padidinti – net du kartus – ir valstybines pensijas asmenims, sužalotiems per 1991 sausio įvykius bei jų šeimos nariams. Tam iš šių metų valstybinio biudžeto bus skirta dar 750 tūkst. litų. Nedarbas ir šiais metais turėtų mažėti, o darbo užmokestis – augti. Kadangi darbo užmokestis sudaro 69 proc. visų disponuojamų pajamų ir yra pagrindinis pajamų šaltinis, tai prognozuojamasis spartesnis atlyginimų kilimas turėtų „kilstelėti“ ir namų ūkių pajamas. 24 proc. namų ūkių pajamų sudarančių socialinių pašalpų skaičius ir vertė taip pat turėtų augti ir didinti bendras namų ūkių pajamas. 2005 m. kovo mėn. pritarta ir Valstybinių šalpos išmokų įstatymo pakeitimo ir papildymo įstatymo projektui. Šalpos pensijos bus skiriamos tiems neįgaliesiems, pripažintiems I ar II grupės invalidais, ir senatvės pensijos amžiaus sulaukusiems asmenims, kurie neturi teisės gauti jokios rūšies pensijų. Šalpos pensijos I ir II grupės invalidams bus pradėtos skirti nuo 2005 m. liepos 1 d., o senatvės pensijos amžiaus sulaukusiems asmenims – nuo 2006 m. sausio 1 d. Kalbant apie namų ūkių pajamų perspektyvas, reiktų paminėti ir SD atliekamą vartotojų nuomonių tyrimą, atspindintį gyventojų požiūrį į artimiausias namų ūkių ir šalies ekonomikos perspektyvas6. Dauguma respondentų tikino, kad namų ūkio finansinė padėtis per praeitus 12 mėnesių nekito, dauguma mano, kad ji nesikeis ir šiemet. Vis dėlto manančių, kad situacija per ateinančius 12 mėnesių blogės, yra mažiausia – 14 proc.7.
Lietuvos statistikos departamentas, Namų ūkių biudžetų 2004 m. tyrimo rezultatai, 2005-04-11, http://www.std.lt. Pagal Pasaulio banko projektą „Būsto programa“. 5 Elta: „Sodra“ išmokėjo 471,4 mln. litų padidintų pensijų”, 2004-11-15. 3 4
NAMØ ÛKIAI 2.2. Darbo užmokestis augo labai nežymiai Po dvejų metų sąstingio, 2004 m., buvo tikimasi spartesnio darbo užmokesčio augimo, tačiau šios viltys nepasiteisino (žr. 2.2 grafiką). LLRI tyrimo metu rinkos dalyviai vertino nurodyto laikotarpio vidutinį mėnesinį atlyginimą už darbą atskaičius mokesčius, gautą pinigais ir nebūtinai deklaruojamą. Rinkos dalyvių nuomone, 2004 m. vidutinis darbo užmokestis padidėjo tik vienuolika litų ir buvo 1052 Lt/mėn. Jau kurį laiką rinkos dalyviai labai optimistiškai prognozuoja ateinančių metų darbo užmokesčio augimą, tačiau pateikia daug mažesnius ex poste metinius įverčius. 2004-ieji buvo ne išimtis. Daugiau nei prieš metus prognozavę, kad 2004 m. vidutinis darbo užmokestis augs net iki 1113 Lt/mėn., tyrimo dalyviai po truputį mažino savo prognozę. Jų ex poste vertinimu, darbo užmokestis praeitais metais augo labai nežymiai – vos vienuolika litų. O šių metų prognozė ir vėl yra didesnė – tyrimo dalyviai 2005 m. tikisi net daugiau nei 8 proc. didesnio vidutinio mėnesinio atlyginimo, sieksiančio 1138 Lt/mėn. 2004 m. mažinta darbo užmokesčio augimo prognozė gali būti tiesiogiai susijusi su anksčiau išaugusiais, bet po 2004 m. gegužės 1 d. neišsipildžiusiais lūkesčiais, kad Lietuvai tapus ES nare atlyginimai staiga ir žymiai kils. Kita vertus (kadangi apie tai buvo nemažai diskutuota vietinėje bei tarptautinėje spaudoje), galbūt buvo laukiama dar didesnės emigracijos bangos ir atitinkamai stipresnės konkurencijos vidinėje darbo rinkoje. Galbūt darbo uždarbio didėjimas tiesiogiai nebuvo juntamas ir dėl didelės mokesčių naštos: bandydami jos išvengti, darbdaviai galėjo dažniau ir drąsiau didinti ne piniginę atlyginimų išraišką, bet įvairius priedus ar priemokas. Tyrimo rezultatai rodo, kad darbo užmokesčio augimą veikia trys pagrindiniai veiksniai: emigracijos ir švietimo sistemos spragų stiprinama darbo
27 jėgos konkurencija, sparčiai mažėjantis nedarbas bei augantis įmonių pelningumas8. Sąlygas kelti atlyginimus sudaro ir dėl naujų technologijų diegimo bei modernizavimo didėjantis įmonių efektyvumas. Vidutinį darbo užmokesčio lygį šalyje kelia ir biudžetinių įstaigų atlyginimų didinimas – nuo gegužės 1 d. darbo užmokestis buvo padidintas vidutiniškai 100 litų daugiau kaip 200 tūkst. biudžetinių įstaigų darbuotojų 9. Darbo užmokesčio dinamiką veikia ir nuolat didinama minimali mėnesinė alga – nuo 2004 m. gegužės 1 d. ji buvo padidinta nuo 450 iki 500 Lt., o nuo šių metų liepos 1 d. augs dar dešimčia procentų. 2.2 grafikas Vidutinis neto darbo uþmokestis, Lt/mën. 1200 1000
911
969
1035
1039
722
800 600
969
955
684
741 692
1041
1052
793
890
1138 889
699
577
400 200 0
1997 1998 1999 2000 2001 2002 2003 2004 2005p LLRI tyrimas
LSD ir FM
Šaltinis: Lietuvos laisvosios rinkos institutas, Lietuvos statistikos departamentas, Finansų ministerija
Statistikos departamento skaičiavimais, 2004 m. neto darbo užmokestis šalies ūkyje, neįskaitant individualiųjų (personalinių) įmonių, per metus išaugo 97 Lt ir sudarė 890 Lt/mėn.10 Kaip ir anksčiau, rinkos dalyvių vertinimas yra didesnis už oficialų rodiklį (žr. 2.2 grafiką). Toks ryškus skirtumas atsiranda dėl metodologinių tyrimo skirtumų. Lyginant SD ir LLRI tyrimo duomenis, būtina atsižvelgti į tai, kad SD skaičiai atspindi tik
Vartotojų pasitikėjimo rodiklis remiasi vartotojų nuomonių tyrimu, kurio metu apklausiama 1200 namų ūkių. Pasitikėjimo rodiklis apima susistemintus atsakymus į 4 klausimus: apie namų ūkio finansinę padėtį, šalies ekonominę padėtį, nedarbo lygio kitimą ir tikimybę sutaupyti per artimiausius 12 mėnesių. 7 Lietuvos statistikos departamentas, 2004 metų statistiniai rodikliai, spaudos konferencija 2005-01- 28, Algirdo Šemetos pranešimas. 8 Ekspertai mano, kad vidutinis darbo užmokestis įvairiuose Lietuvos ekonomikos sektoriuose nuo ES senbuvių atsilieka net 70-90 procentų. Baltinaitė R, Klaipėdoje ima trūkti darbo jėgos. – Klaipėda, 2005- 01-27. 9 Nuo 2004 m. gegužės 1 d. 10 litų padidinta bazinė mėnesine alga; šiuo metu ji yra 115 Lt. Taip pat 0,68 lito padidintas ir bazinis valandinis atlygis. 10 Lietuvos statistikos departamentas, „Darbo užmokestis ketvirtąjį 2004 m. ketvirtį padidėjo“, 2005 02 23. Skaičiuota pagal ketvirtinius duomenis. 6
28 oficialiai deklaruojamą darbo užmokestį, o LLRI tyrimo dalyviai vertina bendrą vidutinį atlyginimą už darbą šalyje, įskaitydami ir oficialiai, ir neoficialiai mokamą atlyginimą pinigais. Taigi LLRI ir SD duomenų skirtumas rodo (gana žymų) neoficialiai mokamų atlyginimų mastą. LLRI tyrimo duomenimis, apie 41 proc. žmonių, oficialiai dirbančių už minimalią algą, gauna atlyginimus „vokeliuose.“ 2003 m. pradžioje Valstybinės mokesčių inspekcijos atlikto tyrimo duomenimis, „vokeliuose“ buvo išmokama apie 30 proc. realiai mokamų atlyginimų11. Kitos institucijos šiais metais irgi prognozuoja spartesnį darbo užmokesčio augimą. Finansų ministerija, remdamasi Statistikos departamento duomenimis, pateikė aukštesnį, 7,9 proc. per metus, vidutinio bruto darbo užmokesčio augimo įvertį nei anksčiau prognozuotasis 6,1 proc., ir tikisi darbo užmokestį augsiant dar sparčiau 2005-aisiais. Vilniaus bankas nekeičia savo praeitų metų viduryje pasiūlytos prognozės ir vis dar pateikia gana aukštus rodiklius: jo teigimu, vidutinis mėnesinis bruto darbo užmokestis 2004 m. augo 9 proc., tiek pat jis turėtų paaugti ir per šiuos metus. 12 „Nord/LB Lietuva“ sumažino savo ankstesnę 2004 m. darbo užmokesčio augimo prognozę puse procento – nuo 8,5 proc. iki 8 proc. Šiais metais „Nord/LB“ specialistai laukia net dešimtadaliu didėsiančio darbo užmokesčio13. „Hansabank“ 2004 m. lapkričio mėnesį mažino savo ankstesnę 2004-ųjų realaus darbo užmokesčio augimo prognozę, tačiau irgi laukia spartesnio – 7,6 proc. – augimo šiais metais14. SEB praeitą rudenį prognozavo, kad realus atlyginimas Lietuvoje 2004 m. augs 6,5 proc., o per šiuos ir ateinančius metus daugiau nei 7 proc.15
NAMØ ÛKIAI Darbo uþmokesèio augimo prognozës VB Nord/LB FM LLRI tyrimas HB SEB
2004
2005
9,0 8,0 (8,5) 7,9 (6,1) 7,0 6,5 (8,1) 6,5
9,0 10 (9,9) 8,8 (6,8) 8,2 7,6 7,0**
Santrumpos: VB – Vilniaus bankas, Nord/LB –Nord/LB Lietuva16, FM – Finansų ministerija, LLRI – Lietuvos laisvosios rinkos instituto tyrimas, HB – Hansabank, SEB – Skandinaviska Enskilda Banken17. ** 2005-2006 metais.
Iš tyrimo rezultatų matyti, kad didžiausią įtaką uždarbio didėjimui šiais metais ir vėl turės mažėsiantis nedarbas ir auganti darbo jėgos paklausa. Darbo užmokestį didina ir kasdien vis auganti konkurencija darbo rinkoje dėl migracijos į kitas ES šalis. Kaip jau minėta pirmojoje dalyje, beveik visi tyrimo dalyviai į klausimą „Ar pastaruoju metu įmonėms trūksta kvalifikuotų darbuotojų?“ vienbalsiai atsakė teigiamai, neretai pabrėždami, kad „net labai“. Mažiausiai uždirbančiųjų pajamos padidės, kadangi patvirtintas sprendimas nuo šių metų liepos mėnesio padidinti minimalią mėnesinę algą nuo 500 iki 550 Lt18. Kita vertus, dėl šio sprendimo dalis nekvalifikuotų arba menkai atlyginamų žmonių gali apskritai netekti realaus arba potencialaus darbo. SD duomenims, minimalią algą gauna maždaug šeštadalis visų dirbančiųjų gyventojų. Didesnes pajamas šiais metais gali gauti ne tik tam tikrų socialinių grupių, bet ir tik tam tikrų profesijų atstovai. Šių metų biudžete numatyta skirti 21,2 mln. litų mokytojų darbo užmokesčiui didinti nuo 2005 m. rugsėjo 1 d. Nuo gegužės mėn. buvo planuojama gydytojų algas pakelti 24 proc., tačiau gydytojų toks siūlymas netenkina- jie siekia, kad atlyginimai kiltų bent 50 proc.19
Čaplikas A., „Nelegalus verslas išsigando perspėjimų“. – Kauno diena, 2004- 01-15. Vilniaus bankas, Lietuvos makroekonomikos apžvalga, Nr. 4 (20), 2005 02, p. 16. 13 Nord/LB Lietuva, „Lietuvos ekonomikos apžvalga“, 2005/3. 14 Hansabank Markets, The Baltic Outlook, 2004 11 15, p. 21. 15 SEB, Baltic Outlook, October 2003, p. 14. 16 Nord/LB Lietuva, “Lietuvos ūkio sektorių apžvalga”, 2004/1, 2004 06, p. 4. 17 SEB, Baltic Outlook, October 2003, p. 14. 18 ELTA, „Pramoninkai ketina apsispręsti dėl minimalios algos didinimo,“ 2004 09 07; Lietuvos žinios, Laima Buzienė “Dideli debatai dėl mažų atlyginimų”, 2004 09 22. Apskaičiuojant politikų, teisėjų, valstybės pareigūnų ir tarnautojų atlyginimus bei priedus už turimus laipsnius, toliau bus naudojama bazinė 430 Lt. alga. Minimali alga nedidinama tiems asmenims, kurių pajamos iš parduotos žemės ūkio produkcijos sudaro daugiau kaip 50 proc. visų pajamų, bei ūkininkams ir jų samdomiems darbuotojams. Paskutinį kartą minimali mėnesinė alga buvo padidinta 1998 m. birželio 1 d. 19 ELTA, 2005 04 10. 11
12
NAMØ ÛKIAI Be kitų veiksnių, oficialaus darbo užmokesčio augimo lūkesčiai gali būti siejami su kalbomis apie neapmokestinamojo pajamų minimumo didinimą. Vis dėlto tiesioginė tokio žingsnio įtaka realiam darbo užmokesčio didėjimui ribota, o ankstesni bandymai rodo, kad neapmokestinamojo pajamų minimumo didinimas darbo užmokesčio lygiui įtakos iš esmės neturi, kadangi daugeliu atvejų darbuotojas su darbdaviu tariasi dėl pomokestinio, „į rankas“ gaunamo atlygio. Be to, kaip minėta, dažnai darbo užmokestis ar jo dalis yra mokami vokelyje. Apibendrinant galima būtų pasakyti, kad nors po neįvykusio staigaus atlyginimų šuolio Lietuvai įstojus į ES, rinkos dalyviai 2004 m. rodiklius mažino ir nemano darbo užmokestį praeitais metais smarkiai augus, vis dėlto jie nusiteikę gana optimistiškai ir tikisi spartesnio darbo užmokesčio augimo šiais metais.
2.3. Namų ūkiai šiemet turėtų drąsiau investuoti, dalį pinigų dar ir sutaupyti Namų ūkio investicijos – tai lėšos, naudojamos ilgalaikiam turtui, vertybiniams popieriams ir stambiems pirkiniams įsigyti bei paskoloms, panaudotoms jiems pirkti, grąžinti. Santaupos – tai po investicijų ir kitų išlaidų likusios lėšos, kurias namų ūkiai laiko bankuose, namuose arba yra paskolinę. LLRI tyrimas rodo, kad, palyginti su 2003 m., 2004 m. namų ūkių santaupos augo sparčiau, o investicijų augimo tempai po 2002-2003 m. šuolio lėtėjo. Rinkos dalyviai mano, kad, palyginti su 2003 m. (14 proc.), santaupos 2004 m. vidutiniškai augo 7,4 proc. (20 Lt/mėn.) ir siekė 283 Lt/mėn. Ilgalaikio vartojimo prekėms įsigyti 2004 m. vidutiniškai buvo skiriama 265 Lt/mėn., o t.y. 28 litais arba 9,6 proc. mažiau nei 2003 m. 2004 m. namų ūkių santaupų rodiklis po metų pertraukos ir vėl aplenkė investicijas. Šių metų pradžioje rinkos dalyviai didino ir namų ūkių investicijų, ir santaupų ex poste vertinimą, palyginti su praėjusių metų viduryje skelbta prognoze. Tuomet buvo manoma, kad investicijų smarkiai mažės – net 16 proc., o santaupos teaugs 1,5 proc. Šie praeito tyrimo rodikliai, o net ir geresni šiais metais skelbiami vertinimai, vis yra gana smarkiai nutolę nuo prieš metus išsakytų investicijų augimo prognozių, kuomet
29 buvo tikimasi, kad investicijų apimtys 2004 m. didės net 14 proc. ir sieks 333 Lt/mėn. Pastebimas investicijų namų ūkiuose mažėjimas gali būti tiesiogiai susijęs ir su menkesniais nei prieš metus namų ūkių pajamų bei darbo užmokesčio augimo lūkesčiais. Tačiau net ir įvertinus prastesnį namų ūkių pajamų augimo vertinimą, investicijų dalis namų ūkio biudžete šiais metais vidutiniškai sumažėjo 2 proc.– nuo 15,4 proc. 2003-aisiais iki 13,4 proc. 2004 m. Santaupų dalis namų ūkiuose sudaro 14,2 proc. Vienas iš pagrindinių veiksnių, lėmusių mažesnius taupymo ir investicijų rodiklius yra tai, kad lyderio pozicijos jau kurį laiką yra užleistos vartojimui. Statistikos departamento Vartotojų nuomonių tyrimo duomenimis, laikotarpio tinkamumas taupyti bei galimybė susitaupyti neigiamai buvo vertinama keturiasdešimčia procentų dažniau nei teigiamai, o teigiamų atsakymų dėl laiko tinkamumo vartoti, priešingai, buvo trečdaliu daugiau nei neigiamų20. Finansų ministerijos duomenimis, realus vartojimas, pernai augęs 8,7 proc., šiemet turėtų ūgtelėti dar apie 8,4 proc.21. Namų ūkių investicijoms įtakos gali turėti ir pablogėjusios išperkamosios nuomos sąlygos. Pagal 2004 m. sausio 15 d. priimtą naują Pridėtinės vertės mokesčio įstatymą 18 proc. PVM už išperkamąja nuoma perkamą prekę turi būti sumokėtas iš karto. Ir nors išperkamosios nuomos rinka labai sparčiai plečiasi, vis dėlto ši nuostata pabrangino išperkamosios nuomos paslaugas ir galėto turėti įtakos rinkos dalyvių vertinimui. Reikia atkreipti dėmesį ir į brangstančias statybas. Brangstant darbo jėgai ir statybinėms medžiagoms per 2004 m. statybų kainos išaugo apie 9 proc., gyvenamųjų namų statyba pabrango dar daugiau. Tai neturėjo milžiniškos įtakos jau keletą metų pastebimam statybų bei nekilnojamojo turto paklausos šuoliui, bet vis dėlto šiek tiek pakoregavo rinką, o tai, be abejo, atspindi ir pinigų paskirstymo vertinimo dinamikoje. Taupymo rodiklis nemažėja net ir klestint vartojimui. Tai iš dalies gali lemti ir stiprus įprotis taupyti, susiformavęs per ilgą laikmetį, kai tokių instrumentų kaip kreditai dar nebuvo. Indėlių bankuose vien per praėjusiuosius metus padidėjo ketvirtadaliu (iki 9,8 mlrd. Lt). Tačiau per praeitus metus ir paskolų buvo suteikta 85 proc. daugiau (4,5 mlrd. Lt).22
Statistikos departamentas, Vartotojų nuomonių tyrimo rezultatai, 2005- 03- 01. LR Finansų ministerija, “Lietuvos ūkio plėtros prognozė 2004–2007 metams”, www.finmin.lt. 22 Biliauskas, M., “Skolinimos bumas grasina virsti našta”, Lietuvos žinios, 2005 02. 20 21
30
NAMØ ÛKIAI
Kiek mažesnį investicijų rodiklį kai kurie tyrimo dalyviai grindžia tuo, kad mažėjant palūkanų normoms, investiciniai procesai jau kelerius metus iš eilės sparčiai auga, ir rinka jau spėjo prisisotinti. Anot jų, gyventojai jau „prisipirko“ ilgalaikio vartojimo prekių ir savo investicinius poreikius patenkino. Tai viena iš hipotezių, tačiau ji prieštarauja ir pačių ekspertų prognozei, kad šiais metais investicijos augs (žr. žemiau), ir bankininkų vertinimui bei lūkesčiams. Bankininkai gana optimistiškai vertina investicinę situaciją Lietuvoje, tvirtindami, kad vis daugiau gyventojų siekia investuoti, ir tikėdamiesi, kad augantys atlyginimai bei teigiamos perspektyvos toliau didins ir bankų paskolų portfelius23. „Hansabanko“ prognozėmis, paskolų rinka, 2004 m. pirmą pusmetį išaugusi 61 proc., turėtų sparčiai augti dar bent keletą metų24. Vilniaus banko vertinimu, iš viso bankų teikiamų paskolų klientams skaičius 2004 m. galėjo išaugti net 50 proc.25 „Sampo“ specialistai taip pat optimistiškai nusiteikę. Jie tikisi, kad šiemet būsto paskolų rinka augs maždaug 70 proc., palūkanos mažės, o būsto paskolų santykis su BVP nuo 5,6 proc. šiuo metu pakils iki 11–12 proc. 2008 m.26 2.6 grafikas Namø ûkiø santaupos ir investicijos, Lt/mën. 400 336
350 293
300 250
218
200 150 100
182
221 215
221 200
1998 1999 2000
223
239
263
231
283
317
265
183
2001 2002 2003
santaupos
2004 2005p
investicijos
Šaltinis: Lietuvos laisvosios rinkos institutas
Toliau augsiančių namų ūkių santaupų prognozę be kylančio gyventojų uždarbio veikia ir kompensacijos už nekilnojamąjį turtą ir indėlius. Investicijas didina augančios viltys, kylantis ūkio subjektų pasitikėjimas (žr. 2.1 skirsnį) ir dažnesnis
naudojimasis bankų paskolomis bei išperkamąja nuoma. Sparčiai populiarėja vartojamosios paskolos, kurios dažnai naudojamos ilgalaikiam turtui įsigyti arba paskoloms grąžinti. Kreditavimo rinkos augimui įtakos turi nesilpnėjanti nuožmi konkurencija tarp bankų ir išperkamosios nuomos bendrovių, skatinanti mažinti palūkanas ir gerinti kitas skolinimo sąlygas. Lietuvos lizingo asociacijos duomenimis, per 2004 m. išperkamosios nuomos portfelis padidėjo 44 proc. ir sudarė 3,887 mlrd. Lt. Tikimasi, kad šiais metais išperkamosios nuomos portfelis padidės iki 5 mlrd. Lt. Namų ūkių investicijos taip pat turėtų augti nesilpstant žmonių susidomėjimui gyvybės draudimu. Per 8 pirmuosius 2004 m. mėnesius buvo pasirašyta 14,3 proc. daugiau sutarčių nei 2003 m.27. Šalies draudimo rinka šiemet turėtų augti apie 22-25 proc.28 Papildomų paskatų investicijoms suteikia ir naujoji gyventojų pajamų apmokestinimo tvarka. Nuo 2003 m. įsigaliojęs naujasis Gyventojų pajamų mokesčio įstatymas įtvirtino gyventojų pajamų mokesčio lengvatas gyvybės draudimo įmokoms, kurios kartu su įmokomis į pensijų fondus, išlaidomis studijoms ir būsto paskolų palūkanomis neviršija 25 proc. asmens pajamų prieš mokesčius. Prognozuojant darbo užmokesčio bei namų ūkių pajamų augimą, ateinančiais metais namų ūkių santaupų ir investicijų turėtų ir toliau daugėti. Finansų ministerijos duomenimis, artimiausiu metu turėtų mažėti kasdienio vartojimo prekėms įsigyti skirtos išlaidos – 2004 m. augusios 8,7 proc., šiais metais jos turėtų padidėti dar 8,4 proc., o 2006 m. jau augti tik 5,9 proc.29 Sulėtėjus santaupų bei vartojimo išlaidų augimui, investicijos vėl kils sparčiau. Rinkos dalyviai kėlė šių metų santaupų ir, ypač, investicijų prognozę, pastarųjų augimo prognozę padidindami net ketvirtadaliu. Prognozuojama, kad 2005 m. santaupos didės 12,2 proc., o investicijos net – 27,1 proc.; sutaupoma per mėnesį bus mažiau nei investuojama – atitinkamai 317 Lt/mėn. ir 337 Lt/mėn. Santaupos sudarys apie 15 proc. namų ūkių biudžeto, o investicijos procentu daugiau.
Biliauskas, M. Bankininkai vilioja naujomis galimybėmis. – Lietuvos žinios, 2004- 10- 06, p. 7, Biliauskas, M. Skolinimos bumas grasina virsti našta, – Lietuvos žinios. 24 Simėnas D., “Gyventojai įsuko plėtros smaigalį”, Verslo žinios, 2004 09 08, p. 10. 25 Vilniaus bankas/SEB, „Lietuvos makroekonomikos apžvalga“, p. 12. 26 Staniulytė T., Jakubauskas R. Bankų grumtynes laimi būsto pirkėjai. – Verslo žinios, 2005- 03- 31. 27 Sytas A. Lietuvoje draudimo rinka išaugo 14,3 proc. – Verslo žinios 2004- 09- 20, p. 7. 28 Paškauskaitė R. Draudimo rinkos prognozės puikios. – Verslo žinios 2004- 09 -23, p. 5. 29 Finansų ministerija, Lietuvos ūkio plėtros prognozė 2004–2007 metams. 23
ÁMONIØ FINANSAI IR INVESTICIJOS
31
Taigi rinkos dalyviai, įvertindami paskutinių metų vartojimo bumą, pateikė mažesnius 2004 m. santaupų bei investicijų įverčius. Šiais metais vis dėlto prognozuojamas daug spartesnis santaupų ir investicijų augimas. LLRI tyrimo dalyviø vertinimai ir prognozës
Namø ûkiai Vidutinës pajamos Vidutinis darbo uþmokestis Vidutinës santaupos Vidutinës investicijos
2003
2004
Vertinimas
Vertinimas
procentais
metinis pokytis absoliuèiai
Patik. prog.
2005
procentais
metinis pokytis absoliuèiai
1904,83 1040,59 263,39 293,07
1980 1051,58 282,78 265
3,9% 1,1% 7,4% -9,6%
75,17 10,99 19,39 -28,07
2126,76 1138,28 317,36 336,81
7,4% 8,2% 12,2% 27,1%
146,76 86,7 34,58 71,81
* 2003–2005 m.m. vieno namų ūkio nario pajamos paskaičiuotos remiantis 2001 m. visuotinio gyventojų surašymo duomenimis (vidutinį namų ūkį sudaro 2,55 asmens).
32
ÁMONIØ FINANSAI IR INVESTICIJOS
3 skyrius. ĮMONIŲ FINANSAI IR INVESTICIJOS 3.1. Įmonių finansiniai rodikliai stabilūs ir po truputį gerėja Įmonių finansinei būklei įvertinti paprastai naudojama plati finansinių rodiklių gama – pelningumas, likvidumas, apyvartumas (turto valdymo), paskolos aptarnavimas. LLRI tyrime nagrinėjami du plačiausiai taikomi finansiniai rodikliai: pelningumas ir nuosavybės grąža1. Jau kurį laiką rinkos dalyvių prognozė yra santūriai optimistiška ir kinta labai nežymiai. Tyrime dalyvavę ekspertai prieš metus prognozavo, kad šiais metais įmonių pelningumo ir nuosavybės grąžos rodikliai truputį – keliomis dešimtosiomis procento – gerės. Panašus buvo ir 2004 m. ex poste vertinimo pokytis: pelningumo prognozė viena dešimtąja procento buvo sumažinta, o nuosavybės grąžos – keturiomis dešimtosiomis padidinta. Rinkos dalyvių nuomone, 2004 m. įmonių grynasis pelningumas vidutiniškai siekė 6,2 proc., o nuosavybės grąža – 10,6 proc. 3.1 grafikas Pelningumas ir nuosavybës gràþa, proc. 20 15 10 5 0
18,8
15,1 11
12,3
8,6
10,4
9,7
9,9
10,6
10,9
5,3
6,1
5,6
6,3
6,2
6,3
8,6 5,7
– 37,5 proc. – iki 5,5 mlrd. litų. Statistikos departamentas apskaičiavo, kad paslaugų sektoriaus apyvarta metų pabaigoje didėjo sparčiau nei gamybos įmonių ir sudarė beveik 60 proc. visų įmonių pajamų. Taigi oficiali statistika patvirtina augantį Lietuvos įmonių pelningumą. Vidutinis metinis įmonių pelningumas (pelno prieš apmokestinimą santykis su pajamomis už parduotas prekes ir paslaugas) 2004 m. siekė 5,4 proc., palyginti su 4,9 proc. 2003-aisiais. Didžiausio pelningumo 2004 m. – net 8,8 proc. – pasiekė paslaugų sektoriaus įmonės, pelningai dirbo ir pramonės sektoriaus įmonės bei energetikos ir statybos (nors pastarųjų sektorių pelningumas palyginti su 2003 m. smarkiai mažėjo, energetikos sektoriuje – net 2 proc.) įmonės. Ketvirtąjį 2004 m. ketvirtį sumažėjo beveik visų pramonės veiklų pelningumas, išskyrus naftos perdirbimo. Vienos iš pelningiausių ir vėl buvo paslaugos: verslo, ryšių ir telekomunikacijų paslaugos (daugiau nei 10 proc.), pramogų ir poilsio organizavimo paslaugos (daugiau nei 23 proc.). Pelningai dirbo 61 proc. įmonių – tai 5 proc. mažiau nei 2003 m. III ketvirtį. Šiais metais, rinkos dalyvių vertinimu, pelningumo ir nuosavybės grąžos rodikliai didės. Prognozuojama, kad 2005 m. grynasis pelningumas vidutiniškai augs iki 6,3 proc., nuosavybės grąža – iki 10,9 proc. Tikėtina, kad tokią santūriai optimistinę rinkos dalyvių prognozę lemia tebesitęsiantis Lietuvos ekonomikos augimas, didėjanti vidaus paklausa bei su naryste ES siejama nauda. Neigiamos įtakos finansiniams rodikliams gali turėti didėjanti kvalifikuoto darbo paklausa, jos trūkumas ir kaštai.
1997 1998 1999 2000 2001 2002 2003 2004 2005p Nuosavybës gràþa
Pelningumas
Šaltinis: Lietuvos laisvosios rinkos institutas
Įmonių apyvartų augimas atsispindi ir oficialioje statistikoje. Negalutiniais Statistikos departamento duomenimis, 2004 m. šalies įmonių apyvarta padidėjo vidutiniškai 23 proc. – iki 100,5 mlrd. litų, o pelnas
3.2. Investicijoms skiriama pelno dalis mažėja LLRI tyrimo dalyvių nuomone, 1997–2001 m. įmonės investicijoms kasmet skyrė vis didesnę pelno dalį, tačiau nuo 2002 m. ši dalis smarkiai sumažėjo. Rinkos dalyvių nuomone, 2004 m. buvo reinvestuoti 49 proc. pelno, palyginti su 66 proc. 2001-aisiais.
Įmonių pelningumas – tai per metus gauto grynojo pelno ir apyvartos procentinis santykis. Nuosavybės grąža – tai grynojo pelno ir nuosavo kapitalo procentinis santykis. 1
ÁMONIØ FINANSAI IR INVESTICIJOS
33
3.2 grafikas Ámoniø investuojama pelno dalis, proc. 70 60 50 40 30 20 10 0
54
57
57
62
66 54
52
49
48
Kita vertus, gal paskatintos narystės ES, įmonės 2004 m. gana drąsiai investavo užsienyje: tiesioginių Lietuvos įmonių investicijų užsienyje piniginė išraiška, palyginti su 2003 m., buvo 68 proc. didesnė; prognozuojama, kad per šiuos metus skaičius dar padvigubės.2 Statistikos departamento duomenimis, tiesioginės užsienio investicijos į Lietuvą 2004 m. III ketvirčio pabaigoje sudarė apie 14964 mln. litų – palyginti su 2003 m., jos padidėjo 8,5 proc.3
1997 1998 1999 2000 2001 2002 2003 2004 2005p
Šaltinis: Lietuvos laisvosios rinkos institutas
Lietuvos statistikos departamento duomenimis, 2004 m. iš viso materialinių investicijų buvo apie 12 proc.; investicijų į įrengimus, mašinas, transporto priemones daugiau – 2004 m. II ketvirtį apie 30,4 proc., palyginti su 2003 m. atitinkamu laikotarpiu, materialinės investicijos (išlaidos statybai, remontui, įrenginių, mašinų, pastatų, žemės įsigijimui ir pan.) išaugo 4,9 proc. Nors didžiosios įmonės vis dar nemažai pelno skiria reinvesticijoms, lėtesnis negu ankstesnių metų materialinių investicijų augimas sietinas su tuo, kad kai kurie ekonomikos sektoriai jau patenkino investicijų poreikį (pvz., telekomunikacijų sektorius), kiti sektoriai tiesiog laukia struktūrinių fondų lėšų ir tik planuoja savo investicijas.
Rimtesnių pokyčių 2005 m. rinkos dalyviai neprognozuoja. Jų vertinimu, įmonių investicijos iš pelno kitais metais mažės dar procentu ir sudarys 48 proc. Nors reinvestuojamojo pelno dalis, LLRI tyrimo dalyvių nuomone, sumažėjo, inovacijų procesai įmonėse praktiškai nesulėtėjo. Pasak rinkos dalyvių, 2004 m. tyrimams ir inovacijoms vidutiniškai buvo skiriama 5,9 proc. visų įmonių išlaidų, t. y. beveik tiek pat, kiek ir 2003 m. (5,8 proc.), tačiau mažiau, nei prognozuota praeito tyrimo metu, ir žymiai mažiau nei 2001 m. (7,2 proc.). LLRI tyrimo dalyvių 2005-ųjų prognozės yra optimistiškesnės. Rinkos dalyvių nuomone, 2005 m. tyrimams ir inovacijoms įmonių skiriama išlaidų dalis, nors vis dar nesieks 2001 m. lygio, turėtų išaugti iki 6,5 proc.
LLRI tyrimo dalyviø vertinimai ir prognozës 2003
2004
Vertinimas
Vertinimas
procentais
absoliuèiai
Patik. prog.
procentais
absoliuèiai
6,28 10,17 49,9
-0,6% -1,0% -3,9%
-0,04 -0,1 -2,05
6,27 10,86 47,78
-0,2% 6,8% -4,2%
-0,01 0,69 -2,12
5,93
2,6%
0,15
6,5
9,6%
0,57
Pelningumas 6,32 Nuosavybës gràþa 10,27 Investicijoms skiriama pelno dalis 51,95 Mokslui ir inovacijoms skiriama iðlaidø dalis 5,78
2 3
metinis pokytis
Statistikos departamentas, „2004 m. statistiniai rodikliai“, A. Šemetos pranešimas, 2005- 01- 28. Ibid.
2005
metinis pokytis
34
4 skyrius. PINIGAI 4.1. Skola auga, VVP pelningumas šiek tiek mažesnis Stabili šalies finansinė padėtis, narystė Europos Sąjungoje, geri makroekonominiai rodikliai, kartu su didele saugių vertybinių popierių paklausa ir pagerintais Lietuvos skolinimosi reitingais1 ir toliau mažino litais išleistų VVP pelningumo normą: vidutinis VVP pelningumas sumažėjo nuo 4,63 proc. 2002 m. iki 3,74 proc. 2003 m. ir iki 3,02 proc. 2004 m. LLRI tyrimo dalyvių nuomone, 2004 m. pabaigoje 3 metų iždo obligacijų pelningumas pirminėje rinkoje siekė 3,57 proc. Rinkos dalyviai vertina pirminėje rinkoje išplatintų VVP vidutinę palūkanų normą. Rinkos dalyvių nurodomas pelningumo rodiklis yra aukštesnis nei 2004 m. pabaigoje buvęs 3 metų iždo obligacijų vidutinis pelningumas: 2004 m. pabaigoje išplatintos 3 m. VVP emisijos vidutinis pelningumas siekė 3,21 proc. 2004 m. liepos–rugpjūčio mėn. atlikto tyrimo metu rinkos dalyviai prognozavo nuosaikų palūkanų normos kilimą. Šį kartą jie dar atsargesni: 2005 m. prognozes rinkos dalyviai mažino ir nesitiki, kad per šiuos metus pelningumas smarkiai paaugs. Prognozuojama, kad 2005 m. pabaigoje 3 m. iždo obligacijų pelningumas pirminėje rinkoje sieks 3,67 proc., palyginti su prieš pusę metų prognozuotais 3,95 proc. Tikėtina, kad kiek aukštesnį VVP pelningumą rinkos dalyviai gali sieti ir su JAV federalinių rezervų sistemos vykdomos pinigų politikos pokyčiais, būtent JAV federalinių rezervų sistemos priimtu sprendimu didinti palūkanų normas. Refinansavimo norma
PINIGAI
2004 m. buvo padidinta tris kartus po 0,25 procentinius punktus. Finansų ministerijos duomenimis, centrinės valdžios sektoriaus skola šių metų vasario pabaigoje buvo 12,1 mlrd. litų arba 18,2 proc. prognozuojamo 2005 metų BVP. 2004 metų pabaigoje skola buvo 11,58 mlrd. litų arba 18,7 proc. BVP. Taigi nors procentine išraiška skolos dydis sumažėjo, absoliučiais rodikliais ji yra didesnė nei prieš metus. Pagrindiniai veiksniai, turėję įtakos centrinės valdžios skolos dydžio kitimui 2005 m. buvo užsienyje išleista 11 metų trukmės 600 mln. eurų (2,072 mlrd. litų) euroobligacijų emisija bei 2000 m. išleistų 325 mln. eurų (1,122 mlrd. litų) euroobligacijų išpirkimas. Po sėkmingai išplatintos emisijos, šių metų valstybės skola padidėjo 443,9 mln. litų ir vasario mėnesio pabaigoje buvo 12,1 mlrd. litų, t.y., kaip minėta, 18,2 proc. prognozuojamo 2005 metų BVP. Po reikšmingų struktūrinių pokyčių 2002 m.2, 2004 m. VVP terminų struktūra praktiškai nekito. Nominalia verte 2004 m. pabaigoje didžiausią neišpirktų VVP, parduotų aukcionuose, dalį – 34 proc. – sudarė 5 metų trukmės iždo obligacijos. Iždo vekseliai (iki vienerių metų VVP) sudarė apie 9,8 proc. visų VVP, jų dalis 2002 m. ir 2001 m. siekė atitinkamai apie 20 ir 30 proc. 2004 m. pabaigoje vidutinė aukcionuose parduodamų ir esančių apyvartoje VVP trukmė buvo 1126 dienos. Praėjusiais metais toliau buvo įgyvendinama apyvartoje esančių VVP ilginimo strategija, išleidžiant vis daugiau ilgalaikių obligacijų. Ilgalaikes obligacijas leisti skatina VVP paklausa aukcionuose, palanki finansų rinkų reakcija Lietuvai prisijungus prie ES ir VKM II, žemos bazinės valiutos palūkanų normos bei mažėjantys Lietuvos VVP ir kitų ES narių skolos vertybinių popierių pelningumų skirtumai. Dėl
Šiuo metu tarptautinė kredito reitingo agentūra „Moody’s“ Lietuvos ilgalaikiam skolinimuisi užsienio valiuta yra suteikusi A3 reitingą su teigiama perspektyva, nacionaline valiuta – A3. Atitinkamai Standard&Poor‘s bei „Fitch“ yra suteikusios A- (neutrali perspektyva) ir A- (teigiama perspektyva) ilgalaikiam skolinimuisi užsienio valiuta bei A- ir A – ilgalaikiam skolinimuisi nacionaline valiuta. 2 2002 m. nustota emituoti 1 ir 3 mėnesių trukmės VVP, o 2002 m. kovo mėnesį pirmą kartą išleistos 10 metų iždo obligacijos. 1
PINIGAI
35
trukmės ilginimo, VVP, iki kurių išpirkimo 2004 m. pabaigoje buvo likę daugiau nei 1 mėn., skaičius išaugo 12 proc.3 4.1 grafikas VVP litais vidutinis pelningumas, proc. 10 7,7
8 6
5,7
7,1
7,0
3,2
3,7
7,5
5,7
4 2 0
2,1
2,2
6 mën. 1 m.
4,4
Lt paskolų, o tai 4,8 mlrd. litų, arba beveik 40 proc. daugiau nei prieš metus. Nors pastaraisiais metais sparčiau augo fizinių asmenų paimtų kreditų apimtys, ir per praeitus metus gyventojams suteikiamų paskolų dalis išaugo iki 26 proc. visų paskolų (palyginti su 20 proc. prieš metus), absoliučiais rodikliais 2004 m. daugiau kreditų išduota įmonėms –pastarosioms suteikta 2,6 mlrd. litų daugiau paskolų nei 2003 m., o gyventojams 2 mlrd. litų daugiau. Nagrinėjamojo laikotarpio pabaigoje gyventojams buvo suteikta 4.5 mlrd. litų kreditų , t. y. net 85 proc. daugiau nei prieš metus. 5. 4.2grafikas
2 m.
2001 m. 2002 m.
3 m.
5 m.
7 m.
10 m.
2003 m. 2004 m.
Šaltinis: Finansų ministerija
4.2. Skolinimosi kaina nusistovėjo, skolinimasis ir toliau auga LLRI tyrimas rodo, kad 2004 m. pabaigoje skolinimo iš komercinių bankų kaina beveik nekito. Rinkos dalyvių nuomone, 2004 m. pabaigoje ir 1, ir 5 metų trukmės paskolos litais kainavo 5,5 proc.4, ir turėtų atitinkamai paaugti iki 5,6 ir 5,7 proc. šiais metais. Tyrimo dalyvių prašoma įvertinti visus su skolinimusi susijusius kaštus, ko neatspindi Lietuvos banko skelbiami duomenys apie skolinimosi kainą. 2004 m. skolinimosi iš komercinių bankų kaina stabilizavosi ir buvo panaši į buvusią 2003 m. Lietuvos banko duomenimis, 1–5 metų ir ilgesnės negu 5 metų trukmės paskolos litais 2004 m. gruodžio mėn. kainavo atitinkamai 6,11 proc. ir 4,8 proc. Palūkanų normų lygis Lietuvoje yra pasaulio rinkų tendencijų atspindys. Jį taip pat lemia didelis Lietuvos bankų sistemos likvidumas ir stipri bankų konkurencija. 2004 m. toliau augo komercinių bankų kreditų portfelis. Lietuvos banko duomenimis, 2004 m. pabaigoje šalies komerciniai bankai buvo suteikę 16,8 mlrd.
16 14 12 10 8 6 4 2 0
1 m. paskolø palûkanos, proc. 12,6 8,9
7,0
7,3
5,7 6,4
Grd. 00
Grd. 01
Grd. 02
litais, LLRI tyrimas litais, Lietuvos bankas
5,5
5,8
Grd. 03
Grd. 04
eurais, LLRI tyrimas eurais, Lietuvos bankas
Šaltinis: Lietuvos laisvosios rinkos institutas, Lietuvos bankas
Be bankų kreditų, rinkoje toliau populiarėja lizingo ir faktoringo paslaugos. Šių paslaugų portfeliai sudaro vis didesnę bankų kreditų dalį (įskaitant bankų kreditus bankams ir finansų įstaigoms) ir augimo tempais nenusileidžia bankų kreditų augimui: per 2004 m. lizingo portfelis padidėjo 44 proc. ir sudarė 3,887 mlrd. Lt. Tikimasi, kad šiais metais lizingo portfelis padidės iki 5 mlrd. Lt. Faktoringo portfelis, Lietuvos lizingo asociacijos duomenimis, 2004 m. sudarė 3,628 mlrd. litų ir, palyginti su 2003 m., paaugo 35,8 proc. LLRI tyrimo dalyviai mano, kad ne bankų paskolų (įskaitant išperkamosios nuomos, faktoringo paslaugas) rinkos dalis 2004 m. sudarė 15,7 proc.; šiais metais jis labai nekis ir metų pabaigoje sudarys 16 proc.
Lietuvos bankas, Pranešimas teikiamas Lietuvos Seimui, 2004 m., www. http://www.lb.lt/lt/leidiniai/pranesimas_seimui/pranesimas_2004. pdf, p. 36. 4 Tyrimo dalyvių prašoma įvertinti visus su skolinimusi susijusius kaštus, ko neatspindi Lietuvos banko skelbiami duomenys apie skolinimosi kainą. 5 Biliauskas M. Skolinimos bumas grasina virsti našta. – Lietuvos žinios. 3
36
PINIGAI
Neigiamą įtaką lizingui ir faktoringui daro priimtas Finansų įstaigų įstatymas, kuris lizingą ir faktoringą prilygino paskoloms. Kaip žinoma, akcinių bendrovių įstatymas ir kiti teisės aktai draudžia skolinti atviro ir uždaro tipo akcinėms bendrovėms daugiau negu vertas jų nuosavas kapitalas, o tai reiškia, kad išperkamosios nuomos ir faktoringo kompanijų galimybės teikti paslaugas bus stipriai suvaržytos nuosavo kapitalo dydžio.
rugpjūčio pabaigoje – 1383,7 mln. Lt. 2004 m. didelių pokyčių indėlių struktūroje neįvyko – terminuotų indėlių litais dalis išaugo nuo 60 iki 65 proc. visų terminuotų indėlių, o indėlių iki pareikalavimo litais dalis sumažėjo 5 proc. iki 74 proc. Tikėtina, kad didesnes praeitų metų terminuotų indėlių apimtis lėmė tai, kad įmonėse daugėjo laikinai laisvų apyvartinių lėšų, kurias jos naudingai ir saugiai investavo į terminuotus indėlius.
Sveikintina, kad nebuvo priimtas dar vienas itin skausmingas ir ekonomiškai nepagrįstas lizingo veiklos suvaržymas. 2004 m. pavasarį buvo parengtas Finansų įstaigų įstatymo pakeitimas, kurį priėmus dalis šiuo metu lizingo įmonių teikiamų paslaugų patektų į tų paslaugų sąrašą, iš kurių lizingo įmonės negalėtų gauti daugiau kaip 10 proc. pajamų. Tarp tokių paslaugų patektų veiklos nuoma, pirkimas-pardavimas išsimokėtinai, lizingo sutartys su papildomomis paslaugomis ir kitos panašios paslaugos.
Kaip įprasta, 2004 m. daugiausia buvo sudaryta terminuotų, iki 1 mėnesio trukmės, indėlių sutarčių, – vidutiniškai apie 4 mlrd. Lt per vieną mėnesį. Tuo tarpu ilgesniam nei 1 mėnesio terminui nagrinėjamuoju laikotarpiu buvo priimta apie 700–800 mln. Lt indėlių per mėnesį, t. y. beveik tiek pat, kiek 2002 m. ir 2003 m. Praeitais metais itin sparčiai augo ilgesnio nei 2 metų termino indėlių kiekis – per praėjusius metus jų dalis išaugo net 80 proc.
Nors minėtas suvaržymas ir nebuvo įgyvendintas, nebankinių paskolų rinką vis dar varžo kiti nereikalingi apribojimai, todėl vargu ar artimiausiu metu galima tikėtis didesnės konkurencijos bankams.
4.3. Taupymas auga lėtai Lietuvos banko duomenimis, šalies bankuose laikomų indėlių suma 2005 metų sausio 1 d. sudarė 17,9 mlrd. Lt ir per metus padidėjo 4,3 mlrd. Lt arba 31,6 proc. Indėlių terminų analizė rodo, kad ir vėl smarkiai padaugėjo gyventojų indėlių – jie sudarė 9,8 mlrd. Lt ir per metus išaugo 1,9 mlrd. Lt, arba 24,4 proc. Terminuotų indėlių dalis paaugo 27 proc., litais – 39 proc. Indėlių iki pareikalavimo padaugėjo 28 proc., ir dabar šios rūšies indėliai apima 44 proc. visų fizinių asmenų indėlių. Tokią padėtį lemia auganti ekonomika, didėjančios žmonių pajamos, gausėjantis skaičius įmonių, kurios perveda darbo užmokestį į korteles, bankų rinkodaros akcijos (debetinių ir kreditinių kortelių platinimas), bankų pastangos pritraukti kuo daugiau terminuotų indėlių. Privačių įmonių turimi indėliai (tiek iki pareikalavimo, tiek terminuoti) 2004 m. paaugo ne taip žymiai. 2001 m. pabaigoje privačių verslo įmonių turimi indėliai iki pareikalavimo sudarė 2236,4 mln. Lt, o 2004 m. rugpjūčio pabaigoje – jau 3104,1 mln. Lt. Terminuoti indėliai 2001 m. pabaigoje sudarė 504,8 mln. Lt, 2002 m. – 848,5 mln. Lt, 2003 m. – 1031,9 mln. Lt, 2004 m.
Tikėtina, kad tokias tendencijas lemia didesnės palūkanos, mokamos už ilgalaikius indėlius, didesnis poreikis ir galimybė kaupti pinigus ateičiai, pagerėjęs požiūris į bankus, bankų konkurencija ir reklama. Kita vertus, ilgesnio nei 2 metų termino indėliai nesudaro ir 1 proc. bendros terminuotų indėlių apimties 2004 m. indėlių pelningumas toliau mažėjo. Lietuvos banko duomenimis, nominaliosios palūkanų normos buvo mažesnės už infliaciją. 2004 m., dėl bankų konkurencijos, mažinamų sąnaudų, mažėjusių bazinių palūkanų bei valiutos ir kredito rizikos, bankai beveik nekeitė indėlių ir paskolų litais bei eurais palūkanų normos. Vidutinis terminuotų indėlių litais pelningumas, palyginti su kitomis valiutomis, išliko didžiausias ir 2004 m. rugpjūčio pabaigoje sudarė 1,37 proc. (prieš metus – 1,27 proc.). Vidutinės palūkanos už terminuotus indėlius JAV doleriais ir eurais per metus padidėjo atitinkamai 0,36 ir 0,06 proc. ir 2004 m. rugpjūčio pabaigoje sudarė atitinkamai 1,20 ir 1,59 proc. 4.3 grafikas Indëliø vidutinis pelningumas, proc. 3 2,5 2 1,5 1 0,5 0
Grd. 01 litai
Grd. 02 eurai
Šaltinis: Lietuvos bankas
Grd. 03 Rgp. 04 JAV doleriai
PINIGAI
37
Tikėtina, kad šiais metais indėlių kainos smarkiai nesikeis, kadangi bankai geromis sąlygomis gali pritraukti skolintų lėšų iš užsienio. Euro zonos šalių ekonomikos būklė ir šių metų perspektyvos bei su tuo susijusi ECB politika taip pat neturėtų sudaryti sąlygų indėliams stipriai brangti. Tiesa, indėliai JAV doleriais gali kiek pabrangti dėl JAV Federalinės rezervų sistemos pradėtos vykdyti (švelniai) restrikcinės pinigų politikos. LLRI tyrimo dalyviø vertinimai ir prognozës: palûkanø normos ir nebankinës paskolos, proc.
Palūkanų normos 1 m. paskolos litais 5 m. paskolos litais 3 m. trukmės VVP Nebankinės paskolos
2003
2004
Vertinimas
Vertinimas
procentais
metinis pokytis absoliuèiai
Patik. prog.
2005
procentais
metinis pokytis absoliuèiai
5,72 5,75 3,9 18,77
5,46 5,47 3,57 15,65
-4,5% -4,9% -8,5% -16,6%
-0,26 -0,28 -0,33 -3,12
5,61 5,71 3,67 15,96
2,7% 4,4% 2,8% 2,0%
0,15 0,24 0,1 0,31
38
IÐVADOS
IŠVADOS 2005 m. sausio–vasario mėnesiais atlikto tyrimo duomenimis, Lietuvos ekonominė situacija ir praėjusiais, ir šiais metais buvo ir turėtų išlikti gana stabili. Ekonomika vis dar auga sparčiai, įmonių finansinė padėtis gerėja, mažėja nedarbas ir po truputį kyla dirbančiųjų gaunamas darbo užmokestis. Ekonomikos augimą skatina vartojimas, vidaus rinkos ir eksporto plėtra po truputį atgyjančios investicijos, gerėjantys verslo ir gyventojų lūkesčiai. Kita vertus, rinkos dalyvių nuomone, šešėlinės ekonomikos apimtys jau keletą metų nemažėja, o pastaruoju metu netgi paaugo, ir net keturi iš dešimties oficialiai dirbančiųjų už minimalią algą gauna atlyginimus vokelyje. Neigiamos šešėlinės ekonomikos prognozės atspindi ir, rinkos dalyvių manymu, nemažėjančią, o šiemet net ir stipriau jaučiamą, mokesčių naštą. Pasidavę Europos Sąjungos stojimo nuotaikoms ir prieš metus pateikę itin optimistiškas prognozes visose srityse, rinkos dalyviai ekonomikos augimą veikiančius procesus šįkart jau vertino santūriau. Vis dar tikimasi pastovaus augimo užimtumo, darbo užmokesčio, investicijų ir užsienio prekybos srityse, tačiau nenumatoma didesnių išorinių veiksnių nulemtų šuolių. Tyrimo duomenimis, 2004 m. bendrasis vidaus produktas išaugo 6,8 proc., palyginti su 7,4 proc. augimu 2003 m. Rinkos dalyvių šalies ūkio augimo prognozės 2004-iesiems yra šiek tiek žemesnės nei anksčiau skelbtosios. Mažesnės ir 2005 m. prognozės: rinkos dalyviai mano, kad kitais metais ekonomikos augimas bus lėtesnis nei 2004 m. ir sudarys 6,3 proc. Tokios prognozės atspindi ir oficialių vidaus bei tarptautinių institucijų prognozėse pastebimas tendencijas – dauguma, išskyrus finansų ministerija, tikisi lėtesnio ekonomikos augimo. LLRI tyrimo duomenimis, lūkesčiai apie šešėlinės ekonomikos mažėjimą nepasitvirtino, netgi atvirkščiai – rinkos dalyvių vertinimais, šešėlinės ekonomikos apimtys šalyje pastaruoju metu išaugo. Naujausiojo tyrimo duomenimis, 2004 m. šešėlinė ekonomika sudarė 20,8 proc. BVP. Šiais metais ji turėtų beveik nekisti – rinkos dalyvių nuomone, 2005 m. ji sudarys 20,6 proc. visos šalies ekonomikos. 2004 metų pa-
vasarį rinkos dalyviai, veikiami teigiamų lūkesčių dėl narystės Europos Sąjungoje bei laukdami ilgai brandintos mokesčių reformos, pirmą kartą po trejų metų pertraukos prognozavo šešėlinės ekonomikos mažėjimą nuo stabilių 20 proc. 2002–2003 m. iki 18,6 proc. 2004-aisiais. Vis dėlto prieš pusę metų šešėlinės ekonomikos vertinimai buvo beveik procentu padidinti, o šiame tyrime jie kilo dar daugiau – nuo 19,5 proc. iki beveik 21 proc. Šešėlinei ekonomikai smukti trukdo nemažėjanti – ir, manoma, augsianti – mokesčių našta (žr. 1.5 skirsnį), mokesčių politikos nenuoseklumas ir nenuspėjamumas, griežti darbo santykių reguliavimai, cigarečių, degalų akcizai, pablogėjusios individualiųjų įmonių verslo sąlygos. Mažesnius augimo tempus lemia reformų strateginėse srityse nebuvimas, didėjančios šešėlinės ekonomikos apimtys, kurį laiką neaugusios ir dabar dar, palyginti su ankstesniais metais bei kaimyninėmis šalimis, labai negausios užsienio investicijos, gyventojų emigracija bei augantis kvalifikuotos darbo jėgos trūkumas. Kita vertus, augimą skatina vidaus rinkos plėtra, veikiama kylančio darbo užmokesčio ir gausėjančių investicijų; paskutinių prekybos barjerų išnykimas bei pagerėjusios eksporto sąlygos, skatinę eksporto augimą po įstojimo į ES; taip pat narystės paskatinta specializacija daugelyje sričių. Rinkos dalyvių ex poste vertinimais, ir eksporto, ir importo augimas 2004 m. pranoko išankstinius lūkesčius. Eksporto augimo tempai ir vėl yra spartesni nei importo. Rinkos dalyvių vertinimu, 2004 m. eksportas augo 13,2 proc., o importas – 12,4 proc., palyginti su atitinkamai 12 proc. ir 11,4 proc. 2003-aisiais. Šiais metais jie turėtų augti dar sparčiau: eksportas 13,8 proc. o importas 12,6 proc. Rinkos dalyvių lūkesčius ir, atitinkamai, aukštus vertinimus ir prognozes, (ypač eksporto srityje), skatina po truputį bandanti atsigauti euro zonos ir spartėjanti JAV ekonomikos plėtra, paskutinių prekybos barjerų
IÐVADOS išnykimas Lietuvai tapus ES nare, taip pat didėjančios naftos ir metalų kainos. Lūkesčius dėl importo augimo skatina sparčiau augsiančios gyventojų pajamos, perkamoji galia ir vartojimas bei po kelių metų stagnacijos šiek tiek atsigaunantys investiciniai procesai. Rinkos dalyviai didino savo kainų augimo prognozes, ir mano kainas 2004 m. augus sparčiau nei 2003-aisiais, bei prognozuoja, kad spartus augimas išliks ir šiais metais. Pasak rinkos dalyvių, 2004 m., po 2003aisiais vyravusio lėto kainų augimo, tiek vartojimo, tiek gamintojų perkamų prekių ir paslaugų kainos augo žymiai sparčiau: vartotojų kainos išaugo 2,96 proc., o gamintojų 3,3 proc., palyginti su 0,8 proc. augimu 2003 metais. Kainas kilti skatina pasikeitęs prekybos režimas bei akcizai, smarkiai kilusios naftos kainos ir ilgalaikio vartojimo auginama vidaus paklausa. Tuo tarpu paklausos augimui įtakos turi mažėjantis nedarbas ir kylančios namų ūkių pajamos. Naujausiame tyrime pastebimas ypač ryškus pokytis vertinant gamintojų prekių ir paslaugų kainų augimą: rinkos dalyviai per 40 proc. padidino žiemą išsakytus 2004 m. vertinimus – nuo 1,9 proc. iki 2,7 proc. Vartotojų kainų augimo prognozės buvo padidintos 7 proc. Vartojimo prekių kainų indekso didinimas šį kartą gali būti susijęs ne tiek su kylančiomis namų ūkių investicijomis (kurios, rinkos dalyvių nuomone, šiemet gerokai santūresnės), kiek su augančiomis kasdieniam vartojimui skiriamomis lėšomis. Gamintojų kainos kyla dėl subsidijų eksportui už ES ribų bei neimportuojamų į Lietuvą subsidijuotų žemės ūkio produktų iš ES. Be to, pasikeitus užsienio prekybos režimui, brango kai kurios iš trečiųjų šalių importuojamos prekių ir žaliavos. Gamintojų kainas smarkiai kelia ir rekordiškai brangstanti nafta. Rinkos dalyviai prognozuoja, kad 2005 m. vartojimo prekių ir paslaugų kainos didės 3,3 proc., gamintojų – 3,6 proc. Tokie lūkesčiai pirmiausia yra siejami su toliau mažėsiančiu nedarbu bei sparčiai didėsiančiu darbo užmokesčiu ir namų ūkių pajamomis, savo ruožtu auginančiomis vidaus vartojimą (žr. skirsnį 1.2), taip pat su augančiomis naftos kainomis, laipsnišku mokesčių su ES harmonizavimu, didinamais akcizais. Kaip ir minėta, kainų kilimą gali skatinti ir žmonių lūkesčiai dėl dar didesnio kainų kilimo po euro įvedimo ir to paskatintas vartojimas, „prisipirkimas“, pinigų išleidimas iki euro įvedimo. Stabiliai augant ekonomikai, toliau gerėja padėtis darbo rinkoje. Pasak rinkos dalyvių, 2004 m. pabaigoje nedarbo lygis buvo 9,6 proc., palyginti su
39 11 proc. 2003 m. pabaigoje. Tikimasi, kad nedarbas ir toliau gana sparčiai mažės ir 2005 m. pabaigoje sudarys 8,4 proc. Nedarbo mažėjimą veikia besitęsianti ūkio plėtra ir teigiami lūkesčiai dėl gerėsiančios įmonių padėties. Nedarbo duomenis taip pat stipriai koregavo lietuvių migracija į ES darbo rinkas. Kita vertus, nedarbui dar sparčiau kristi trukdo verslui ir darbui nepalankūs mokesčių politikos pakeitimai, griežtinamas darbo santykių reguliavimas, didinamas privalomasis minimalus atlyginimas, didelis nekvalifikuotų bedarbių skaičius ir kvalifikuotų specialistų stoka. Būtent pastarieji veiksniai labiausiai įtakoja ir bene didžiausias Lietuvos darbo rinkos problemas – aukštą struktūrinio nedarbo rodiklį ir didelį skaičių žmonių, ilgai – daugiau nei 2 metus – negalinčių rasti darbo. Rinkos dalyvių nuomone, 2004 m. mokesčių našta sudarė 35,4 proc., o šiais metais ji turėtų kilti iki 36,3 proc. Ex poste vertinimais, 2003 m. mokesčių našta sudarė 35 proc., ir prieš metus rinkos dalyviai prognozavo, kad ji nekis. Visgi rinkos dalyviai pakėlė ir mokesčių naštos vertinimus, ir, ypač, prognozes. Didžiausią įtaką mokestinių prognozių ir vertinimų kaitai turi Vyriausybės mokesčių politika: pernai labiau Lietuvos narystės Europos Sąjungoje kontekste, šiemet bandant spręsti vidines ir šalies konkurencingumo problemas. Vyriausybės nenuspėjamumas, mažėjantis pasitikėjimas oficialiomis struktūromis, mokesčių kaita ir balansavimas bandant naštą perkelti nuo vieno mokesčio ant kito, lemia ir niūresnes ateities prognozes – rinkos dalyviai prognozuoja mokesčių naštą šiemet kilsiant. LLRI tyrime jau kurį laiką pastebima tendencija, kad rinkos dalyviai labai optimistiškai prognozuoja darbo užmokesčio augimą ateinantiems metams, tačiau pateikia daug mažesnius ex poste metinius įverčius. 2004-ieji buvo ne išimtis. Prieš daugiau nei metus prognozavę, kad 2004 m. vidutinis darbo užmokestis augs net iki 1113 Lt/mėn., tyrimo dalyviai metų bėgyje po trupučiuką mažino savo prognozes. Jų ex poste vertinimais, darbo užmokestis praeitais metais augo labai nežymiai. Rinkos dalyvių nuomone, 2004 m. vidutinis darbo užmokestis ūgtelėjo tik vienuolika litų ir sudarė 1052 Lt/mėn. O šių metų prognozės, vėlgi, yra aukštesnės – tyrimo dalyviai 2005 m. tikisi net daugiau nei 8 proc. aukštesnio vidutinio mėnesinio atlyginimo, sieksiančio 1138 Lt/mėn. Mažesni darbo užmokesčio augimo ex poste vertinimai gali būti tiesiogiai susiję su neišsipildžiusiomis
40 viltimis dėl staigaus atlyginimų šuolio prisijungus prie ES. Darbo uždarbio didėjimas taip pat gali būti nelabai tiesiogiai jaučiamas ir dėl didelės mokesčių naštos ir nepiniginių priedų prie atlyginimų. Optimistiškesnėms šių metų darbo užmokesčio prognozėms įtaką daro mažėjantis nedarbas ir dėl emigracijos bei švietimo sistemos plyšių stiprėjanti konkurencija dėl darbo jėgos, toliau augantis įmonių efektyvumas ir pelningumas bei tikėtinas postūmis dėl narystės Europos Sąjungoje. Aukštesnes vidutinio darbo užmokesčio prognozes galėjo netiesiogiai įtakoti ir minimalios mėnesinės algos, įskaitant ir biudžetinių įstaigų darbuotojų atlyginimus, didinimas. Augant ekonomikai nuolat gerėjo gyventojų finansinė padėtis. Pažvelgus į kasmetinius namų ūkių pajamų įverčius, galima pastebėti, kad namų ūkių pajamos pastaruosius penkerius metus labai stabiliai augo. Tačiau paskutinieji 2004 m. vertinimai neatitinka ankstesnių rinkos dalyvių lūkesčių: jie yra žymiai mažesni, nei tikėtasi prieš metus, kuomet tyrimo dalyviai prognozavo 2004 m. namų pajamas pasieksiant 2058 Lt/mėn. Aukštas prognozes praeitame tyrime pakeitė įspėjimai dėl galimos namų ūkio pajamų augimo stagnacijos, tačiau šįkart rinkos dalyviai optimistiškesni. Jie kėlė savo 2004 m. rodiklius apie 3 proc., teigdami, kad disponuojamas piniginės pajamos vienam žmogui per praėjusius metus išaugo beveik trisdešimčia litų. Didžiausią įtaką prieš pusę metų smarkiai mažintoms prognozėms, pačių rinkos dalyvių nuomone, turėjo nepateisinti narystės Europos Sąjungoje lūkesčiai. Dauguma tikėjosi staigaus pajamų šuolio, susijusio su įstojimu į ES ir, šių lūkesčių vedini, optimistiškai ir stipriai didino savo 2004 m. prognozes. Jokių šuolių per pirmuosius mėnesius nepastebėjus prognozės buvo sumažintos. Rinkos dalyvių ex poste vertinimais, vidutinės piniginės namų ūkio pajamos 2004 m. buvo aukštesnės nei tikėtasi, ir siekė 1980 Lt/mėn. Gyventojų finansinė padėtis šiais metais turėtų ir toliau gerėti, nors ji ir nepasieks anksčiau prognozuoto lygio. Prognozuojama, kad 2005 m. namų ūkių pajamos augs netoli 7 proc. ir sieks 2127 Lt/mėn. Pajamos vienam ūkio nariui sudarys 834 Lt/mėn. Augančios pajamos sietinos su toliau mažėsiančiu nedarbu, augančiu darbo užmokesčiu ir didėsiančiomis nesamdomojo darbo pajamomis. Namų ūkių pajamų lygiui įtakos taip pat turės didinamos pensijos, įvairios socialinės pašalpos, kitos biudžeto išmokos.
IÐVADOS Rinkos dalyviai didino ir namų ūkių investicijų, ir santaupų ex poste vertinimą, palyginti su praėjusių metų viduryje skelbta prognoze. Naujausias LLRI tyrimas rodo, kad 2004 m. didėjo namų ūkių santaupų, tačiau investuojama po 2002–2003 m. šuolio buvo šiek tiek mažiau. Rinkos dalyviai mano, kad santaupos 2004 m. vidutiniškai augo 7,5 proc. (20 Lt/mėn.), palyginti su 14 proc. 2003 m., ir sudarė 283 Lt/mėn. Ilgalaikio vartojimo prekėms įsigyti 2004 m. vidutiniškai buvo skiriama 265 Lt/mėn., o t.y. 28 litais arba 9,6 proc. mažiau nei 2003 m. 2004 m. namų ūkių santaupų rodiklis po metų pertraukos ir vėl aplenkė investicijas. Vienas iš pagrindinių veiksnių, lėmusių mažesnius taupymo ir investicijų rodiklius yra tai, kad lyderio pozicijos jau kurį laiką yra užleistos vartojimui. Visgi gyventojų lūkesčiai, augantis pasitikėjimas kreditų institucijomis, bankų ir lizingo bendrovių konkurencija, susidomėjimas gyvybės draudimu skatina gyventojų investicijų augimą. Rinkos dalyviai, šiek tiek padidinę ir santaupų augimo prognozes, tikisi investicijas šiais metais išaugsiant net daugiau nei ketvirtadaliu. Prognozuojama, kad 2005 m. santaupos augs 12,2 proc., o investicijos net 27,1 proc., ir sutaupoma per mėnesį šiais metais jau bus mažiau nei investuojama – atitinkamai 317 Lt/mėn. ir 337 Lt/mėn. Santaupos sudarys apie 15 proc. namų ūkių biudžeto, o investicijos procentu daugiau. Vertinant įmonių finansinius rodiklius, rinkos dalyvių lūkesčiai jau kurį laiką yra santūriai optimistiški ir kinta labai nežymiai. Tyrime dalyvavę ekspertai prieš pusę metų prognozavo, kad šiais metais įmonių pelningumo ir nuosavybės grąžos rodikliai truputį – keliomis dešimtosiomis procentinio punkto – gerės. Toks pat minimalus judėjimas pastebėtas ir 2004 m. ex poste vertinimuose: pelningumo prognozė viena dešimtąja procento buvo sumažinta, o nuosavybės grąžos – keturiomis dešimtosiomis padidinta. Rinkos dalyvių nuomone, 2004 m. įmonių grynasis pelningumas vidutiniškai siekė 6,2 proc., o nuosavybės grąža – 10,6 proc. Šiais metais, rinkos dalyvių vertinimu, pelningumas ir nuosavybės grąžos rodikliai didės. Prognozuojama, kad 2005 m. grynasis pelningumas vidutiniškai augs iki 6,3 proc., nuosavybės grąža – iki 10,9 proc. Tikėtina, kad šiuos santūriai optimistiškus rinkos dalyvių lūkesčius lemia tebesitęsiantis Lietuvos ekonomikos augimas, didėjanti vidaus paklausa bei su naryste ES siejama nauda. Neigiamos įtakos finansiniams rodikliams gali turėti didėjanti kvalifikuoto darbo paklausa, jos trūkumas ir kaštai.
IÐVADOS LLRI tyrimo dalyvių nuomone, 1997–2001 m. įmonės investicijoms skyrė vis didesnę pelno dalį, tačiau nuo 2002 m. ši dalis smarkiai sumažėjo. Rinkos dalyvių nuomone, 2004 m. buvo reinvestuota 49 proc. pelno, palyginti su 66 proc. 2001-aisiais. Rimtesnių pokyčių 2005 m. rinkos dalyviai neprognozuoja. Jų vertinimu, įmonių investicijos iš pelno kitais metais mažės dar procentu ir sudarys 48 proc. Nors reinvestuojamojo pelno dalis, LLRI tyrimo dalyvių nuomone, sumažėjo, įmonių inovacijų procesai praktiškai nesulėtėjo. Pasak rinkos dalyvių, 2004 m. tyrimams ir inovacijoms vidutiniškai buvo skiriama 5,9 proc. visų įmonių išlaidų, t. y. beveik tiek pat kiek ir 2003 m. (5,8 proc.). Vis dėlto šis rodiklis yra mažesnis nei prognozuota praeito tyrimo metu, ir žymiai mažesnis nei 2001 m. (7,2 proc.). LLRI tyrimo dalyvių prognozės 2005-iesiems yra optimistiškesnės. Rinkos dalyvių nuomone, 2005 m. tyrimams ir inovacijoms įmonių skiriama išlaidų dalis, nors vis dar nesieks 2001 m. lygio, turėtų išaugti iki 6,5 proc. LLRI tyrimo dalyvių nuomone, 2004 m. pabaigoje 3 metų iždo obligacijų pelningumas pirminėje rinkoje siekė 3,57 proc. rinkos dalyvių siūlomas pelningumo rodiklis yra aukštesnis nei 2004 m. pabaigoje buvęs 3 metų iždo obligacijų vidutinis pelningumas. Ankstesnio tyrimo metu rinkos dalyviai prognozavo nuosaikų palūkanų normos kilimą, šį kartą jie dar atsargesni: 2005 m. prognozes rinkos dalyviai mažino ir nesitiki, kad per šiuos metus pelningumas smarkiai paaugs. Prognozuojama, kad 2005 m. pabaigoje 3 m. iždo obligacijų pelningumas pirminėje rinkoje sieks 3,67 proc. 2004 m. skolinimosi iš komercinių bankų kaina stabilizavosi ir buvo panaši į buvusią 2003 m. LLRI tyrimas rodo, kad 2004 m. pabaigoje skolinimo iš komercinių bankų kaina beveik nekito: 2004 m. pabaigoje ir 1, ir 5 metų trukmės paskolos litais kainavo 5,5 proc., ir turėtų atitinkamai išaugti iki 5,6 ir 5,7 proc. 2005-aisiais.
41 Be bankų kreditų, rinkoje toliau populiarėja lizingo ir faktoringo paslaugos. Šių paslaugų portfeliai sudaro vis didesnę bankų kreditų dalį (įskaitant bankų kreditus bankams ir finansų įstaigoms) ir augimo tempais nenusileidžia bankų kreditų augimui: per 2004 m. lizingo portfelis padidėjo 44 proc. ir sudarė 3,887 mlrd. Lt. Tikimasi, kad šiais metais lizingo portfelis padidės iki 5 mlrd. Lt. Faktoringo portfelis, Lietuvos lizingo asociacijos duomenimis, 2004 m. sudarė 3,628 mlrd. litų ir lyginant su 2003 m., paaugo 35,8 proc. LLRI tyrimo dalyviai mano, kad ne bankų paskolų (įskaitant lizingo, faktoringo paslaugas) rinkos dalis 2004 m. sudarė 15,7 proc.; šiais metais jis labai nekis ir metų gale sudarys 16 proc. Neigiamą įtaką lizingui ir faktoringui daro priimtas Finansų įstaigų įstatymas, kuris lizingą ir faktoringą prilygino paskoloms. Kaip žinia, akcinių bendrovių įstatymas ir kiti teisės aktai draudžia skolinti atviro ir uždaro tipo akcinėms bendrovėms virš nuosavo kapitalo, o tai reiškia, kad lizingo ir faktoringo kompanijų galimybės teikti paslaugas bus stipriai suvaržytos nuosavo kapitalo atžvilgiu. LLRI tyrimo dalyvių vertinimais, 2004 m. pabaigoje vienas JAV doleris buvo vertas 2,62 lito. Tai yra mažiau nei rudenį prognozuotas 2,88 lito kursas ir žymiai mažiau nei prieš metus prognozuotas 3,33 lito kursas. Tačiau tai yra praktiškai toks pat kursas kaip ir 2004 m. sausio mėnesį rinkoje užfiksuotas JAV dolerio ir euro kursas. Taigi rinkos dalyviai neprognozuoja didesnio JAV dolerio vertės pokyčio, o jų vertinimai atitinka šios valiutos vertės svyravimus rinkoje. Rinkos dalyviai prognozuoja kad šiais metais JAV dolerio vertė lito atžvilgiu nesikeis ir 2005 m. pabaigoje sudarys 2,7 lito. * * * Kitas Lietuvos ekonomikos tyrimas bus atliktas 2005 m. rudenį. Jis parodys, kaip keisis rinkos dalyvių 2005 metų prognozės ir kokie jų lūkesčiai 2006-iesiems.
42
INTRODUCTION
INTRODUCTION The Lithuanian Free Market Institute (LFMI) presents its fifteenth survey of the Lithuanian economy, covering the 2004 estimates of economic indicators and updated forecasts for 2005. This survey was carried out in January and February 2005. LFMI launched the survey of economic variables in 1997. The survey is based on the expert consensus paradigm originating from the theory of rational expectations.1 This theory states that economic indicators can be related to certain processes in the economy, and market participants use all available information to make estimates and forecasts concerning these processes. The more information market participants possess, the more credible their estimates and forecasts are. It is likely that individuals who are engaged in day-to-day business activities have the most information about the economy, while their successful performance reflects their ability to process this information.
from the business sector and generalises it by statistical methods. Second, the LFMI survey depends on benevolent assessment of market processes by economic experts. The Department of Statistics collects detailed mandatory reports from enterprises (households can refuse to participate in official surveys). Third, LFMI has chosen economic indicators and defined them so as to make them useful in planning a business activity. The Department of Statistics uses an established methodology to investigate an established set of variables. In addition to that, LFMI presents comprehensive information from its surveys promptly and conveniently. These differences make us believe that the results of LFMI surveys have more practical value for market participants.
The methodology used in the LFMI survey differs from the methodology used by official institutions, so our aim is to provide alternative estimates of economic indicators.
The estimates of the survey participants are presented in four parts. Part 1 is devoted to macroeconomic indicators: the growth of gross domestic product (GDP), the rate of the shadow economy to GDP, import and export growth, inflation, changes in consumer and producer prices, the rate of unemployment, the rate of the tax burden to GDP, and the exchange rate of the litas to the U.S. dollar. Part 2 covers household indicators, including personal earnings, household income, household savings and household investments. Part 3 gives an overview of corporate indicators, including the profit margin, return on equity, return on investments and the share of companies’ expenses on science and innovation. Part 4 analyses interest rates on one- and five-year loans, interest rates on three-month government securities and the share of non-bank loans. Generalised results of the survey are presented in tables at the end of each part of the study.
There are three main differences between the LFMI survey and official statistics. First, LFMI survey participants present economic information they have themselves generalised, whereas the Lithuanian Department of Statistics collects unique information
Fourty-two experts participated in the latest survey. The LFMI survey is not representative. We do not aim to have a representation of specific sectors of the economy or regions or enterprises. Our aim is to interview economic experts who represent robust and
The main goals of the LFMI survey are to provide estimates and forecasts of economic variables in Lithuania based on the opinion of market participants and to analyse factors that have an influence on these estimates and forecasts. The survey is also aimed at comparing the estimates of market participants with official statistics and data from other sources and to offer interpretations of the most distinct differences.
1 The oldest and most famous survey of economists’ expectations is the Livingston survey conducted in the United States since 1946. The results of the survey are regularly published on the Philadelphia’s Federal Reserve Bank’s website http://www.phil.frb.org.
INTRODUCTION prospering companies. The respondents are asked not to provide information about their own companies or industries but to estimate indicators reflecting the country’s general economic situation on the basis of all available information. Survey participants are requested to focus only on variables that they think they are competent enough to appraise. Most of the respondents in the latest survey took part in the previous stages of the project. The list of survey experts is presented at the end of the study. We compare the estimates and forecasts of market participants with the data of the Lithuanian Department of Statistics, the Bank of Lithuania, the National Stock Exchange of Lithuania, the Labour Exchange, the BNS news agency and periodicals. In comparing the different sources, we look at the differences in the definitions used. Official institutions do not
43 measure five of the economic variables covered in the LFMI survey – the shadow economy, household investments, reinvested profits, expenses on science and innovation and non-bank loans. In addition to that, official institutions do not forecast some of the indicators analysed in the LFMI survey. The results of the LFMI surveys are unique in this respect. As in the previous editions, we compare the estimates and forecasts of the survey experts not only with other sources but also with their ex ante forecasts. The study also analyses patterns and trends of expert estimates and forecasts over time based on the previous surveys. LFMI expresses its gratitude to the survey participants, funders and all those who have provided comments and remarks on the study.
44
Chapter 1. MACROECONOMICS 1.1. Economic growth will slow down this year According to a survey conducted by the Lithuanian Free Market Institute (LFMI) in January and February 2005, Lithuania’s economic growth remained steady in 2004 but not as rapid as in 2003. According to market participants polled by LFMI, Lithuania’s gross domestic product (GDP) grew by 6.8 percent in 2004. It is projected that the economic development will slow down even more significantly in 2005 – it is estimated that the economy will grow only by 6.3 percent. In the LFMI survey, the gross domestic product is understood as the total value of goods and services produced for final consumption within the country, including the shadow economy, during a given period. The results of the LFMI survey show that the estimates and forecasts of market participants regarding the country’s economic growth remain quite optimistic. Market participants have only slightly changed their earlier expectations of economic growth in 2004 and have only reduced the estimate of GDP growth by one percentage point, to 6.8 percent. Just as was predicted, economic growth remained fast in 2004, although not quite as rapid as in 2003. Lithuania’s GDP has been constantly growing ever since 2000, compared to every previous quarter of the year (excluding seasonal and episodic fluctuations). The GDP has grown on average by 1.8 percent during each quarter of the year. Both market participants polled by LFMI and official local and international institutions agree that GDP growth peaked during 2003 and 2004 and is currently stabilising.1 According to the LFMI survey, a growing domestic market, export growth (see section 1.2) and gradually
MACROECONOMICS
recovering foreign investments continue to stimulate Lithuania’s economic growth. Market participants raised their estimates of export and import growth in 2004 and believe that the growth of foreign trade will accelerate more significantly this year, both in terms of exports and imports. A continued strong economic development and the resulting decline in unemployment (see section 1.4) will keep augmenting personal earnings (see section 2.2). The fairly successful first year of Lithuania’s membership of the European Union (EU) is boosting economic expectations as well. International experts hold that the country’s membership of the EU will bolster the economy during the next several years.2 However, while it is expected that the introduction of the euro possibly will lead to an acceleration of economic growth (economists believe that the euro may boost GDP growth by some 0.2 to 0.4 percent per annum), it is indispensable to stimulate the growth by pursuing a strict fiscal policy, further liberalising the market and resisting the temptation to artificially stimulate the economy by increasing government spending.3 On the other hand, the country’s economic development is still being retarded by several factors. First, the government has not yet embarked on structural reforms in a number of strategic areas where reform is badly needed, which has led to an “investment famine,”4 lasting for several years (and not completely over yet). Second, emigration of Lithuanian residents and, particularly, a lack of qualified labour also have a negative impact on the figures of GDP growth. The economy is created by people, hence their massive emigration reflects rather instantly in the economic indicators. The continuing upsurge in oil prices have not yet had any drastic impact on Lithuania’s or the world’s economic development as the supply of oil so far has grown along with demand. However, international experts have warned that possibilities to increase the extraction of crude oil are limited and that a continuing rise in oil prices may jeopardise the growth of the global economy.
According to the latest data from Statistics Lithuania, Lithuania’s GDP grew by 9.7 percent in 2003; the European Commission reported an 8.9-precent GDP growth (preliminary data). 2 In the concluding remarks of “Analysis and Systematising of financial, economic and social impact of Lithuania’s Integration into the EU,” conducted in 2003 by the European Committee at the Lithuanian Government, it is stated that Lithuania’s GDP will grow at a 1.14-percent higher rate in 2002-2009 due to the impact of the country’s integration into the EU. 3 Šarkinas R., Balcerovičius L., ”Įvedus eurą, ekonomika augs 02-04 procentinio punkto greičiau,” ELTA, 28 02 2005. 1
MACROECONOMICS
45
Rising domestic demand and growing exports have in part offset tangible negative effects that the upsurge in oil prices has had on economic growth. However, skyrocketing oil prices has had some influence on the economy as the Lithuanian oil refinery company Mazeikiu nafta contributes significantly to the country’s GDP. The forecasts of the LFMI survey participants reflect trends reported by official local and international institutions. Traditionally, market participants provide more moderate estimates of economic growth than the official statistics, but in the current survey they reported estimates similar to the official figures (see Diagram 1.1). According to the revised data from Statistics Lithuania, the gross domestic product rose by 6.7 percent in 2004.5 As in the previous years, more value added was generated in the following sectors – manufacturing, wholesale and retail trade and services, especially repair of motor vehicles and of individual and household equipment (nearly 11 percent). Rapid growth was also recorded in such sectors as transport, storage and communications (9.2 percent), as well as hotels and restaurants (7.2 percent). After a considerable growth in the construction sector in 2003, value added generated in this sector went down markedly in 2004 as a result of significantly increased construction costs.6 The growth of sectors related to production is among the major conditions to boost consumption.7 Diagram 1.1 GDP growth, percent 10 8 5.1 6 4 4.9 2 0 -2 -4 -6
9.7
6.5
6.8
4.2
5.2
4 -1.8
7.4
6.7
7.0
6.8
6.3
2.2
-4.2
1998 1999 2000 2001 2002 2003 2004 2005f LFMI survey
SL, MF
Source: Statistics Lithuania, Ministry of Finance, Lithuanian Free Market Institute
At the end of 2004, the Ministry of Finance reduced its earlier forecasts by 0.5 percentage point to 6.5 percent. The 2004 economic growth reported by the Lithuania Statistics and the Ministry of Finance, based on ex poste evaluations, is 6.7 percent. The LFMI survey estimates are only 0.1 percent higher than the estimates presented by the official statistics. At the beginning of 2005, both the Ministry of Finance and the market participants believed that economic growth would be more sluggish in 2005 as compared to 2004. However, in April of 2005, the Ministry of Finance raised their earlier forecasts by 0.5 percent and now expect the economy to grow by as much as 7 percent in 2005. The market participants, on the other hand, think that economic growth will slump more considerably, to 6.3 percent. The forecasts of market participants are moderate if compared with those from other institutions (see table 1.1) but are similar to those reported by the European Commission (EC) and the International Monetary Fund (IMF). Although the EC used to provide rather low forecasts in the previous years, it raised the forecast of the country’s GDP growth to 6.7 percent in the autumn of 2004. However, the EC also predicts that the economy will slow down in 2005, growing only by 6.4 percent.8 All institutions agree on the general dynamics of Lithuania’s economic growth. Just like the market participants, many financial institutions have lowered their 2004 estimates and forecasts for 2005 GDP growth. Nordea, for instance, does not expect the growth rate in 2004-2005 to be as high as in 2003, and considerably decreased its forecasts. Most of the other institutions agree with this opinion and provide lower forecasts for the 2005 GDP growth (see table 1.1). It would be difficult, and unrealistic, to hope that Lithuania’s GDP will grow as rapidly as in the previous years by itself, without the implementation of essential reforms. The economy should be stimulated constantly, and not just in those areas which are directly defined as economic. Unreformed areas – healthcare, public administration, the budget
4 Foreign direct investments (FDI) amounted to 3.818 and 3.967 million euro in 2002 and 2003 respectively; in 2004 FDI increased and totalled 4.337 million euro. This indicator still remains the lowest FDI per capita. 5 Statistics Lithuania, www.std.lt. 6 Statistics Lithuania, “GDP Grew by 6.7 percent in 2004“ www.std.lt. 7 ELTA, „Pirmąjį pusmetį Lietuvos BVP išaugo 7,2 proc.,“ 09 09 2003. 8 European Commission, European Economy, Economic Forecasts, Spring 2004, pp. 96-97. http://europa.eu.int/comm/economy_finance/ publications/european_economy/2004/ee204en.pdf. 9 ELTA, 07 10 2004, www.elta.lt.
46
MACROECONOMICS
deficit, education and pensions – not only impede the country’s economic development but also become obstacles to an overall growth. Table 1.1 Forecasts of Lithuania’s GDP growth* SEB HBM LFMI EC Nord/LB IMF Nordea VB MF WB PwC
2004
2005
7.3 7.0 (7.5) 6.8 (6.9) 6.7 (7.1) 6.7 (6.6) 6.6 (7.0) 6.6 (7.0) 6.6 (6.8) 6.5 (7.0) 6.5 (6.0) 6.4
7.1 6.8 6.3 (6.5) 6.4 (6.6) 5.9 (6.7) 7.0 (6.3) 6.1 (6.6) 6.8 7,0 (6.5) 6.0 5.9
* the earlier forecasts are provided in brackets Acronyms: SEB – Skandinaviska Enskilda Banken,9 HBM – Hansabank Markets,10 LFMI – Lithuanian Free Market Institute survey, EC – European Commission,11 Nord/LB,12 IMF – International Monetary Fund,13 Nordea,14 VB - Vilnius Bank,15 MF – Ministry of Finance,16 WB – World Bank,17 PwC – PricewaterhouseCoopers.18
1.1.1. The world economic growth Lithuania’s economic development is closely linked to the situation in the international markets and is increasingly dependent on trends in the in the world economy. The noticeable acceleration of the world’s
economic growth and some of the Lithuania’s main export markets is expected to affect positively Lithuania’s economic development. It should be seriously considered why the Lithuanian economy slowed down when the economies of the USA, Asia and the CIS were growing rapidly and the euro area was showing signs of recovery. An evaluation of the situation of the global markets may lead to the conclusion that economic growth was negatively affected by domestic economic policy rather than some outside factors. Kick-started in late 2003, the world economy was recovering steadily last year.19 Nevertheless, in part as a result of surging oil prices, economic growth in the USA and China slightly dropped in the second half of the year while Japan was even faced with economic stagnation – negative GDP growth was recorded in the country during the last three quarters of 2004. Despite some slowdown in certain regions, in the spring of 2005 the IMF once again raised its 2004 economic growth indicators, this time to 5.1 percent and predicted a 5-precent growth for the year 2005. It was announced in the autumn 2004 that if the IMF’s prognosis proved right (in September the IMF expected a 5.0 percent growth for 2004), the predicted world economic growth would be the most rapid since 1973.20 Growing confidence of market participants, rising profits, strengthening real estate markets, recovering securities markets and declining unemployment have had a major impact on the global economy.21 The EC provided optimistic, although slightly lower estimates, as compared with the IMF: it believes that the world economy grew by 4.5 percent in 2004 and
„HansaBank Markets, „The Baltic Outlook,“ 11 08 2004, p. 3. European Commission, Commission’s Autumn Economic Forecasts 2004-2006, October 2004, http://europa.eu.int/comm/economy_finance/publications/european_economy/forecasts_en. 12 Nord/LB Lietuva, “Lietuvos ekonomikos apžvalga,” 2005/3, 2005-04-20, http://www.nordlb.lt/files/Ataskaitos/Lithuanian/lsa_2005_ 2.pdf. 13 IMF, “World Economic Outlook”, Sept 2004. http://www.imf.org/external/pubs/ft/weo/2004/02/pdf/chapter1.pdf. 14 Nordea, Economic Outlook, February 2005, p. 37. 15 Vilniaus Bankas, “Lietuvos makroekonomikos apžvalga,” Nr. 4/20, 02 2005, p. 12 16 Ministry of Finance of the Republic of Lithuania, “Lithuania’s Economic Development Outlook for 2004–2007,” www.finmin.lt. 17 World Bank EU-8 Quarterly Economic Report, January 2005. 18 Nastaravičius, M. “Lietuva tebeauga sparčiausiai iš ES narių,” Verslo žinios, 03 06 2004, p. 9. 19 BBC News, “World growth ‘fastest since 1973,’” 29 09 2004. 20 IMF, “World Economic Outlook”, Spring 2005, http://www.imf.org/external/pubs/ft/weo/2005/01/pdf/statappx.pdf; World Economic Outlook, Fall 2004, BBC News, „World growth ‘fastest since 1973’“, 2004 09 29. 21 “The Wall Street Journal” announced on 6 September 2004 that the unemployment rate dropped to 5.4 percent and is the lowest figure since October 2001. Unemployment in the euro area has not shrunk since last year and remains 9 percent. The Wall Street Journal, 03 09 2004, The Economist, 11 09 2004, p. 100. 22 European Commission, European Economy, No2/2004. Economic Forecasts, Spring 2004, http://europa.eu.int/comm/economy_finance/ publications/european_economy/forecasts_en.htm. 10 11
MACROECONOMICS will continue to grow by 4.3 percent in 2005.22 The Economist announced a 4.4-percent growth in 2004. The European Central Bank (ECB) is more optimistic: it projects that in 2005 the global economy will grow by 4.7 percent.23 The US economy is again expected to make the most significant contribution to the world economy: the IMF recently reported that the US economy grew by 4.3 percent in 2004 and is estimated to grow by 3.5 percent this year. Economists polled by Bloomberg News in March 2005 also raised the forecast for the US economic growth in 2005 from 3.6 percent to 3.8 percent.24 Experts polled by The Economist provided virtually identical figures, expecting a 3.8-percent growth this year after a 3.9-percent growth in 2004.25 The European Commission has also increased its 2004 estimates by two percentage points and reports that the US economy grew by 4.4 percent in 2004. However, according to the EC, the global economy is expected to develop at a slightly lower – 3 percent rate in 2005.26 Apart from the recovering US economy, rapidly developing Asian economies – China and India in particular – and the CIS and OPEC countries will also exert a strong influence on the global economy. Most of the Latin American countries also developed more rapidly than expected in 2004, outpacing Lithuania’s economic growth considerably.27 It was expected last year that the euro area would pick up after an economic standstill in the first half of 2003. Almost all international institutions increased the forecasts of economic growth in the middle of 2004. 28 Equally unanimously most of them then reduced their forecasts and estimates in late 2004 and at the beginning of 2005. The ECB lowered its prognosis in December 2004, explaining it with reference to high oil prices and a strengthening euro. According to the ECB, the euro area economy grew by 1.8 percent in 2004, and a similar growth, between 1.2 and 2 percent, is predicted to prevail
47 this year as well. Earlier the ECB had forecast a 1.9-percent and 2.3-percent growth respectively.29 Just like other institutions, the EC reduced its 2005 forecast of economic growth in the euro area, down from 2 percent to 1.6 percent (and from 2.5 percent to 2 percent in the EU-25). Economists believe that an increasing demand in the foreign markets, growing exports rising investments, and a growing number of jobs are among the major factors to galvanize the euro area economy this year. Yet, although the EC expects a recovery of private consumption,30 the bulk of specialists agree that that a lower domestic demand and consumption bring into doubt whether the EU economy will accelerate in the short run. Participants in The Economist’s survey also reduced their 2004 indicators to 1.5 percent and believe the economy of the euro area will grow by 1.9 percent in 2005.31 Table 1.2 Forecasts for economic growth 2004 IMF World USA Euro area EU-25 EU-15 Japan CIS Russia
5.0 4.3 1.6 4.3 4.4 6.0 7.3
EC 4.5 4.4 2.0 2.4 2.3 2.7 -
2005 IMF 4.3 3.5 2.25 4.2 2.3 5.2 6.6
EC 4.3 3.6 1.6 2.0 1.9 1.1 -
Source: International Monetary Fund,32 European Commission33
Lithuania’s long-term economic prospects and the expectations of market participants are being influenced by a continued market de-monopolisation and
ECB, Monthly Bulletin, March 2005, p. 68. ELTA, “Analitikai didina JAV ekonomikos augimo prognozes,” 09 03 2005, www.elta.lt. 25 The Economist, “Economic and Financial Indicators,” 02 04 2005, p. 88. 26 European Commission, European economy, No2/2004. Economic Forecasts, Spring 2004, http://europa.eu.int/comm/economy_finance/ publications/european_economy/forecasts_en. 27 CESifo World Economic Survey, 3/2004, pp. 4-9. The Economist, Emerging Market Indicators, 09 04 2005, p. 90. 28 In September Eurostat raised the 2004 forecast of economic growth in the euro area by two percentage points, to 1.6-2.2 percent, and the 2005 forecast by one percentage point, to 1.8-2.8 percent. The European Commission predicted that the economy in the euro area would rise by 1.7 percent (2 percent in the EU), compared to 0.4 percent (0.8 percent in the EU) in 2003. 29 ECB, Monthly Bulletin, p. 68. 30 See also CESifo World Economic Survey, 3/2004, p .4. 31 The Economist, “Economic and Financial Indicators,” 09 04 2005, p. 88. 32 IMF, “World Economic Outlook,” Spring 2005, http://www.imf.org/external/pubs/ft/weo/2005/01/pdf/chapter1.pdf; World Economic Outlook, Fall 2004, BBC News, “World growth ‚fastest since 1973,‘” 29 09 2004. 23 24
48 privatisation. The telecommunications market was de-monopolised on 1 January 2003. On 1 January 2004, the state monopoly on the production of strong alcohol came to an end. A step towards de-monopolisation has also been taken in the oil business sector, where, until EU accession, the country’s oil refinery Mazeikiu nafta held an absolute (non-natural) monopoly with respect to market entry.34 The import duty of 15 percent, applied to other importers of oil products before EU accession, was reduced to 5 percent as of 1 May, 2004.35 The expectations of market participants in 2004 were also bolstered by a still speedy privatisation process. In 2004, the country concluded 576 privatisation deals that together totalled more than 410 million litas.36 The National Stock Exchange and the Lithuanian Central Securities Depository were sold. After long negotiations the sale of 34 percent of the Lithuanian gas company Lietuvos dujos was completed for 100 million litas. The alcohol companies Alita and Anyksciu vynas, the Lithuanian Film Studio and the Kruonis Pumped Storage Plant Construction were also privatised. At the end of the year, the sale of the ship repairing company Klaipedos laivu remontas was finalised.37 During the first quarter of 2005, 165 privatisation deals were concluded in Lithuania. The Lithuanian Export and Import Insurance Company was sold and an agreement to sell 68.69 percent of the shares in the publishing company Spauda was concluded. The Lithuanian Government also made a welcome decision in March this year by approving a programme, according to which the state-owned Lithuanian Airlines will be put up for sale again after a previous failed privatisation attempt. However, privatisation has unfortunately been postponed in a number of important sectors. Talks about selling the Lithuanian railway company Lietuvos gelezinkeliai and the liberalisation of this market have not brought any material results so far. The Government’s position on the liberalisation of this sector is more flexible (this is also laid down in EU directives), however, it has announced
MACROECONOMICS explicitly that the public railway infrastructure will not be privatised.38 After the privatisation tender of the electricity provider Rytu skirstomieji tinklai (eng. - the Eastern Distribution Network) was over, the decision was made to shelve its privatisation. On the other hand, privatisation alone does not solve all problems. The state often plays a very similar role in certain markets even after companies operating in them are privatised. For example, the Lithuanian energy companies Lietuvos dujos and Vakaru skirstomieji tinklai (eng. - the Western Distribution Network) have been privatised, however, they cannot operate freely in the market as production prices remain government-regulated. Market participants polled by LFMI think that economic growth will slightly decline. They believe that in 2005 the Lithuanian economy will grow by 6.3 percent. Protracted reforms in certain strategic sectors, unpredictable government policy, fickle tax policy and a still large shadow economy are likely to be related to such expectations. 1.1.2. The shadow economy As the LFMI survey indicates, the scope of the shadow economy remains stable in Lithuania (see diagram 1.2). The shadow economy is defined as a share in total GDP of goods produced and services rendered for final consumption within the country and unreported for the purpose of avoiding taxes or regulations. According to the estimates provided by market participants in the previous four surveys, the shadow economy remains stable, accounting for approximately one-fifth of the country’s economy. The results of the current survey show that, according to the markets participants, the shadow economy accounted for 20.8 percent of GDP in 2004 and is not expected to change much in 2005 – decreasing only to 20.6 percent by the end of the year.
33 European Commission, Commission’s Autumn Economic Forecasts 2004-2006, Brussels, October 2004, http://europa.eu.int/comm/economy_finance/publications/european_economy/forecasts_en.htm. 34 The examples of entities naturally dominating in the market are Lietuvos Dujos, Western and Eastern Distribution Networks, Lietuvos Gelezinkeliai, and Lithuanian Telecom. Apart from Mazeikiu Nafta, non-natural monopolies (dominating in the market with support from the government) are Lietuvos Pastas, the heating, transport, education and healthcare sectors. 35 Grižibauskienė, E. “Monopolijų apsuptyje,” Veidas 41, 07 10 2004, p. 16-17. 36 ELTA, “Vasarį Lietuvoje privatizuota turto už 17,4 mln. Litų,” 01 03 2005. 37 Jonuškaitė T., “Pernai privatizuota už daugiau nei 410 mln. Lt.,” VŽ Online, 03 01 2005. 38 Pečiulis, G. “Lietuvos geležinkeliai rieda privatizavimo link?,” Veidas 41, 07 10 2004, p. 26-28.
MACROECONOMICS Earlier forecasts for 2004 and 2005 indicate that market participants’ expectations changed significantly over the course of the last year. In spring 2004, market participants, in the light of optimistic expectations regarding the country’s membership of the EU and awaiting the long-incubated tax reform, predicted a shift in the shadow economy for the first time in three years, down from the stable 20 percent in 2002-2003 to 18.6 percent in 2004. However, six months ago, in July-August 2004, the survey participants raised the estimates of the share of the shadow economy by 0.5 percentage points, while in the current survey the figure was increased again, and this time much more –from 19.5 percent to 20.8 percent. The considerable and ever-present tax burden – which is also likely to increase in 2005 (see section 1.5), inconsistency and unpredictability of tax policy, strict regulations of labour relations, further increases of excise duties on cigarettes and fuel and deteriorated conditions for individual businesses together largely explain the still considerable shadow economy. The LFMI survey reveals that as much as 41 percent of the people who officially receive the minimal monthly wage are paid unreported extra wages “in envelopes”39. This figure has remained stable for several years, indicating that the situation in the labour market is not improving, much of it still operating in the shadows. Specialists think that this figure will not go down, unless taxation of income from labour is reduced. A year ago market participants believed that the country’s membership of the EU would decrease the share of the shadow economy, however, a reverse trend may indeed be expected. In fact, Lithuania’s membership of the EU may, at least in the short run, increase the share of the shadow economy in the country’s GDP. The raised forecast for the shadow economy already indicates that market participants do not envisage a reduction of the informal sector any time soon.
49 While adjusting to the EU rules and excise duties, goods are getting more expensive, and, consequently, differences in prices between Lithuania and its nonEU neighbours are widening, so stimulating various smuggling activities. The shadow economy is also augmented by the cumbersome and complicated procedures required to start legal businesses – various, frequently ambiguous, rules regulating the market, complicated licensing, rigid employment regulations, and costly implementation of requirements. Moreover, short-term measures are still being employed to fight smuggling, whereas no long-term strategy has been adopted so far aimed at reducing differences in prices with neighbouring countries, removing unnecessary restrictions, eliminating the possibility of arbitrary activities and simplifying administrative and customs procedures.40 Although government officials think that the business community should applaud the negotiated seven-year transitional period for harmonising the tariffs of excise duties with EU law,41 in fact, some tariffs of excise duties in Lithuania exceed the minimum level set by the EU.42 Since March 2003, when the new excise duties on tobacco became effective (the excise duty was increased from 36 to 53.9 litas per thousand cigarettes43), the price of tobacco products has increased by 20-30 cents, and since the beginning of 2004, after increasing the excise on tobacco products once again44, the price for a 20-cigarette pack, depending on the brand of cigarettes, increased by another 0.24-0.35 litas45. According to EU requirements, the excise duty on tobacco will have to account for 57 percent of the retail price of tobacco products until 2009.46 Despite the fact that for the time being Lithuania applies one of the lowest excise duties on tobacco in the EU, the overall burden of excise duties in Russia is still nine times lower. This situation creates considerable
Also known as unreported or unofficial earnings, or “pay under the table”. LFMI, “A Study on Economic Causes of Smuggling,” p. 9.; Kmieliauskas L., “Kontrabandos perspektyvos geros, verslo – prastesnės,” Verslo žinios, 02 07 2004, p. 4. 41 Following EU provisions, the excise duty on tobacco will constitute 57 percent of the retail price of cigarettes until 31 December 2009; Kmieliauskas L., Verslo žinios, „Mažesni akcizai stabdytų cigarečių kontrabandą,“ 17 06 2004, p. 5. 42 Kmieliauskas, L., “Kontrabandos perspektyvos geros, verslo - prastesnės,” Verslo žinios, 02 07 2004, p. 4. 43 The specific element of excise duty was increased from 30.6 to 42.6 litas per thousand cigarettes. Lithuania is obligated to increase the excise duty on cigarettes until it reaches the minimum excise rate of the EU at the end of 2009. Since 2003, the minimum excise duty rate on tobacco in the EU countries may not be lower than 64 euros (220.8 litas) per 1,000 cigarettes. 44 The specific excise duty on cigarettes was increased from 42.6 litas to 47.5 litas per 1 thou. cigarettes, and the ad valorem tariff was increased form 10 percent to 15 percent 45 BNS, „2004-aisiais brangs tabakas, degalai ir Šiluma, tačiau kartu didės atlyginimai ir pensijos”, 31 12 2003. 46 The government has adopted a welcome decision to take advantage of the transitional period and to postpone further increases of excise duties until one more year later; Kmieliauskas L., „Mažesni akcizai stabdytų cigarečių kontrabandą,“ Verslo žinios, 17 06 2004, p. 5. 39 40
50
MACROECONOMICS
incentives for smuggling.47 Thus it is a small wonder that smuggling last year hit all-time records since Lithuania re-gained its independence. If, according to the Lithuanian retailers, in 2002 illegal products accounted for about 30 percent of the entire tobacco market of the country,48 the figures will undoubtedly get even higher in 2004 and 2005. Diagram 1.2 Shadow economy, percent 40 30
27 24
22
20
22
19
20
20
21
21
10 0
1997 1998 1999 2000 2001 2002 2003 2004 2005f
and organisational burden.49 It is possible that this additional burden also forces many sole proprietors to go informal. To sum up, market participants think that the country’s economic growth will remain steady, although not reaching the level of 2003. This growth is being driven by an array of factors such as an upsurge in the domestic market stimulated by rising wages and investments, the elimination of the last trade barriers, and enhanced export conditions, the latter boosting export growth after the EU accession as well as the specialisation of activity in a number of areas stepped up by EU membership. Delayed reforms in certain strategic sectors, meagre investments (which have been languishing for several years and have started to pick up only insignificantly recently, compared to the previous years and other countries), emigration and an increasing lack of qualified labour are the main factors impeding an even more positive economic development.
Source: LFMI survey
Another burdensome factor not allowing for the decrease of the shadow economy is the growing tax burden on sole proprietors. Starting from 2003, in addition to the 15 percent profit tax, sole proprietors must now also pay 15 percent income tax levied on the part of income used for private needs. The conditions for individual businesses deteriorated further after the adoption of the Law on Sole Proprietorship in November 2003. Apart from other restrictions, this law provides that a natural person may only have one individual enterprise, the owner of such an enterprise may only be one natural person, and the person who is officially married must obtain a written permission from the spouse to establish a sole proprietorship. Besides, sole proprietors may not become members of real partnerships or true members of commandite partnerships. This is intended to protect the interests of creditors. However, such provisions legalise unjustified restriction of individual rights and also cause many enterprises to close down because not all enterprises wish or are able to reorganise to meet and/or incorporate the additional financial
1.2. Imports and exports The LFMI survey analyses changes in the value of exported and imported goods and services, both reported and unreported. The ex poste estimates of the growth of both exports and imports are higher than market participants’ earlier forecasts. Market participants also believe that exports again grew more rapidly than imports. As the survey indicates, in 2004 exports grew by 13.2 percent and imports rose by 12.4 percent as compared to 12 percent and 11.4 percent respectively in 2003. Survey participants predict that foreign trade will increase even more this year: exports are expected to go up by 13.8 percent and imports by 12.6 percent. The ex poste estimates of the growth of foreign trade in 2004 are higher than the forecasts presented in the last survey. The estimate of import growth was raised by nearly 0.5 percentage point, while that of export growth went up by as much as 1.5 percentage points
47 According to the data of the State Border Guard Service, 71 percent of the detained cigarette contraband was carried from the Kaliningrad region of the Russian Federation and 20 percent from Belarus. LFMI, “A Study on Economic Causes of Smuggling,” p. 24. 48 Ambrazas G. Akcizų didinimas skatina šešėlinę ekonomika, Respublika, 28 11 2002; Markevičienė E. Brangstančios cigaretės skatina nelegalią prekybą, Lietuvos žinios, 27 11 2002. 49 More about the conclusions of LFMI regarding the Draft Law on Sole Proprietorships at http://www.lrinka.lt/Tyrimai/Imones/Indiphtml (In Lithuanian).
MACROECONOMICS from the earlier forecasts. However, if compared with the forecasts presented two surveys – or a year – ago, the ex poste estimates of both export and import growth are only inconsiderably higher, barely 0.3 percentage point. Market participants polled by LFMI believe that foreign trade continues to grow rapidly, and the growth rate is not expected to decline in the near future. Lower estimates presented last year may be due to a decline in investments which lasted for several years and a lower demand for imported investment goods. On the other hand, a sliding US dollar, which is still often used in import settlements, diminished the import value expressed in litas. In addition to that, the lowered estimate for the growth of foreign trade may be related to a slower-than-expected recovery in Lithuania’s major export markets as well as boosted, but not fulfilled, expectations of instant changes when at the threshold of EU membership. Higher estimates of export growth as compared to import growth presented in this survey can be attributed to several factors. First, membership of the EU has affected the dynamics of import growth quite markedly. It should be said that Lithuania’s membership of the EU has had a more considerable impact on imports from most third countries than on exports to these countries. According to data from the Ministry of Economy, the bulk of tariffs and/or excise duties applied to the goods from third countries by the EU are higher than those imposed in Lithuania. Also, the imported goods taxed by increased excise duties comprise a greater share in total foreign trade. For these reasons, after joining the EU, the jump in prices of imports was more conspicuous than the decrease.50 Research conducted by the Ministry of Economy shows that about 30 percent of goods imported from Lithuania’s main trade partners in third countries cost approximately 5.6 percent more.51 However, rising prices of imports from third countries may be offset by seeking cheaper alternatives in other countries and by negotiating with suppliers and manufacturers for discounts. In addition, simplified import procedures and the removal of non-tariff barriers are continuing to drive down the price of imports from EU countries.
51 Official institutions provided higher estimates of the dynamics of exports and imports than the market participants. According to data presented by the Ministry of Economy, Lithuanian exports rose by 21 percent in 2004, while imports grew by 15.8 percent. Foreign trade in intermediate goods and consumption goods increased the most.52 Indeed, in 2004 Lithuania saw an impressive rise in foreign trade. The slowly recovering economy of the euro area, accelerating economic growth in the US (see section 1.1), the removal of trade barriers after EU accession and rising prices of oil and metals are among the basic forces that bolstered the expectations of market participants and resulted in high estimates and forecasts (of export growth in particular). Improved expectations regarding import growth can also be related to increased estimates of earnings, the purchasing power and daily consumption expenditures, coupled with reviving investment processes after a stagnation that lasted for several years.53 Diagram 1.3 Growth of foreign trade, percent 20 16 12 8
16.4 12
12
13.0
12.2
11.4
2001
2002
13.2
13.8
12.4
12.6
4 0
imports
2003
2004
2005f
exports
Source: LFMI survey
Compared to other institutions, the estimates of market participants regarding the growth of Lithuanian exports and imports are rather moderate. Nordea reported the lowest estimate of export growth in 2004, and thought that exports rose by 4 percent and imports grew by 14 percent. According to Nordea, in 2005 exports will increase by 8 percent while imports will rise by 9 percent.54 Hansabank is more optimistic: they believe that exports grew by 12.2 percent in 2004
50 Ministry of Economy, “Prekybos režimo pokyčių, Lietuvai tapus ES nare, su trečiosiomis šalimis 2002 metų importo ir eksporto duomenų pagrindu įvertinimas,“ http://www.ukmin.lt/index.php/lt/Prekyba/Uzsienio/Pokyciai2002. 51 Andružytė R., Nečiūnienė L., “Muitus įveiks derybomis,“ Verslo žinios, 20 08 2003. 52 Statistics Lithuania, www.std.lt. 53 More about investment processes look Linkaitis, M., “Investicijų badmetis baigėsi,” Verslo žinios, 23 09 2004, p. 1. 54 Nordea, Economic Outlook, p. 37.
52 and will go up by 7.5 percent in 2005, while imports increased by 15.3 percent last year and will rise by 9.2 percent this year. Hansabank also suggests that imports will grow more rapidly than exports in 2005 due to a continued increase in household consumption and a rising demand for capital goods.55 Analysts from Vilnius Bank agree that the growing purchasing power of the people, rising demand for consumption goods and corporate investments spurred by EU support will accelerate import growth. Vilnius Bank claims that the rate of export growth in 2005 should be similar to that of 2004 if the performance of Mazeikiu Nafta remains smooth.56 The expectations of market participants slightly differ from the trends projected by the European Commission. In its latest overview, the EC raised its earlier prognosis for Lithuania’s foreign trade. It expected that both exports and imports would grow at a similar rate in 2004 (8.8 percent and 8.9 percent respectively) and currently predicts a more rapid growth of exports in 2005 (9 percent as compared to 8.5 percent for imports).57 Eurochambres presents positive expectations regarding export growth and says that domestic trade will be the primary factor behind economic development in Lithuania.58 Countries of the European Union remained among Lithuania’s main trade partners in 2004. Even though the bulk of trade barriers between these countries were eliminated before signing the official agreement of EU membership, the volume of trade with the EU increased markedly over the year. Lithuanian exports to the EU-25 accounted for 66.4 percent of total exports in 2004,59 nearly one-third more than in 2003, while imports from the EU-25 constitute 63 percent of total imports the same year, as compared to merely 44.5 percent in 2003. Imports from the CIS countries have barely changed, accounting for 27 percent of Lithuanian imports, whereas exports to these countries constitute about 16 percent.60 When Lithuania joined the European Union on 1 May 2004, Lithuania’s trade regime fundamentally
MACROECONOMICS changed, both with regard to the EU and third countries. Even though the Ministry of Economy estimated that after joining the EU, Lithuania’s trade conditions with third countries could have been aggravated more considerably and could have raised the prices of goods imported from them, it is important to note that a counter-action took place at the same time – the last barriers to trade with the EU were finally removed. After joining the EU, tariff and non-tariff of barriers to trade with the EU member-states (e.g., antidumping duties and product conformity valuation) were lifted. Starting from 1 May 2004, import duties and other restrictions on certain agricultural products and, as was mentioned earlier, non-tariff barriers (such as customs procedures), were also eliminated. Reduced restrictions are reflected in indicators of trade growth with these countries. To summarize, despite unfulfilled expectations, a slower-than-expected recovery of export markets, decelerating investment processes and the changed trade regime with third countries drove down the experts’ forecasts half a year ago, currently market participants believe the foreign trade to be growing at a rapid pace. As in the previous year, the growth of exports will continue to surpass import growth in 2005.
1.3. Prices are rising at a higher rate Market participants have increased their prognoses of price growth and now report that prices grew at a higher rate in 2004 than in 2003. Similar upward trends are expected to persist this year. Experts polled during the LFMI survey evaluate changes in the average prices of goods and services intended for household consumption at the end of a given period. According to market participants, after a meagre growth in 2003, both consumer prices and producer prices increased more considerably during 2004. Consumer prices rose by 2.96 percent and producer prices increased by 3.3 percent, compared to 0.8 percent in 2003. Changes in the trade regime and increases in excise duties (see sections 1.2
Hansabank Markets, The Baltic Outlook, p. 21. Vilniaus bankas, “Lietuvos makroekonomikos apžvalga” 4 (20), 02 2005, p. 25. 57 European Commission, European Economy, Economic Forecasts, Spring 2004, p. 85. http://europa.eu.int/comm/economy_finance/publications/european_economy/2004/ee204en.pdf. 58 Eurochambres’ Economic Survey 2004, “The Business Climate in Europe’s Regions in 2004,” p.14. 59 Although after 1 May 2004 exports to the EU and acceding countries are not officially treated as exports but as taking out of the country, while imports as bringing into the country, in the LFMI survey, due to methodological purposes, trade with EU countries will be seen as foreign trade, taking out – as exports and bringing into – as imports. 60 Ministry of Economy of the Republic of Lithuania, “Annual Report of Foreign Trade,” 2004. 55 56
MACROECONOMICS
53
and 1.5), sharply mounting oil prices and a growing domestic demand reinforced by long-term consumption (see section 2.3) were the main factors behind increased prices. Meanwhile, domestic demand was stimulated by growing personal earnings (see section 2.2) and declining unemployment (see section 1.4).
be moving up the general price level. Guided by these fears, people may tend to spend their savings before 2007 by stocking up on goods expected to become more expensive after the introduction of the euro. Experts think that a number of people are already starting to hoard various items.63
Market participants have already twice significantly increased their prognoses of price growth. Already half a year ago, they markedly changed the forecast of the growth of producer prices and services (then market participants increased the figure presented in the spring of 2004 by more than 40 percent). During the current survey they were quite confident in increasing the indicators of growth of both consumer and producer prices. The ex poste estimate of the 2004 consumer prices is higher by 21 percent than the earlier forecast, and the changes in producer prices were also raised by nearly one-third. Compared to the forecasts provided a year ago, the estimates of producer prices went up by almost 40 percent.
However, it would be untrue to state that all prices are on the increase. For example, the liberalisation of trade in food products within the EU created conditions to increase the price of exported food and dairy products and to import certain goods more cheaply, without the excise duty. So, changes in prices were twofold: some prices went up, while others went down. For this reason, an overall change in the price level does not necessarily reflect the situation of individual consumers. Those consumers who bought imported dairy products and alcohol or used the services of certain telecommunication companies could therefore countervail an overall increase in prices of food products, health care and transport services.
Consumer prices were partially inflated by the expectations that EU accession would in any case push up the level of inflation. Moreover, rising oil prices and the continuing boom in the construction sector drove prices upwards.61 The level of inflation will rise due to increasing prices in the state-regulated sectors, steadily growing government consumption, rising prices of transport services and increasing wages as a result of a scarcity of labour.
Official institutions and market participants give similar evaluations of the basic trends in price changes. However, unlike the previous surveys, market participants reported higher figures than the official statistics in the current survey (see diagram 1.4). After it had lowered the 2004 forecasts of inflation several times during the year, at the end of the year the Ministry of Finance raised its prognosis twice and nearly doubled it. According to the latest data from the Ministry of Finance, the general consumer price index rose by 2.9 percent in 2004, compared to -1.3 percent in 2003. As of April of 2005, the Ministry of Finance is expecting a somewhat slower, 2.2 percent inflation in 2005.
The continued growth of consumption is affecting prices as well. Unlike in 2003, today, partly due to rising household income, households spend more on items of daily consumption, rather than put aside earnings as savings or investments; hence, not surprisingly, an evident boost of consumption has been observed for the second consecutive year. The Ministry of Finance predicts that, after a sharp 8,7 percent increase in 2004, real consumption will grow again by 8.4 percent in 2005.62 Economists claim that fears regarding the potential rise in prices after the launch of the euro may already
The European Commission also agrees that the deflation which prevailed in 200364 was replaced by moderate inflation, 1.7 percent, in 2004 and also anticipates a 2.9-percent inflation rate in 2005.65 Just as in its previous overviews, the IMF predicted a slightly lower level of inflation, 0.6 percent, in 2004. However, they expect that inflation will increase more significantly this year and will stand at 2.5 percent. Statistics Lithu-
Ministry of Finance of the Republic of Lithuania, “Lithuania’s Economic Development Outlook for 2004–2007,” www.finmin.lt. Ministry of Finance of the Republic of Lithuania, “Projections of Lithuania’s Economic Indicators, 2005-2008,” www.finmin.lt. 63 Delfi, “Prieš įvedant eurą laukiama masinio atsargų pirkimo,” 2005 03 23; “Įsivedus eurą kainos didės, pripažino R. Šarkinas,” Lietuvos bankas, 02 11 2004. 64 The growth of prices was inhibited by an increased influx of cheaper imported goods, labour productivity, which exceeded the rise of average earnings, and the intensifying competition in the retail market. 65 European Commission, Commission‘s Autumn Economic Forecasts 2004-2006. http://europa.eu.int/comm/economy_finance/publications/european_economy/2004/ee504en.pdf. 61 62
54
MACROECONOMICS
ania reports that annual inflation was 2.9 percent in December 2004, as compared to December 2003.66 This indicator of price growth remains the lowest in the Baltic countries. Latvia has announced that inflation peaked at 7.3-percent in 2004, while Estonia the same year registered a five-percent rise.67 Inflation in the euro area stood at 2.1 percent in 2004, but is expected to drop to 1.9 percent in 2005.68 Diagram 1.4 Changes of consumer prices, percent 6 5 4 3 2 1 0 -1 -2
5.5
2.4
2.4
2.3 1.4
2.9 2.9
2.58
3.28 2.2
2 1.4
0.3
-1
2.5
0.8
-1.3
1998 1999 2000 2001 2002 2003 2004 2005f 2006f SL, MF
LFMI survey
Food and beverages continue to represent the largest portion of the consumer goods and services basket (28 percent), followed by housing, fuel and transport.69 According to the official data, last year’s inflation was caused primarily by the increased prices of healthcare, transport, food products and beverages. Affected by increases in the price of diesel, transport goods and services rose by 5.4 percent over the year. Food and beverages underwent a five-percent rise, compared to January 2004. The biggest increase was recorded in the prices of healthcare goods and services – more than 10 percent during the analysed period.70 This particular component constitutes a major concern as unofficially people report that healthcare goods comprise the largest share – in some cases over 50 percent of household expenditure wich is much more than indicated by the official statistics. The construction sector saw a noticeable jump in prices as well. Increased costs of maintenance of construction machines and tools, rising wages and salaries and growing prices of construction materials and products have pushed up the prices of construction by 6.7 percent since the beginning of 2004.
Source: Statistics Lithuania, Ministry of Finance, LFMI survey
In analysing the price changes reported in the LFMI survey and those indicated by the official statistics, it is important to note that the two sources apply different tools to measure the same value. The experts in the LFMI survey evaluate changes in the average level of prices of all consumer goods and services, whereas Statistics Lithuania measures changes in the average prices of a basket of consumer goods and services. The composition of this basket, and changes made to it, thus have a big impact on the price changes measured and reported by Statistics Lithuania. Just as every year, at the beginning of 2005, after updating the composition of the basket of goods and services used for the calculation of the price index, the relative weight of expenditures on food and beverages decreased the most, while the share of expenditures on transportation and services increased the most.
According to LFMI survey respondents, producer prices went up by 3.3 percent in 2004. As refined oil products constitute a large portion of Lithuania’s entire industrial production, mounting prices of oil products have contributed rather significantly to the rise in the prices of producer goods – the oil prices increased by 24 percent over the course of 2004.71 Consequently, the doubled forecasts of producer prices during the previous year may be directly related to the leap in oil prices. When market participants provided their prognoses for the previous survey, they did not yet possess the information about the oil price growth that occurred in the autumn. According to the Ministry of Economy, the prices of the entire industrial production grew by 6 percent in 2004 as compared to the year before. Prices of mining and quarrying and manufacturing increased by 4.1 percent, while those of electricity, gas and water supply fell by 1.5 percent.72
Statistics Lithuania, 02 2005, www.std.lt. Užsienio verslo pulsas, Vilniaus bankas, 10 03 2005. 68 Commissions Autumn Economic Forecasts 2004-2006, 26 10 2004. 69 Statistics Lithuania, “Economic and Social Development in Lithuania,” 1/2005, pp. 54-58. 70 Ibid, p. 58. 71 Statistics Lithuania, “Production prices have risen by 6.8 percent in 2004”, 2005 01. 72 Ministry of Economy of the Republic of Lithuania, Rreview of the Economic and Social Situation in Republic of Lithuania in 2004,“ p. 7. 66 67
MACROECONOMICS The level of producer prices was also affected by markedly increased excise duties after EU accession (see section 1.2), which reflected in growing prices of raw materials used by individual producers in Lithuania.73 The recovery of foreign markets, even if rather slow in the case of the euro zone, augmented producer prices as well (see section 1.2). It is possible that the results of the LFMI survey were influenced by the forecasts of economic development in the foreign markets. The price of raw materials is expected to grow further in line with faster growth of the Western and Asian economies. The dynamics of oil prices will undoubtedly also play a prominent role in the short run. Soaring oil prices forced the majority of Lithuanian industrialists to search for alternative sources to offset their production costs. However, they have already announced that the prices of their production will be revised and increased in the short run.74 Rising oil prices and adverse market conditions also triggered a sharp increase in the price of liquefied gas.75 Lithuania’s membership of the EU has definitely too had an impact on the dynamics of prices. Domestic prices are rising due to subsidies for exports to nonEU markets and subsidised agricultural products brought into Lithuania from the EU. Furthermore, as mentioned, changes in the trade regime increased the prices of a number of imported goods and raw materials.76 It is important to note that Statistics Lithuania calculates changes in the prices of goods sold by producers, whereas the LFMI survey participants estimate changes in the prices of goods bought by producers, so the producer prices in the LFMI survey include imports but exclude exports. Thus the foreign trade tendencies should be more significant in the estimates and forecasts of the LFMI survey partici-
55 pants (and they are higher than the official statistics) due to the methodological differences alone as EU membership, as noted, has had a greater influence on imported goods. Diagram 1.5 Changes in producer prices, percent 30 25 20 15 10 5 0 -5 -10
23.3 18
8.6 6 2.7
1.5
2.4
3.3
2.7 1.8
1
6.8
3.6
0.8 -0.2
-3.9
-4.5
1997 1998 1999 2000 2001 2002 2003 2004 2005f LFMI survey
SL
Sources: LFMI surveys, Statistics Lithuania
The forecasts of market participants regarding greater price increases are also affected by government policies, many of which are also related to EU membership. Increases of the excise duties on tobacco products and fuel at the beginning of 2004 drove up the prices of cigarettes, petrol, gasoline and burning oil.77 The new excise duties on fuel were aligned with the former minimum rates charged in the EU.78 Starting from the beginning of 2004, a 5-percent value added tax (VAT) on pharmaceuticals and medical goods came into effect,79 and a zero tax rate on biological fuel, international passenger transport, coffins and undertaking services was abolished. From 1 January 2004, a 15-percent value added tax was also levied on land intended for construction purposes.
73 Ministry of Economy of the Republic of Lithuania, “Prekybos režimo pokyčių, Lietuvai tapus ES nare, su trečiosiomis šalimis 2002 metų importo ir eksporto duomenų pagrindu įvertinimas,“ http://www.ukmin.lt/index.php/lt/Prekyba/Uzsienio/Pokyciai2002. 74 Verslo žinios, “Peržengė ribą,” 15 10 2004, p.2. 75 Pačkauskaitė A., “Suskystintos dujos brangsta įkandin naftos,” Verslo žinios, 01 10 2004, p. 3. 76 According to the survey conducted by the Ministry of Economy, the price of import from Russia will increase, on average, by 1.8 percent, 14.8 percent from the USA, 16.6 percent from Ukraine, 10 percent from Belarus, 8.9 percent from Japan, 7.8 percent form China, and 6.5 percent from Kazakhstan. 77 The excide duty on petrol increased from 1,250 to 1,318 litas per ton, on burning oil, from 720 litas to 1,002 litas, on gasoline, from 860 litas to 1,002 litas. The specific excise duty on cigarettes was raised from 42.6 litas to 47.5 litas per 1,000 cigarettes, and the ad valorem tariff went up from 10 to 15 percent. Petrol prices increased by approximately 6 cents per litre (2.6 percent), diesel prices went up by 14 cents (6.9 percent), and a 20-cigarette pack, depending on the brand, will cost 0.24 to 0.35 litas more. BNS, „2004-aisiais brangs tabakas, degalai ir šiluma, tačiau kartu didės atlyginimai ir pensijos”, 31 12 2003. 78 Starting from 1 January 2004, the European Union increased the minimum excise duty on lead-free petrol from 287 euros to 359 euros per 1,000 litres. Upon the request of Lithuania, the European Commission proposed the Council to grant Lithuania transitional periods for aligning excise duties with the minimum EU norms: by 2011 for petrol, by 2011 for diesel during the first phase and by 2013 during the second phase, and by 2010 for electricity and natural gas. 79 Certain pharmaceuticals have been taxed since July 2002.
56 A reduced 9-percent VAT on heating of residential premises was abolished from May 1, and so heating is now subject to the same 18 percent VAT as other products and services. Prices were also augmented by increased prices of gas and electricity from the beginning of 2005. Rising prices of certain consumption goods accompanied the increase of prices of fuel. As a result of sharply increased oil prices on the global market in the second half of 2004, Lithuanian Airlines imposed a tax on fuel – 28 litas per segment of flight; the prices of taxi services went up by about 40 percent from October 1; and prices are also expected to rise for passenger bus services.80 Domestic oil prices were affected by, apart from the trends on the global markets, a reduction of customs duties on oil products from 15 to 5 percent after Lithuania had joined the EU. At the same time the enforcement of an EUwide 10-percent environment tax will drive up the prices of old vehicles and vehicles imported from third countries On the other hand, further price increases continue to be offset by strong competition on the domestic market, intensified by rising domestic supply to the markets of minor exports and an appreciating litas. Increasing productivity is also pushing the price level downwards. The fall of the general price level was primarily affected by still cheapening communication goods and services, decreased prices of goods and services of leisure and culture and falling prices of clothing and footwear, again as a result of enhanced competition.81
MACROECONOMICS Table 1.3 Changes in forecasts of consumer goods and services*
HBM LFMI** Nord/LB MF VB EC Nordea IMF
2004
2005
3.0 (2.5) 2.9 (2.5) 2.9 (2.9) 2.9 (2.7) 2.9 (1.5) 1.2 (1.0) 1.2 (1.0) 0.6 (2.5)
3.2 3.28 (2.8) 2.9 (2.1) 2.6 2.8 (2.0) 2.9 (2.2) 2.4 (2.6) 2.5
* earlier forecasts are provided in brackets ** at the end of the year Acronyms: HMB – Hansabank Markets,82 LFMI – Lithuanian Free Market Institute survey, Nord/LB Lietuva,83 MF – Ministry of Finance, VB – Vilnius Bank, EC – European Commission,84 Nordea,85 Nord/LB –IMF – International Monetary Fund86
Both local and international institutions reported very similar indicators for 2004 and 2005. Lower figures were presented by those institutions which conducted research in the autumn when the rise in oil prices was not yet so noticeable. Just as was predicted, all institutions that had lower indicators during the previous survey raised their forecasts about this time. They also increased their prognoses for 2005. While providing lower estimates of 2004, Nordea, the European Commission and the IMF expect a greater inflation rise in 2005. Market participants predict that consumer prices will go up by 3.3 percent in 2005, while producer prices will increase by 3.6 percent. Such forecasts are most likely related to falling unemployment and expectations of a rapid growth of earnings and household income, which in turn will bolster domestic consumption (see section 1.2). Rising oil prices,87 gradual harmonisation of taxes with EU provisions and increases
Although growing competition is driving down the price of carriage, some transporters think that they will start rising due to increasing oil prices. President of private company Vilniaus dobilas Remigijus Žitkevičius says that prices for carriage will grow by about 15–20 percent as a result of increased prices of fuel. ELTA, 05 07 2004; Jakubauskas R., Verslo žinios, „Taksi – pabrango, vežėjai autobusais – lūkuriuoja,“ 04 19 2004. 81 Statistics Lithuania, “0.4 per cent deflation registered in August in Lithuania,” 08 09 2004. The price growth was calculated in the entire industry, except construction. Eurostat Euro-Indicators, „Industrial producer prices stable in euro-zone and EU25,“ 03 08 2004. 82 Hansabank Markets, “Baltic Outlook,” 08 11 2004, p. 25. 83 Nord/LB Lietuva, “Lietuvos ūkio sektorių apžvalga,” 2005/5, 02 2005, p. 7. 84 European Commission, Economic Forecasts 2004-2006, Spring 2005.. 85 Nordea, ”Economic Outlook”, 02 2005, p. 37. 86 International Monetary Fund, World Economic Outlook: Advancing Structural Reforms, Sept 2004, p. 213, http://www.imf.org/external/ pubs /ft/weo/2004/01/pdf/appendix.pdf. 87 The European Forecasting Centre predicts that if the oil price will rise higher than 50 US dollars, the level of global inflation will be pushed up by 0.7 percent in 2004-2008, ELTA, “EPT: brangesnė nei 50 JAV dolerių nafta sumažins pasaulinį BVP,” 11 10 2004. 80
MACROECONOMICS
57
in excise duties are also among the reasons for the price growth. As mentioned, prices may also be augmented by increasing consumption in anticipation of rising prices after the introduction of the euro. A faster growth of prices during a period of active GDP growth is generally seen as a normal phenomenon, and the level of inflation in Lithuania is arguably not dangerously high. Generally, prices tend to move upwards as the living standard is rising – this is a prehistoric fact known as the Balassa-Samuelson effect. Thus, as Lithuania is catching up with the old EU member states, inflation should be a more typical process in the country than the deflation that was prevalent for several years.
1.4. Unemployment is driven down by economic growth and emigration Unemployment is understood as the ratio of the unemployed – persons of working age who are seeking jobs but are not necessarily registered at the Labour Exchange – to the labour force. The labour force, on the other hand, refers to all people of working age. The LFMI survey experts are asked to evaluate the real rate of unemployment in the country. The survey shows that a stable and rapid economic growth is improving the situation on the labour market. According to market participants, the rate of unemployment was 9.6 percent at the end of 2004, compared to 11 percent at the end of 2003. It is expected that unemployment will continue to fall steadily and will stand at 8.4 percent at the end of 2005. Diagram 1.6 Unemployment rate, percent 16 12 8
15.3 13.0
16.1
17.5
12.6 12.4 10.5
14.1
13.9
13.0*
12.9
12.7
11.0
11.4 9.6
10.9
8.4
4 0
1997 1998 1999 2000 2001 2002 2003 2004 2005f LFMI survey
SL/MF**
**Forecasts for 2004-2007 – average annual unemployment rate Sources: Lithuanian Free Market Institute, Ministry of Finance, Statistics Lithuania
Continued economic development and expected improvement of corporate indicators (see section 3.1) are driving down the rate of unemployment. Emigration of Lithuanian workers to other EU countries has also had an important impact on the rate of unemployment. Shortly after 1 May, a wave of job-seeking Lithuanians flooded the countries of EU-15. It is thought that 200,000 to 300,000 Lithuanian citizens are currently employed in foreign countries, most of them in other EU countries. On the other hand, recent changes in tax policies that are disadvantageous for business and labour (see section 1.5) and rigid employment regulations (see below) are impeding a more rapid reduction in unemployment. An increase of the mandatory minimum wage from 450 to 500 litas on 1 May 2004 adds to the problems.88 The mandatory minimum wage is to be raised by 10 percent once again, from July 2005. These decisions not only frustrate small-scale business in the regions but also limit the demand for unqualified labour, which comprises the bulk of the unemployed population.89 A large number of unskilled unemployed individuals and a lack of qualified specialists are serious obstacles to reducing unemployment. A lack of suitable workers is a constant complaint from construction, sewing, transportation, textile, furniture and confectionery companies.90 Thus, the current level of unemployment does not mean that there are no job vacancies in the country. Indeed, according to the Labour Exchange, vacancies exceeded the number of the registered unemployed by one-tenth at the end of last year. The constant high rate of unemployment therefore indicates a lack of qualified labour capable to take up these vacancies. Lithuania is currently faced with bigger problems than unemployment, notably an increasing shortage of qualified labour and structural unemployment, arising from a bad education system, rigid labour policies and taxation, and resulting in long term structural unemployment... The experts of the LFMI survey were asked whether companies were experiencing a lack of qualified workers. They were virtually unanimous in confirming that this was the case, often even indicating “very badly indeed.” Despite the fact that unqualified workers are usually among the first ranks of those seeking better-paid jobs in other EU
On 1 September 2003 the mandatory minimum wage was increased from 430 to 450 litas. According to the labour force survey, persons without qualifications account for almost a half of the unemployed. 90 ELTA, “Vilniuje vienam bedarbiui - trys laisvos darbo vietos statyboje,“ 06 09 2004. 88 89
58 countries, active emigration of qualified specialists to Western countries is also discernable, and serves to aggravate the situation in the Lithuanian labour market. The ineffective Lithuanian education system and a wide gap between the education curriculum and the needs of the labour market are often the underlying causes of this situation.91 According to the data of the European Education Fund, there are more specialists with university education in Lithuania than in any other European country. However, the Fund also reports that employers often are sceptical about the professional qualifications of Lithuanian graduates. According to a World Bank study, there are more people in Lithuania with university education working in industries, e.g. textiles, not requiring that kind of qualification than in any other country.92 All institutions mentioned agree on the general trends in the labour market and are unanimously predicting a further decline in unemployment. As in the previous surveys, the forecasts of market participants are lower than the official estimates presented by Statistics Lithuania, the Ministry of Finance (see diagram 1.6)93 and other institutions. It should be noted that the data of the Labour Exchange is no longer analysed in the LFMI surveys. The main reason for this is that in January 2004 the Labour Exchange started calculating the percentage of registered unemployed individuals from the total number of working age individuals, whereas most institutions and the experts in the LFMI survey measure the ratio of all unemployed persons actively seeking jobs to the total labour force. The final results of the Labour Exchange and the LFMI survey cannot thus be compared due to these methodological differences. From now on, the data presented by the Ministry of Finance will be used in the LFMI survey as the official indicator of the level of unemployment in Lithuania.
MACROECONOMICS Drawing on the results of the labour force survey conducted by Statistics Lithuania, the Ministry of Finance reports that the average annual level of unemployment dropped from 12.4 percent in 2003 to 11.4 percent in 2004. The level of unemployment is expected to decrease further by 0.5 percentage point in 2005, to 10.9 percent.94 Table 1.4 Forecasts of unemployment in Lithuania, percent MF** EC Eurostat* HBM Nordea Nord/LB LFMI
2004
2005
11.4 (11.3) 10.8 (11.4) 11.3 11.2 (11.6) 11.0 (11.5) 10.6 (10) 9.6 (.6)
10.9 (10.3) 10.2 (10.6) 10.4 (11.2) 10.2 (10.5) 9.0 (9.2) 8.4 (8.9)
* in June 2004 ** according to the data of the labour force survey, earlier forecasts are provided in brackets Acronyms: EC –European Commission,95 MF –Ministry of Finance,96 Eurosat, HMB – Hansabank Markets,97 Nordea,98 Nord/LB – Nord/LB Lietuva,99 LFMI – Lithuanian Free Market Institute survey.
The forecasts of market participants are rather moderate if compared to those of other institutions (see table 1.4). It should, however, also be noted that most institutions provide forecasts of average annual unemployment, whereas market participants forecast the level of unemployment at the end of the year. The results of the LFMI survey are similar only to the forecasts of Nord/LB. Most other institutions, the European Commission and the Ministry of Finance among them, expect a similar unemployment rate, between 1.5 and 2 percent higher than the forecasts
A project “Evaluation of the status of the development of human resources in Lithuania,” commissioned by the Ministry of Social Security and Labour and the Training Service of the Lithuanian Labour Market and carried out by the Centre of Social Analysis and Consulting (CSAC) in 2003, concludes that approximately 46 percent of the employed population in Lithuania have university level diplomas, about 70 percent of university graduates have never worked in their field of education, and the actual demand for specialists with university level qualifications is around 25 percent. Also see „Veidas,“ 29 07 2004, pp. 31-32. 92 “Lithuania: Investment Climate Assessment”, The World Bank, December 2004 93 Based on the labour force survey. These forecasts are usually among the highest indicators of the level of unemployment in Lithuania (see table 1.4). 94 Ministry of Finance of the Republic of Lithuania, “Lithuania’s Economic Development Outlook for 2004–2007,” 16 09 2004. 95 European Commission, April 2005. 96 Ministry of Finance of the Republic of Lithuania, “Lithuania’s Economic Development Outlook for 2002–2005,” 26 08 2002. 97 Hansabank Markets, The Baltic Outlook, 16 07 2004, p. 1. 98 Nordea, Economic Outlook, Feb 2005, p. 37. 99 Nord/LB Lietuva, “Lietuvos ūkio sektorių apžvalga,” 2004/1, 20 06 2004, http://www.nordlb.lt/files/Ataskaitos/Lithuanian/plsa_2004_i.pdf. 91
MACROECONOMICS
59
of the market participants. However, both institutions anticipate a reduction in unemployment this year and in 2005. Although not a single institution predicted a rise in the level of unemployment, several of them raised their earlier prognoses considerably. Nord/LB updated its forecast by 1.3 percentage point, from 8.7 percent to 10 percent in early 2005, and in April of the same they increased their unemployment indicator once again – this time to 10,6 percent. The Ministry of Finance also increased its estimate from the previous year and the prognosis of this year. The rest of the institutions referred to in the Study were more optimistic about the dynamics of the Lithuanian labour market and reduced their estimates for the country’s unemployment rates for 2005. The level of unemployment in Lithuania is one of the highest in the EU: a higher level of unemployment was reported only in Poland (19 percent in 2004 and 18.7 percent in 2005), Slovakia (18.4 percent and 17.9 percent respectively), and Spain(2005 forecast – 10.8 percent). However, unemployment is rapidly falling in the country (see diagram 1.7). Last year, Eurostat registered the most significant reduction in unemployment in the EU in Lithuania (together with Estonia and Slovakia). According to Eurostat, unemployment in Lithuania stood at 11.3 percent in 2004, compared with 12.6 percent in 2003.100 Diagram 1.7 Unemployment rate, percent 20
17.9 18.7
16
Poland
Slovakia
10.6 10.8
Spain
9.7
Lithuania
6.1
9.1
Latvia
5.9
Estonia
0
Cyprus
4
4
Slovenia
8
Hungary
9.4
EU average
12
Source: Commission‘s Autumn Economic Forecasts 2004-2006, European Commission, Oct 2004
1.5. The tax burden will increase In the LFMI survey the tax burden is understood as the ratio of total tax revenues of state and municipal budgets and funds to gross domestic product (GDP). Market participants think that the tax burden was 35.4 percent of GDP in 2004. They expect the tax burden to grow and constitute 36.3 percent of GDP in 2005. According to the ex poste estimate, the tax burden was 35 percent in 2003. A year ago market participants predicted that the indicator would not change in 2004 and 2005. However, LFMI’s respondents raised their forecasts by almost 1.5 percent in the previous survey. According to retrospective estimates given in the current survey, the tax burden constituted 35.4 percent in 2004. The tax burden and tax reform have been the most hotly debated issues among economists, politicians and society leaders in Lithuania. The majority seem to agree that the government’s tax policy exerts the greatest influence on changes in estimating and forecasting taxes. A year ago this was particularly seen in the context of EU accession, attempting to coordinate the tax policy with the European bodies and policies. Today the tax problematics are the most acute on the domestic level: grappling with the different views within the governing coalition, and an inability to decide on and pursue an effective tax reform. In previous LFMI surveys it has been stated that the tax burden had stabilised, and even though taxes were increasing, this was counterweighted by impressive economic development. During the period of growth, an increasing tax burden can be offset by rising income from non-taxed activities and sources or those taxed at lower rates. However, while the Lithuanian economy is slowing down, the government is not trying to neutralise the growing tax burden, augmented by EU membership, by cutting taxes in other areas. More importantly, the government seems to be uncertain about what tax policies it needs to pursue (if at all) and which taxes it should lower (or raise). These tax plans, when settled, are likely to further increase rather than decrease the tax burden in 2005. It is likely that the estimates of market participants are still being affected by the Law on Personal Income Tax which came into force at the beginning of 2003.
100 Eurostat, “July 2004: Euro-zone unemployment stable at 9.0%,” 01 09 2004, http://europa.eu.int/comm/eurostat/Public/datashop/printproduct/EN?catalogue=Eurostat&product=3-01092004-EN-AP-EN&mode=download.
60 With this Law, the tax burden increased as the tax rates were increased, so complicating the tax regime for sole proprietors.101 However, employment earnings continue to be taxed at 33 percent, and this fact is likely to remain central in tax burden estimations. This high rate is also levied on income from individual business activity and all other income, except established tax-exempt income, such as allowances, interest on deposits, scholarships, etc. The tax burden was also augmented by further increases in excise duties designed to bring them in line with the minimum EU levels (excise duties on diesel were raised in January 2004 and those on cigarettes went up in March 2004) and reforms of the value added tax (VAT). A reduced 9 percent VAT on heating of residential premises and a 5 percent calendar tax were raised to 18 percent from 1 May 2004. Scientific research is also subject to 18 percent VAT from 1 May 2005.
MACROECONOMICS Tax harmonisation in the EU will also augment the tax burden, and not necessarily in those areas which are specified in the agreements signed. The old EU member states that apply high taxes, in particular Sweden, France and Germany, are pushing for harmonisation of corporate profit tax, fearing that their businesses will transfer their activities to countries with lower and/or more flexible taxes. Eurostat reports that the total tax burden in Lithuania was 28.7 percent of GDP in 2003, the lowest in the EU.105 However, it is complicated to compare the general tax rate applied in Lithuania with that of other EU countries because the purchasing power in individual countries differs quite markedly. For this reason it would be more useful to compare the tax rates applied on average personal earnings in EU countries, an indicator according to which Lithuania ranks the second in the EU. Diagram 1.8
Starting from 1 May 2004, the tax burden was also increased by higher land taxes, calculated on the basis of the newly adopted land value map,102 and a 5 percent VAT levied on pharmaceuticals and pharmaceutical goods. From 1 January 2004, producers or importers of empty video and audio cassettes and compact discs have to pay 6 percent on the wholesale price, according to a new version of the Law on Copyright and Neighbouring Rights, adopted in March 2003. Starting from 1 September 2003, there is also a 20-percent sugar tax on imported sugar substitutes, syrups and other products containing sugar, depending on the sugar content.103 According to the Law on Declaration and Taxation of Sugar and Excess Reserves of Processed Sugar Products, excess sugar reserves of Lithuanian sugar producers should have been subject to import duties applied by the EU from 1 May 2005. Recently this date was moved forward to November 30, 2005.104
Relative tax burden 50 40 30
36 31
32
30
41
41
36
36
37
37
37
34
33
35 33
35
36
35
34
20 10 0
1994 1995 1996 1997 1998 1999 2000 2001 2002 2003 2004 2005f
LFMI estimates, % GNP LFMI survey, % GDP Source: LFMI, LFMI survey
It is important to highlight that the cacophony among Lithuania’s ruling political coalition has a powerful influence on the estimates of the tax burden. The former government scrapped their plans to introduce progressive income taxes and decided to revoke the
The new law replaced the former eight tax rates with two tariffs, 15 and 33 percent. Fifteen percent is now applied to the taxable income from distributed profits, income of sailors, sportsmen, performers, royalties, income received according to author’s agreements, income from rent or sales of property, pensions and life insurance benefits. The new law aggravated the tax burden for sole proprietors who, in addition to a 15-percent profit tax, must now pay income tax on that share of income which sole proprietors use for their own needs. (From the beginning of 2002 sole proprietors pay a 15-percent social insurance tax on reported income for the additional pension component.). 102 According to the Government decree on land valuation procedures revised in October 2002, starting in 2003 the land tax is calculated based on the average market price of real estate by drawing land value maps. 103 Currently the sugar tax is 1 litas per kilo. 104 The tax rate is set based on the highest import tax during a year starting from 1 May 2004, and paying in addition 4.18 litas per 100 kilos of white sugar. Verslo žinios, „Cukraus atsargas apmokestins specialiu mokesčiu,“ 28 06 2004. 105 Eurostat News Release, “Taw burden in 2003 ranged from 29% of GDP in Lithuania and Latvia to 51% in Sweden,” Jan 28, 2005. 101
MACROECONOMICS turnover tax at the end of last year. However, the current (April 2005) government has already cancelled the repeal of the turnover tax, even though the repeal was already made into a law, and is planning to preserve it until as long as the end of 2007, changing its name to a “solidarity” tax. One group of Social Democrats has also – once again – voiced their proposal for progressive income taxation.106 It should be pointed out that progressive taxation compound tax administration, provoke tax evasion and force businesses to shift production and the high-income labour force to low-income countries. Instead, it would be more effective to change the personal income tax rates, seeking to reduce the tax burden and optimise the tax system. It should therefore be applauded that finally the personal income tax rate is likely to be lowered from 33 percent to 24 percent. Sadly, however, the government has chosen a very ineffective method to implement these changes. The tax rate is to be reduced not in one go, but rather gradually over three years: from 33 to 27 percent starting from 1 July 2006, and then again to 24 percent from 1 January 2008. The ruling coalition has also announced that a “solidarity” tax and a 1 percent real estate tax for private persons (applied to real estate used for commercial purposes) will be levied, with a view to compensate for a potential loss of budget revenues. The terms and conditions of taxation will be the same as those for business entities. Apartments used for personal accommodation will not be taxed. Consequently, the tax burden is not likely to decrease; its weight will be simply shifted and divided differently among different taxes. Similar trends can be discerned in the estimates presented by the experts polled by LFMI. They believe that the tax burden will increase rather than shrink in 2005. The 2004 ex poste estimate is 1 percentage point lower that the prognosis from July 2004. However, market participants expect a nearly 1 percent increase in the tax burden this year. Survey participants forecast that the tax burden will be as high as 36.3 percent in 2005. This reflects deteriorating expectations of market participants: according to their estimates, the tax burden was lower in the past but it will increase in the short run. Such valuations run counter to the government’s declarations 106
61 that the tax burden will decrease after the planned tax reform in Lithuania. Since 1994, LFMI has calculated the tax burden on the basis of official forecasts of gross national product (GNP being gross domestic product plus net foreign proceeds) and budget revenues. Agreeing with the results of the LFMI survey, the LFMI calculations based on the official forecasts of gross national product and the indicators of budget revenues show that the tax burden declined, as compared to the previous years, and is now 34 percent of GDP. However, it should be noted that although the tax burden slightly decreased in percentage terms, the indicator in absolute terms will significantly increase. The tax burden is calculated on the basis of GDP growth, which is still rising rapidly, whereas the indicator of the tax burden does not tend downwards accordingly. The government keeps repeating that certain taxes, i.e. excise duties, have been raised as the obligation set in Lithuania’s agreement of EU membership. But the national budget is comprised not solely from the revenues from excise duties, hence when increasing the latter the government could lower other taxes simultaneously. Meanwhile, all recent statements of the government regarding tax cuts have been instantly followed by other proclamations about new taxes. This position of the government has most likely undermined market participants’ confidence and expectations for this and the coming years. In the LFMI survey the indicator of the tax burden reflects only the direct tax burden. The indirect tax burden, however, which is related to the costs of tax administration and financing of tax authorities, is just as important. Overly complex tax rules, a multitude of tax exemptions and quirks of interpreting provisions of the laws aggravate tax administration. Tax administrators wield considerable power, while tax payers’ rights are not properly protected. A new Law on Tax Administration came into force on 1 May 2004. Although this draft law was intended to introduce a new model for the relationship between tax inspectors and taxpayers, it did not properly limit the powers of the tax inspectors. The law did not reduce the obligations of private businesses to supply information and unjustifiably increased taxpayers’ costs related to the provision of information. In addition to that, the law did not repeal unacceptable methods of
Staniulytė, T., “Socdemai neatsisakė progresyvinių mokesčių,” Verslo žinios, 11 04 2005.
62
MACROECONOMICS
promoting tax payment and tax collection. According to LFMI, the implementation of provisions of this law will curb a reduction of the indirect tax burden.107 As the LFMI survey illustrates, levelling off increased taxes by factors softening this fact (such as economic growth), or reducing certain taxes while imposing new ones, is insufficient. In order to ensure the country’s competitiveness in the global market, it is crucial to implement a consistent tax policy and to conduct structural reforms that would reduce the overall tax burden. To sum up, an increase in the tax burden is expected in 2005 due to the government’s inconsistent tax policy and the EU membership. As the LFMI survey indicates, the predicted still rapid GDP growth should to some degree countervail the tax increases introduced in 2004 and 2005. Despite that, market participants project that an increase in the tax burden will be more noticeable this year.
1.6. The litas and the US dollar A steady decline of the US dollar against the euro has been observed since the beginning of 2003. This de-
preciation paused several times, but not for long. A few months ago, the US dollar started to tend upwards rather modestly, however, it hit another record low again in October 2004, dropping below the line of 2.8 litas. The experts from the LFMI survey reported that one US dollar was equal to 2.62 litas at the end of 2004. This figure is lower than the exchange rate of 2.88 litas to one US dollar predicted in the autumn, and much lower than that of 3.33 litas to one US dollar predicted a year before. However, this is practically the same exchange rate as that registered on the market at the end of January 2004. So market participants do not foresee any major changes in the value of the US dollar, and their estimates correspond to similar fluctuations on the market. Market participants forecast that the exchange rate of the litas to the US dollar will change and one US dollar will be equal to 2.7 litas at the end of 2005. This prognosis is lower than that provided in the previous survey when market participants anticipated that the US dollar will gain value and cost 2.99 litas. Although market participants do not expect a further slide of the US dollar in the short run, they do not think that this currency will strengthen either.
Estimates and forecast of the participants of LFMI survey 2003 GDP growth Shadow economy Export growth Import growth Consumer price growth Producer price growth Unemployment Tax burden Exchange rate of LTL against USD
107
7.39 19.85 11.98 11.35 0.81 0.8 10.97 35 2.88
2004 6.82 20.81 13.22 12.42 2.96 3.3 9.6 35.4 2.62
index percent
absolute
2005
-7.7% 4.8% 10.4% 9.4% 265.4% 312.5% -12.5% 1.3% -9.0%
-0.57 0.96 1.24 1.07 2.15 2.5 -1.37 0.45 -0.26
6.32 20.58 13.84 12.64 3.28 3.6 8.4 36.27 2.7
index percent
absolute
-7.3% -1.1% 4.7% 1.8% 10.8% 9.1% -12.5% 2.3% 3.1%
-0.5 -0.23 0.62 0.22 0.32 0.3 -1.2 0.82 0.08
More about LFMI’s analysis of the new Law on Tax Administration at http://www.lrinka.lt/Tyrimai/Mokest/Mokadmin.phtml (in Lithuanian).
HOUSEHOLDS
Chapter 2. HOUSEHOLDS 2.1. Household income is growing slowly but steadily In the LFMI survey, household income is defined as the average monthly money income received by a household. It includes salaries and wages, pensions, scholarships, interest, dividends, rent, gifts, winnings, bribes, allowances and other reported and unreported income. A household is understood as person or a group of persons sharing one budget. The financial situation of Lithuanian households is steadily improving in line with economic growth. At the end of 2003, market participants provided modest estimates of 2003 household income but they had high expectations of income growth in 2004. In mid-2004 they markedly reduced their earlier forecasts but raised them again in the latest survey in spring 2005. According to the ex poste estimates of market participants, the average monthly household income was higher than expected in the previous survey and amounted to 1,980 litas. The average income per household member totalled 776 litas. While market participants forecasted stagnation of household incomes in 2004, they are more optimistic in this survey. Here, they raise their 2004 estimates by about 3 percent and report that monthly household income per household member increased by 30 litas in 2004. The yearly estimates obtained from the survey of market participants show a steady growth of household income over the past five years (see Diagram 2.1). However, the 2004 ex poste estimate, 1,980 litas, differs from the earlier forecasts. It is much lower than was expected in 2003 when market participants predicted household income to amount to 2,058 litas in 2004.
63
Unfulfilled hopes related to the membership of the European Union had the biggest impact on the reduced estimates according to the market participants. Most market participants had expected a rapid increase of income, which explains their considerably higher 2004 forecasts. As the first months after EU accession failed to bring any leaps in incomes, the forecasts were consequently adjusted down. On the other hand, many factors led to real income growth in 2004, and this growth is reflected in both higher 2004 estimates and 2005 forecasts. A rapidly falling unemployment and earnings growth alone possibly had a positive influence on the estimates of household income. In addition to that, the year 2004 saw another increase of pensions, various social benefits and other budget outlays. Old-age pensions were raised three times in 2004. Starting on March 1, 2004 old-age and disability pensions were raised for individuals who had a neccessary employment record and received the lowest pensions (less than 325 litas per month). As a result, the lowest pensions, subject to the size of the current pension and the employment record, went up on average by 20 litas. In April 2004, the basic pension was increased by 20 litas (to 172 litas per month), and the insured income, which is used to calculate the supplemental monthly pension component, was again raised from 901 to 990 litas.1 After the insured income was raised, the average old-age pension went up by 28 litas (from 344 to 372 litas).2 In February 2005, the average old-age pension totalled 395 litas per month. In 2004, disability and orphan’s pensions too were increased. The orphan’s pensions paid to childrenorphans rose from 25 to 30 percent of the pension that was or could be designated to the lost parent. Maternity (and paternity) benefits were raised so
The insured income was raised almost double as much as was expected. It was last increased in July 2003 (from 886 to 901 litas) after more than a four-year break (since February 1999). 2 Social assistance benefits and compensations such as sickness benefits, maternity (paternity) benefits, and labor accident and professional sickness benefits which are calculated according to the insured income of the current year and paid from the State Social Insurance Fund were raised as well. 1
64
HOUSEHOLDS
that they now constitute 70 percent of the recipient’s compensated employment income. From 1 July 2004, early retirement pensions started to be paid to individuals who have a 30-year employment record and who are up to five years under the retirement age. As before, the estimates of average household income provided by market participants are twice as high as the numbers from the official statistics. According to the household budget survey conducted by Statistics Lithuania, the average disposable monetary household income was 496 litas per month per household member.3 Although this estimate is much lower than that provided by the LFMI survey participants, it still indicates a rather rapid growth in income. According to the official household budget survey, income per household member rose by 8.3 percent in 2004. Diagram 2.1. Disposable monetary income, litas per month* 900 800 700 600 500 400 300 200 100 0
747
597
557
588
647
656
776
834
710
496 350
364
297
349
359
346
384
1997 1998 1999 2000 2001 2002 2003 2004 2005f LFMI survey
tives. Second, a number of households most likely refuse to participate in the official surveys as they are not willing to disclose their actual financial situation to official institutions or, if the do participate, possibly underreport their household income, especially when it comes to things like unofficial pay etc. This can be seen from consumption indicators, which often exceed income indicators. According to a Lithuanian household survey conducted by LFMI in the summer of 2003,4 people in Lithuania tend to conceal as much as 37 percent of their income. Market participants think that the financial situation of the Lithuanian people will improve in 2005 but that it will not reach the previously forecasted level. It is predicted that the average household income will increase by almost 7 percent and amount to 2,127 litas per month in 2005. Income per household member will total 834 litas per month. Household income is expected to be boosted by rising income and higher social benefits. A 2005 draft budget provides for an additional 41 million litas of support for families: 50 litas per month will be paid for children aged three to seven. Starting from 2005, the child birth allowance was raised from 750 to 1,000 litas with a view to compensate for the imposition of a regular 18-percent VAT on diapers. Families raising children under one year will receive increased benefits and mothers who have raised seven or more children will be entitled to state pensions. Nursing benefits were raised from January 2005. It is also planned to increase pensions by 10 percent this year and more than 100 million litas are designated for this purpose in the 2005 budget.5
LS
*per household member (the 2003 and 2004 income estimates were calculated based on the data from the 2001 population census, which showed that an average household consisted of 2.55 persons) Source: Statistics Lithuania and Lithuanian Free Market Institute
The discrepancy between the estimates in the LFMI survey and the official numbers in the household budget survey is a result of differences in the methodologies used. First, the participants in the official surveys are for the most part relatively poor households who participate in the surveys driven by financial incen-
In 2005, state pensions will be raised twice for persons injured during the January 1991 events and for their family members. This will require 750,000 litas from the state budget. Household income will continue to be boosted by deposit compensations: the 2005 budget allocations for deposit compensations amount to 105 million litas. It is expected that unemployment will continue to fall and employment earnings will continue to in-
Statistics Lithuania, Namų ūkių biudžetų č00ė m. tyrimo rezultatai, 2005 04 11, http://www.std.lt. The survey was carried out as part of the World Bank’s “Housing Programme.” 5 ELTA, “Sodra išmokėjo 471,4 mln. litų padidintų pensijų,” 2004 11 15. 3 4
HOUSEHOLDS crease. Given that employment earnings account for 69 percent of total disposable income in Lithuania, their forecasted accelerating growth is likely to augment household income. As mentioned, social benefits, which constitute 24 percent of household income, are expected to grow both in number and value as well, and will too increase household income. In March 2005, a number of draft amendments to the law on social assistance pensions were approved. Social assistance pensions will be granted for disabled individuals from disability groups I and II and persons of retirement age who are not entitled to any other pensions. Social assistance pensions for disabled individuals will be allocated from 1 July 2005, while old-age pensions will be distributed starting from the beginning of 2006. While discussing the financial prospects of Lithuanian households, it is interesting to look at the consumer confidence indicators recently announced by Statistics Lithuania. The consumer confidence indicators reflect consumers’ expectations regarding their financial position and the country’s economic situation in the near future.6 Most of the respondents reported that their financial situation had not changed over the past twelve months and would remain the same in 2005. Those who expect a deterioration of their economic situation during the next twelve months are a minority, 14 percent.7
2.2. Earnings grew negligibly After two years of stagnation, employment earnings were expected to grow rather significantly in 2004. However, no considerable rise in earnings has been reported in 2004 (see Diagram 2.2). The LFMI survey participants estimate the average monthly reported or unreported monetary remuneration for work after tax. According to the market participants, average monthly net earnings grew by a mere 11 litas in 2004, to a total of 1,052 litas.
65 The past few surveys show that market participants tend to make optimistic forecasts of earnings growth but provide much lower ex poste estimates. The year 2004 was not an exception. More than a year before the current LFMI survey, market participants predicted that average monthly net earnings would grow to 1,113 litas in 2004, but this forecast was lowered later in the year. The ex poste estimate indicates only a very negligible increase, by 11 litas, in employment earnings during 2004. The 2005 forecasts are again higher. Market participants think that net earnings will grow by more than 8 percent and amount to 1,138 litas in 2005. Reduced forecasts of earnings growth in 2004 may be directly related to previously high expectations of a rapid leap in earnings after Lithuania became a member of the EU on May 1 and subsequent unfulfilled hopes. Moreover, market participants might have expected an even bigger wave of outward migration and increased competition on the local labour market, as was much discussed in the domestic and international press in the months leading up to the accession date. A growth of earnings can be related, albeit not directly, to a heavy tax burden. In order to ease the tax burden, employers may be forced to raise various supplements to wage earnings instead of raising the monetary wages per se. As the LFMI survey shows, three major factors have an effect on wage growth. These are labour competition caused by large-scale outward migration and endemic weaknesses of the education system, rapidly falling unemployment and growing profitability.8 Growing productivity, bolstered by new technologies and modernization, is another factor creating conditions for wage growth. The country’s wage level is also rising due to salary increases in government institutions: starting from 1 May 2004 salaries were raised for more than 200,000 employees of government institutions.9 Wage growth has also been affected by increases of the mandatory minimum wage: the mandatory minimum wage went up from 450 to 500 litas from May 2004 and will be raised by another 10 percent on 1 July 2005.
6 The consumer confidence indicator is based on a survey of a random sample of 1,200 households. It covers systematized answers to four questions – the financial situation of households, the country’s economic situation, changes in the level of unemployment and prospects of saving during the next twelve months. 7 Statistics Lithuania, “2004 metų statistiniai rodikliai,“ Press conference 2005 01 28, Presentation by Algirdas Šemeta. 8 Experts think that average wage earnings by various sectors in Lithuania lags behind the old EU member-states by 70 to 90 percent. Baltinaitė R., „Klaipėdoje ima trūkti darbo jėgos,“ Klaipėda, 2005 01 27. 9 Starting from 1 May 2004 the basic monthly wage was increased by 10 litas and now stands at 115 litas. The basic hourly pay was raised by 0.68 litas.
66
HOUSEHOLDS
Diagram 2.2 Net earnings, litas per month 1200 1000
911
969
1035
1039
722
800 600
969
955
684
741 692
1041
1052
793
890
1138 889
699
577
400 200 0
1997 1998 1999 2000 2001 2002 2003 2004 2005f LFMI survey
LS and MoF
Source: Lithuanian Free Market Institute, Statistics Lithuania, Ministry of Finance.
According to Statistics Lithuania, monthly net earnings, excluding earnings of sole proprietors, rose by 97 litas and amounted to 890 litas in 2004.10 As in the previous surveys, the estimates of market participants are higher than the official indicators (see Diagram 2.2). This discrepancy can be largely explained by methodological differences. In comparing the data from the LFMI survey with official estimates it is important to note that the official statistics reflect only officially reported earnings, while the LFMI survey shows the average level of remuneration for work, including all types of legitimate and illegitimate forms of payments. The difference between the LFMI survey data and the official statistics is therefore indicative of the (quite widespread) unreported earnings. The LFMI survey participants reported that over 40 percent of the people officially working for the minimum wage also received so called “envelope” wages.11 According to the calculations of the State Tax Inspectorate, “envelope” wages accounted for about 30 percent of actual employment earnings at the beginning of 2003.12 Other institutions also predict a more rapid growth of wage earnings. The Ministry of Finance raised,
based on the data from Statistics Lithuania, its forecasts of gross wage growth from 6.1 percent to 7.9 percent for 2004, and is expecting an even faster – 8.8 percent - growth in 2005. Vilnius Bank did not change its rather high forecast from mid-2004: average gross wage growth was estimated at 9 percent in 2004 and is expected to maintain the same growth rate in 2005.13 NORD/LB Lietuva lowered its earlier forecasts of 2004 employment earning growth by 0.5 percent – from 8.5 percent to 8 percent, but predict a 10-percent growth in 2005 and 2006.14 In November 2004, Hansabank lowered its 2004 forecast of real wage growth but expects a higher growth rate, 7.6 percent, this year.15 In the autumn of 2004, SEB forecast a 6.5-percent growth of real wages in 2004 and expect an increase of more than 7 percent over the next two years.16 Forecasts of wage growth VB Nord/LB MoF LFMI HB SEB
2004
2005
9.0 8.0 (8.5) 7.9 (6.1) 7.0 6.5 (8.1) 6.5
9.0 10 (9.9) 8.8 (6.8) 8.2 7.6 7.0**
Acronyms: VB – Vilnius Bank, Nord/LB –Nord/LB Lietuva,17 MoF – Ministry of Finance, LFMI – Lithuanian Free Market Institute’s survey, HB - Hansabank, SEB – Skandinaviska Enskilda Banken18 ** 2005-2006.
As the LFMI survey shows, a steady reduction in unemployment and growing labour demand will have the biggest effect on wage growth. Wages have been bolstered by a growing competition on the labour market caused by labour migration to other EU member-states. As was mentioned in Chapter 1, almost all of the survey participants, asked “Have business companies experienced a shortage of qualified employees lately?” unanimously answered “yes” and many even emphasised the problem.
Statistics Lithuania, “Darbo užmpkestis ketvirtąjį 2004 m. ketvirtį padidėjo,” 2005 02 23. Calculated based on quarterly data. Also known as unreported or unofficial earnings, or “pay under the table”. 12 Čaplikas A., „Nelegalus verslas išsigando perspėjimų,” Kauno diena, 2004 01 15. 13 Vilniaus bankas, “Lietuvos makroekonomikos apžvalga,“ No 4 (20),2005 02, p. 16. 14 NORD/LB Lietuva, „Lietuvos ūkio sektorių apžvalga,“ 2005 02 (2), p. 4. 15 Hansabank Markets, “The Baltic Outlook,” 2004 11 15, p. 21. 16 SEB, „Baltic Outlook,“ October 2003, p. 14. 17 Nord/LB Lietuva, “Lietuvos ūkio sektorių apžvalga”, 2004/1, 2004 06, p. 4. 18 SEB, Baltic Outlook, October 2003, p. 14. 10 11
HOUSEHOLDS Low-wage earners may expect an income increase after the mandatory minimum wage is raised from 500 to 550 litas in July 2005. On the other hand, this policy may in fact lead to some unskilled or poorly paid workers losing their current or potential jobs. According to Statistics Lithuania, approximately a sixth of the working population receives the minimum wage. This year not only certain social groups but also certain representatives of certain professions may expect to receive a higher income. A total of 21.2 million litas are designated in this year’s budget for an increase in teachers’ salaries from 1 September 2005. Doctors’ salaries were planned to be raised by 24 percent from May 2005 but this proposal was rejected by the doctors who sought a 50-percent rise. The expectations of official wage growth can also be related to talks about an increase in the tax-exempt minimum income. However, this policy measure has a limited direct effect on wage growth. Earlier increases showed that they failed to bring about the desired results because in many cases employees agree with their employers on wages after tax. In addition to that, “envelope wages,” as mentioned are very common and widespread in various sectors and among various labour groups. In conclusion, although unfulfilled hopes of a sudden leap in wages after Lithuania’s accession into the EU led market participants to lower their estimates for 2004, they still present rather optimistic expectations for 2005.
67 slumped after an upsurge in 2002 and 2003. Market participants think that average monthly household savings edged up by 7.4 percent (20 litas per month) in 2004, as compared to a 14-percent increase in 2003, to a total of 283 litas per month. Household investments amounted to an average of 265 litas per month, down by 28 litas or 9.6 percent from 2003. Household savings exceeded household investments after a one-year break. At the beginning of 2005, LFMI survey participants raised the ex poste estimates of both household investments and savings as compared with the forecasts from mid-2004. It had been predicted that investments would drop markedly, by as much as 16 percent, while savings would grow by a mere 1.5 percent. Yet, these forecasts, and even the increased ex poste estimates from the latest survey, are still much lower than the forecasts of investment growth from the beginning of 2004 when household investments were expected to grow by a total of 14 percent and amount to 333 litas per month. A marked reduction of household investment can be directly attributed to lowered expectations of household income and wage growth as compared with a year before. However, even if lower estimates of household income growth is compensated for, the share of investment in household budgets fell on average by 2 percent, from 15.4 percent in 2003 to 13.4 percent in 2004. Savings account for 14.2 percent of household income.
Household investments refer to average monthly expenditures on consumer durables (e.g. dwellings, cars), securities, leasing, as well as other investments in businesses and repaid loans for which durable goods had been purchased. Household savings are understood as the average amount of money saved by a household, including bank deposits, money held at home or lent.
Growing consumption is one of the key factors of lower saving and investment indicators. A recent consumer confidence survey conducted by Statistics Lithuania shows that the proportion of those who assessed saving prospects negatively was bigger by 40 percent than those who had positive attitudes, while in the case of consumption prospects, the share of positive responses was three time bigger than that of negative ones.19 According to the Ministry of Finance, real consumption went up by 8.5 percent in 2004 and is expected to grow by another 5.6 percent in 2005.20
The LFMI survey shows that the year 2004 saw an increase in both household savings and investments. As compared with 2003, household savings grew at a higher rate in 2004, while household investments
The growth of household investment may be affected by worsened terms of lease. According to a new Law on Value Added Tax (VAT), adopted on 15 January 2004, the 18-percent VAT for goods purchased on
2.3. Household will invest and save more this year
19 20
Statistics Lithuania, “Vartotojų nuomonių tyrimo rezultatai,“ 2005 03 01. Ministry of Finance of the Republic of Lithuania “Lithuania’s Economic Development Outlook for 2004–2007,” http://www.finmin.lt.
68
HOUSEHOLDS
lease must be paid together with the first payment. Although the lease market is rapidly expanding, this provision has caused a rise in lease prices and may have affected the estimates of the market participants. Growing construction prices is another important factor. As the costs of labour and the prices of construction materials grew, construction prices edged up by 9 percent in 2004, while the prices of dwelling construction grew even more. This has not had a profound impact on the upsurge of the demand for construction and real estate, which has been observed for the past several years now. However, certain market corrections have taken place, and have been reflected in the survey participants’ changing estimations of households’ money allocation. The instinct to save remains strong even as consumption booms. This may be partly due to a sub-conscious instinct to save formed during a long period of time when bank loans and formal credit were not available. Thus bank deposits still grew by a quarter (to 9.8 billion litas) in 2004 alone. This does not mean, however, that loans were growing slower. To the contrary: loans, impressively, were increasing at an even faster rate – they grew by 85 percent (4.5 billion litas) in 2004.21 Diagram 2.3 Households savings and investments, litas per month 400 336
350 293
300 250
218
200 150 100
182
221 215
221 200
1998 1999 2000
223
239
263
231
283
317
265
183
2001 2002 2003
savings
2004 2005f
investments
Source: Lithuanian Free Market Institute
Some of the survey participants attribute slightly lower investment numbers to the fact that investment processes have accelerated markedly for the
past several years as interests rates have fallen and so the market has been inundated. They also claim that people have acquired sufficient durables and have satisfied their investment needs. This is one hypothesis, but it contradicts the expectations of the market participants regarding the growth of household investment this year (see below) and the estimates and hopes of Lithuania’s bankers. The latter have quite optimistic attitudes towards the household investment situation in Lithuania: they believe that more and more Lithuanians will want to invest and growing wages and good prospects will continue to augment bank loan portfolios.22 Hansabank forecasts that the loan market, which went up by 61 percent in the first half of 2004, will continue to grow rapidly for several years.23 As Vilnius Bank reports, the number of bank loans granted in Lithuania may have grown by as much as 50 percent in 2004.24 “Sampo” bank specialists are just as optimistic. They predict that the housing loan market will grow by approximately 70 percent in 2005, that interests rates will go down and that the ratio of housing loans to GDP will edge up from 5.6 percent to 11 to 12 percent in 2008.25 In addition to rising wages, forecasts of a continued growth of household savings have been affected by compensations for real estate and indivual deposits from the pre-independence period. Household investments have been bolstered by higher income expectations, growing confidence of economic players (see 2.1) and increased use of banking and lease services. Consumer loans, which are frequently used to purchase consumer durables or to repay loans, are becoming increasingly popular. The rise of the loan market has been stimulated by intense competition among the banks and lease companies which has led them to lower interest rates and improve the terms of crediting. According to the Lithuanian Lease Association, the lease portfolio grew by 44.1 percent and amounted to 3.9 billion litas in 2004. It is expected to increase to 5 billion litas in 2005. Household investments will also grow due to a continuously expanding market for life insurances. The
Biliauskas M., “Skolinimosi bumas grasina virsti našta,“ Lietuvos žinios. Biliauskas M., „ Bankininkai vilioja naujomis galimybėmis,“ Lietuvos žinios, 2004 10 06, p. 7. Biliauskas M., “Skolinimosi bumas grasina virsti našta,“ Lietuvos žinios 23 Simėnas D., “Gyventojai įsuko plėtros smaigalį”, Verslo žinios, 2004 09 08, p. 10 24 Vilniaus bankas/SEB, “Lietuvos makroekonomikos apžvalga”, p. 12. Vilniaus bankas/SEB, “Lietuvos makroekonomikos apžvalga”, p. 12 25 Staniulytė, T., R. Jakubauskas, “Bankų grumtynes laimi būsto pirkėjai”, Verslo žinios, 2005 03 31. 21 22
HOUSEHOLDS
69
number of life insurance premiums singed from January through August of 2004 was 14.3 percent bigger than a year before.26 In 2005 the country’s insurance market is expected to grow by 22 to 25 percent.27 Investment incentives were furthermore enhanced by new provisions of personal income taxation. A new Law on Personal Income Tax, effective as of 2003, provides for income tax deductions for life insurance premiums which, together with contributions to pension funds, education fees and interest on housing loans, do not exceed 25 percent of a person’s income before tax. Growing earnings and household income will continue to augment household savings and investments. According to the Ministry of Finance, the share of daily consumption expenditures will decrease in 2005. Daily consumption expenditures, which went up by 8.5 percent in 2004, are expected to grow by
5.6 percent in 2005.28 Household investments will grow more rapidly as the growth of savings and consumption expenditures slows down. Market participants raised their 2005 household saving and investment forecasts. The latter were increased by as much as one-fourth. Market participants now predict that household savings will rise by 12.2 percent and household investments will go up by 27.1 percent in 2005. Savings will be smaller than investments, 317 litas per month and 337 litas per month respectively. Savings will account for about 15 percent of household budgets, whereas investments will constitute some 16 percent. As the survey shows, market participants took into account the recent consumption boom and lowered their 2004 household saving and investment estimates. A much higher rate of growth is forecasted for household savings and especially investments in 2005.
Estimates and forecast of the participants of LFMI survey 2003 Households Average household income Average net earnings Average husehold savings Average household investments
1904.83 1040.59 263.39 293.07
2004
1980 1051.58 282.78 265
index percent
absolute
2005
3.9% 1.1% 7.4% -9.6%
75.17 10.99 19.39 -28.07
2126.76 1138.28 317.36 336.81
index percent
absolute
7.4% 8.2% 12.2% 27.1%
146.76 86.7 34.58 71.81
* Income per household member was calculated based on the data from the 2001 population census, which showed that an average household consisted of 2.55 persons
Sytas A., “Lietuvoje draudimo rinka išaugo 14,3 proc.”, Verslo žinios 2004 09 20, p. 7 Paškauskaitė, R., „Draudimo rinkos prognozės puikios“, Verslo žinios 2004 09 23, p. 5 28 Ministry of Finance of the Republic of Lithuania, “Lithuania’s Economic Development Outlook for 2004–2007,” http://www.finmin.lt. 26 27
70
CORPORATE FINANCES AND INVESTMENTS
Chapter 3. CORPORATE FINANCE AND INVESTMENTS 3.1. Financial corporate indicators are stable and are slowly improving In estimating the financial situation of business companies a wide range of financial indicators is used. These are the profit margin, liquidity, turnover (asset management) and the costs of borrowing. The LFMI survey analyses the two most frequently used corporate indicators, the profit margin and the return on equity.1 The expectations of market participants have been modestly optimistic and have changed very inconsiderably for some time now. Half a year before in the LFMI survey, market participants forecast that the profit margin and return on equity would improve slightly, by increments of a percentage point. The 2004 ex poste estimate is virtually unchanged: the profit margin was reduced by 0.1 percentage point, whereas return on equity was increased by 0.4 percentage points. Market participants reported that the average profit margin was 6.2 percent and that the return on equity stood at 10.6 percent in 2004. Diagram 3.1 Profit margin and return on equity, percent 20 15 10 5 0
18.8
15.1 11
12.3
8.6
10.4
9.7
9.9
10.6
10.9
5.3
6.1
5.6
6.3
6.2
6.3
8.6 5.7
1997 1998 1999 2000 2001 2002 2003 2004 2005f Return on equity
Source: Lithuanian Free Market Institute
1
Profit margin
The official statistics confirm the growth of corporate turnover. According to preliminary data from Statistics Lithuania, the turnover of business companies rose on average by 23 percent and amounted to 100.5 billion litas in 2004, while the profit grew by 37.5 percent and totalled 5.5. billion litas. According to Statistics Lithuania, the turnover of the service sector rose much more rapidly than that of the manufacturing sector and accounted for almost 60 percent of the country’s total corporate revenues at the end of 2004. The official statistics thus confirm growing corporate profitability in Lithuania. The average profit margin (representing the rate of gross profits to sales) was 5.4 percent, up from 4.9 percent in 2003. The services sector reported the highest profitability, 8.8 percent. Manufacturing, the energy sector and construction followed (although the profitability of the energy sector and construction fell considerably as compared with 2003: the energy sector reported a 2-percent drop). In the fourth quarter of 2004, profitability fell in almost all branches of industry, with the exception of oil refinery. Services, e.g. business services, communication and telecommunication services (over 10 percent) and entertainment and leisure services (over 23 percent), were among the most profitable. Profitable companies accounted for 61 percent of businesses, down by 5 percentage points as compared with the third quarter of 2003. The LFMI survey indicates that the profit margin and return on equity will go up in 2005. Market participants predict that the average profit margin will increase to 6.3 percent and return on equity will stand at 10.9 percent in 2005. Such modestly optimistic expectations are very likely related to the continued growth of the Lithuanian economy, rising domestic demand and the membership of the EU. A growing demand for, and costs of, skilled labour and a shortage of qualified workers may have an adverse impact on corporate indicators.
The profit margin is the rate of net profits to net sales over a given period of time. Return on equity is the rate of net profits to equity capital.
CORPORATE FINANCES AND INVESTMENTS 3.2. The share of reinvested profits is decreasing The LFMI surveys show that the share of reinvested profits increased steadily from 1997 until 2001, but also that this trend reversed in 2002. According to market participants, the proportion of reinvested profits averaged 49 percent in 2004, down from 66 percent in 2001. Market participants did not change the forecast from the beginning of 2003. Diagram 3.2 Reinvested profits, percent 70 60 50 40 30 20 10 0
54
57
57
62
52
growth of capital investment in 2004 can be related to the fact that some sectors of the economy (e.g. the telecommunication sector) have already satisfied their investment needs, while others are awaiting structural funds and will invest in the near future. On the other hand, Lithuanian companies saw membership of the European Union as a strong incentive to boldly invest overseas: in 2004 foreign direct investment (FDI) of Lithuanian companies rose by 68 percent compared with 2003 and is expected to double in 2005.2 According to Statistics Lithuania, FDI in Lithuania totalled 14.964 million litas at the end of the third quarter of 2004, up by 8.5 percent as compared with 2003.3
66 54
71
49
48
1997 1998 1999 2000 2001 2002 2003 2004 2005f
Source: Lithuanian Free Market Institute
According to Statistics Lithuania, in 2005 total capital investments in the country stood at 12 percent. Investments in equipment, machines and transport were higher and comprised 30.4 percent. The volume of capital investments (expenses on construction, repair and acquisition of equipment, machines, buildings, land, etc.) rose by 4.9 percent in the second quarter of 2004 as compared with the same period of 2003. Although large companies continue to reinvest a sizeable proportion of their profits, a lower rate of
Market participants do not predict any big changes in 2005. They think that reinvested profits will decrease by one percentage point and stand at 48 percent in 2005. Although the share of reinvested profits, according to the LFMI survey participants, shrank, innovation processes did not slow down. According to market participants, expenses on research and development (R&D) accounted for 5.9 percent of companies’ total expenses in 2004,, i.e. almost as much as in 2003 (5.8 percent), but less than was expected in the previous survey, and much less than in 2001 (7.2 percent). The 2005 forecasts are more optimistic. Market participants think that the share of expenses on research and development will grow to 6.5 percent of total expenses in 2005 (which, despite the increase, is still below the 2001 level).
Estimates and forecast of the participants of LFMI survey 2003 Profit margin Return on equity Reinvested profits Expenses on research and development
2 3
2004
2005
index
percent
index absolute
updated forecast
percent
absolute
6.32 10.27 51.95
6.28 10.17 49.9
-0.6% -1.0% -3.9%
-0.04 -0.1 -2.05
6.27 10.86 47.78
-0.2% 6.8% -4.2%
-0.01 0.69 -2.12
5.78
5.93
2.6%
0.15
6.5
9.6%
0.57
Statistics Lithuania, “2004 statistiniai rodikliai,” Presentation by Algirdas Šemeta, 2005 01 28. Ibid.
72
Chapter 4. MONEY 4.1. Public debt rising, yield on government securities falling According to the Ministry of Finance, at the end of February 2005 the Lithuania’s central government debt was 12.1 billion litas, or 18.2 percent of the projected GDP. In 2004, the central government debt totalled 11.58 billion litas or 18.7 percent of GDP.
MONEY
Diagram 4.1 Average yield on government securities in litas, percent 10 6
In 2004, the average maturity of government securities sold in auctions and in circulation was 1,126 days. During last year, the maturity of government securities in circulation continued to be lengthened as more long-term government bonds were issued. The issuing of long-term government bonds was stimulated by high demand for government securities, a favourable reaction of the financial markets to Lithuania’s joining the EU and the ERM II, low base interest and a shrinking profitability gap between Lithuanian government securities and those of other EU member states. Given a longer maturity of government securities, the amount of government securities with one month before maturity at the end of 2004 rose by 12 percent.2
5.7
7.1
7.0
3.2
3.7
7.5
5.7
4 2 0
After the major structural changes of 2002, 1 the maturity composition of government securities has remained essentially the same. At the end of 2004, the nominal value of five-year government bonds comprised the biggest share, 34 percent, of unredeemed government securities sold in auctions. Treasury bills (government securities for one year and less) comprised 9.8 percent of all government securities, as compared to 20 and 30 percent in 2002 and 2001 respectively.
7.7
8
2.1
2.2
6 months 1 year
2 years 3 years 5 years 7 years
2001 2002
4.4
10 years
2003 2004
Source: Ministry of Finance
Lithuania’s stable financial situation, good macroeconomic indicators, high demand for safe securities and improved credit ratings3 have continued to drive down interest rates on government securities denominated in litas. The average yield on government securities slipped from 4.63 percent in 2002 to 3.74 percent in 2003 and 3.02 percent in 2004. According to the LFMI survey participants, the yield on 3-year government bonds on the central market was 3.75 percent at the end of 2004. This estimate is higher than the average yield on 3-year government bonds recorded at the end of 2004.4 In the previous survey, market participants forecasted a moderate increase in interest rates. This time the forecasts are even more cautious: the LFMI survey participants lowered their 2005 forecasts and do not expect any sizeable rise in the yield on government securities.
1 In 2002 the issue of one- and three-month treasury bills was terminated, and in March 2002 ten-year government securities were first issued. 2 Bank of Lithuania, Presentation to the Seimas of the Republic of Lithuania, http://www.lb.lt/leidiniai/pranesimas_seimui/pranesimas_2004. pdf, p. 36. 3 At present Moody’s rating for Lithuania’s long-term borrowing in foreign currency is A3 with positive prospects and for long-term borrowing in domestic currency, A3. The ratings from Standard&Poor’s and Fitch are A- with neutral prospects and A- with for long-term borrowing in foreign currency and A- and A for long-term borrowing in domestic currency. 4 The average yield on three-year government securities issued at the end of 2004 was 3.21 percent.
MONEY Market participants predict that the yield on threeyear government bonds on the central market will be 3.67 percent at the end of 2005. The main factors that brought about changes in the central government debt in 2005 were the issuing of 11-year Eurobonds for 600 million euros (2.072 billion litas) on foreign markets and the redemption of 325 million euros (1.122 billion litas) of Eurobonds issued in 2000. After a successful Eurobond issuing this year’s state debt rose by 443.9 million litas and at the end of February 2005 amounted to 12.1 billion litas, or 18.2 percent of the projected GDP in 2005.
73 bigger by 4.8 billion litas or almost 40 percent than a year before. Although the number of loans extended to private individuals rose rapidly in 2004 and the share of loans drawn by private individuals rose to 26 percent of all loans (up from 20 percent a year before), loans to business entities comprised a much larger amount in absolute terms. In 2004, business entities received loans worth 2.6 billion litas more than in 2003, while for private individuals this indicator was two billion litas. At the end of 2004 loans extended to individuals amounted to 4.5 billion litas, a 85-percent rise from 2003.5 Diagram 4.2
It is likely that the expected higher yield on government securities is related to the U.S. Federal Reserve Bank’s decision to raise its interest rates. In 2004, the Federal Reserve raised the interest rates three times, each time by 0.25 percentage point.
4.2. Interest on loans has stabilised and borrowing continues to grow The LFMI survey shows that the cost of borrowing from commercial banks rose slightly at the end of 2004. According to market participants, at the end of 2004 both one- and five-year loans in litas cost on average 5.5 percent; this year the costs are expected to grow to 5.6 and 5.7 percent respectively. The survey participants are asked to evaluate all the costs reklated to borrowing, something that is not accounted by the official statistics. In 2004, interest rates on commercial loans stabilised and remained at a similar level as in 2003. According to the Bank of Lithuania, the average interest rates on 1 to 5-year loans and loans over five years denominated in litas were 6.1 and 4.8 percent respectively. The level of interest rates in Lithuania is a reflection of global trends. It is also affected by a high liquidity of the Lithuanian banking system and strong banking competition. In 2004, the loan portfolio of Lithuanian commercial banks continued to grow. As the Bank of Lithuania reports, at the end of 2004 the loan portfolio of commercial banks in Lithuania was 16.8 billion litas, 5
16 14 12 10 8 6 4 2 0
Interest rate on one-year loans, percent 12.6 8.9
7.0
7.3
5.7 6.4
Dec. 00
Dec. 01
Dec. 02
in litas, LFMI in litas, Bank of Lithuania
5.5
5.8
Dec. 03
Dec. 04
in euros, LFMI survey in euros, Bank of Lithuania
Source: Lithuanian Free Market Institute, Bank of Lithuania
In addition to bank loans, lease and factoring are getting increasingly popular. The lease and factoring portfolios account for an increasingly bigger proportion of bank loans (including bank loans extended to other banks and financial institutions) and their rate of growth is as high as that of bank loans. In 2004, the lease portfolio grew by 44 percent and amounted to 3.887 billion litas. It is expected to increase to 5 billion litas in 2005. The factoring portfolio, according to the Lithuanian Lease Association, edged up by 35.8 percent in 2004 to a total of 3.6 billion litas. LFMI survey experts believe that the share of non-bank loans (including lease and factoring) represented 15.7 percent of the loan market in 2004 and that it will remain at a similar level, 16 percent, in 2005. A new Law on Financial Institutions, which paralleled lease and factoring services to bank loans, has had
Biliauskas M., Skolinimosi bumas grasina virsti našta,“ Lietuvos žinios.
74 an adverse effect on the lease and factoring market. The existing law on joint stock companies and other legal acts prohibit lending by joint stock companies above the amount of their equity capital. This means that lending opportunities of lease and factoring companies are considerably restricted. Lease services avoided only by a narrow margin another painful restriction. According to amendments proposed to the Law on Financial Institutions in the spring of 2004, a number of services currently provided by lease companies would be classified as services which would be prohibited from generating more than 10 percent of revenues of lease companies. Business lease, purchase on lease, lease agreements with supplementary services and other services would be included among such services. Although these amendments were not adopted, other excessive restrictions continue to pose challenges to the development of the non-bank crediting market. This means that banks are unlikely to face stronger competition in the near future.
4.3. Saving is growing slowly According to the Bank of Lithuania, the deposit portfolio of Lithuanian commercial banks grew by 31.6 percent or 17.9 billion litas in 2004 and totalled 17.9 billion litas on 1 January 2005. Of this, resident deposits comprised 9.8 litas, an increase of 1.9 billion litas or 24.4 percent, from the previous year. Analysis of the composition of deposits shows that resident deposits continued to grow markedly. Time deposits rose by 27 percent and time deposits in litas edged up by 39 percent. Demand deposits grew by 28 percent and now account for 44 percent of all deposits of private individuals. The main reasons for this are economic growth, growing household incomes, an increasing number of companies which transfer salaries to bank accounts, promotion of debit and credit cards and the banks’ efforts to attract as many as possible time deposits. Corporate deposits (both demand and time deposits) grew at a lower rate in 2004. Demand deposits held by private firms totalled 2,2 billion litas at the end of 2001; and already 3,1 billion litas at the end of August 2004. Time deposits amounted to 504.8 million litas at the end of 2001; and 1,4 billion litas at the end of
MONEY August 2004. The composition of deposits did not change much in 2004: the proportion of time deposits in litas grew from 60 to 65 percent of all time deposits, while the share of demand deposits in litas slumped by 5 percent to 74 percent. It is likely that the number and size of time deposits grew as companies safely and profitably invested a growing amount of free operating assets in time deposits. In 2004, as usual, most deposit agreements were made for time deposits under one month, on average 4 billion litas a month. Some 700 to 800 million litas a month were accepted in deposits over one month. These amounts are similar to those deposited in 2002 and 2003. A particularly high growth was recorded for deposits above two years, whose share went up by 80 percent in 2004. Such trends can be explained by higher interest on long-term deposits, growing saving needs and opportunities for saving, improved attitudes towards banks and intense banking competition and advertising. On the other hand, time deposits above two years still account for less than 1 percent of all time deposits. The yield on deposits continued to fall in 2004. According to the Bank of Lithuania, the average interest rate on deposits denominated in litas was negative as it did not outweigh inflation. Given strong banking competition, reduced costs, falling base interest and exchange and credit risk, the interest rates on deposits and loans in litas and euros remained almost the same throughout 2004. The average yield on time deposits in litas, as compared with other currencies, was the highest and stood at 1.37 percent at the end of August 2004 (1.27 a year before). The average interest rates on time deposits in U.S. dollars and euros edged up by 0.36 and 0.06 percentage point and were 1.20 and 1.59 percent respectively at the end of August 2004. Diagram 4.3 Average interest rates on deposits, percent 3 2,5 2 1,5 1 0,5 0
Dec. 01 litas
Dec. 02 euros
Dec. 03
Aug. 04
US dollars
Source: Lithuanian Free Market Institute, Bank of Lithuania
MONEY
75
Interest rates on deposits are not likely to change markedly this year as commercial banks can derive foreign credit resources at favourable conditions. The current economic situation and the prospects of the euro area and related policies of the European Central Bank policy are not likely to cause an increase in interest rates on deposits either. Admittedly, interest rates on U.S. dollar deposits may go up as a result of the restrictive monetary policy pursued by the U.S. Federal Reserve Bank. Estimates and forecast of the participants of LFMI survey 2003 Interest rates 1-year loans in litas 5-year loans in litas 3-year government securities Non-bank loans
5,72 5,75 3,9 18,77
2004
5,46 5,47 3,57 15,65
2005
index
percent
index absolute
updated forecast
percent
absolute
-4,5% -4,9% -8,5% -16,6%
-0,26 -0,28 -0,33 -3,12
5,61 5,71 3,67 15,96
2,7% 4,4% 2,8% 2,0%
0,15 0,24 0,1 0,31
76
CONCLUSIONS According to the survey of market participants conducted by LFMI in January to February 2005, the economic situation in Lithuania in 2004-2005 remained stable. The economy is still growing rather rapidly, but not as fast as in 2003; the financial situation of Lithuanian companies is improving, unemployment rates are declining, and the average salaries, although not growing as fast as expected in 2004, , are expected to increase rather considerably in 2005. Economic growth is stimulated by growing consumption, a strong domestic market and export growth, growing investments, and brighter expectations of both companies and people. On the other hand, the survey also shows that the size of the rather large shadow economy has not been decreasing for several years, and instead appear to be growing: the market participants believe that currently the levels of shadow economy are growing. Moreover, as many as four in ten people that officially earn the minimum salary additionally get receive payments in “envelopes.” Overall, the market participants’ estimates are much more moderate than a year ago. At the beginning of 2004, inspired by high expectations of the upcoming European Union (EU) accession, the market participants voiced very optimistic prognoses in almost all sectors. This time, however, while they still expect to see a constant growth in employment, average salaries, investments and foreign trade, market participants do not project any rapid changes brought about by any external factors. As the LFMI survey shows, Lithuania’s economic growth remained steady in 2004 but not as rapid as in 2003. Lithuania’s gross domestic product (GDP) grew by 6.8 percent in 2004 as compared to 7.4 in 2003. It is projected that the economic growth will slow down even more significantly in 2005 – it is estimated that the economy will grow only by 6.3 percent. The estimates of 2004-2005 GDP growth provided by market participants are a little bit lower than the previously reported forecasts, but in general coincide with the forecasts put forward by official national and international institutions. According to the most recent LFMI survey, the most prominent factors resulting in the lower growth estimates are, first, a shortage of a qualified labour (a result of large-scale outbound
CONCLUSIONS
migration to the other countries of the EU, and a declining quality of the education system); and, second, a failure to initiate and implement structural reforms in a number of strategic sectors where reform is badly needed, the latter resulting in a prolonged scarcity of foreign investment. On the other hand, the economy is stimulated by the rapid expansion of the internal market, consumption, foreign trade and gradually recovering investment flows. Contrary to the market participants’ earlier expectations, the levels of shadow economy have not decreased; just the opposite, over the past year, the shadow economy appears to have expanded. According to the market participants, in 2004 the shadow economy accounted for as much as 20.8 percent of GDP as compared to the expected 18.6 percent. It is not expected to change much in 2005: the market participants project that it will only go down to 20.6 percent by the end of the year. Market participants’ expectations have changed significantly over the course of the last year. In the spring of 2004, in light of optimistic expectations regarding the country’s membership of the EU and awaiting the long-incubated tax reform, market participants predicted a shift in the shadow economy for the first time in three years, down from the stable 20 percent in 2002-2003 to 18.6 percent in 2004. This is more than 2 percent less than the estimate given in the last survey, when the market participants raised the estimates to almost 21 percent. The continued large shadow economy is a result of a high tax burden – which is also likely to increase, inconsistency and unpredictability of government tax policy, strict regulations of labour relations, further increases of excise duties on cigarettes and fuel and deteriorated conditions for individual businesses. Market participants polled by LFMI believe that foreign trade continues to grow rapidly, and the growth rate is not expected to decline in the near future. The ex poste estimates of the growth of both exports and imports are higher than market participants’ earlier forecasts. Market participants also believe that exports again grew more rapidly than imports. According to the survey, in 2004 exports grew by 13.2 percent and imports rose by 12.4
CONCLUSIONS percent as compared to 12 percent and 11.4 percent respectively in 2003. Higher estimates of export growth as compared to import growth can be attributed to the membership of the EU, which has arguably had a stronger effect on the dynamics of import growth, making import from some third countries more expensive. On the other hand, these higher prices could be offset by seeking cheaper alternatives elsewhere and by the lower price of imports from EU countries. Market participants’ higher expectations and resulting higher estimates and forecasts for the foreign trade growth (and export growth in particular) are bolstered by the removal of trade barriers after EU accession, the slowly recovering economy of the euro area, accelerating economic growth in the US, and rising prices of oil and metals. Higher expectations regarding import growth can also be related to increased estimates of household income, the purchasing power and daily consumption expenditures, and, partly, to slightly recovering investment processes. Survey participants predict that foreign trade will increase even more this year: exports are expected to go up by 13.8 percent and imports by 12.6 percent. As in the previous year, in 2005 export growth is likely to continue to surpass import growth. Market participants have increased their prognoses of price growth and now report that prices grew at a higher rate in 2004 than in 2003. Similar upward trends are expected to persist this year. According to market participants, after a very slow growth in 2003, both consumer prices and producer prices increased more considerably during 2004. Consumer prices rose by 2.96 percent, while producer prices increased by 3.3 percent, compared to only 0.8 percent in 2003. The main factors that contributed to the higher prices were higher household income and stimulated domestic demand reinforced by long-term consumption, changes in the trade regime, increases in excise duties, and sharply mounting oil prices. Consumer prices were also partially inflated by the expectations that EU accession would in any case push up the level of inflation as well as by increasing prices in the state-regulated sectors, steadily growing government consumption, rising prices of transport services and increasing wages. The much higher – almost doubled –forecasts of producer prices during the previous year may be directly related to the leap in oil prices. The level of producer prices was also affected by markedly increased excise duties after EU accession, which contributed to rising prices of raw materials used by individual producers in Lithuania. Mostly driven by the same factors as in 2004, this year consumer prices are projected to go up
77 by 3.28 percent, while producer prices are estimated to increase by 3.67 percent. The survey shows that the situation in the labour market continues to improve as a result of the steady economic growth. According to market participants, the rate of unemployment was 9.6 percent at the end of 2004, compared to 11 percent at the end of 2003. It is expected that unemployment will continue to fall steadily and will stand at 8.4 percent at the end of 2005. Emigration of Lithuanian workers to other EU countries has also significantly contributed to the lower unemployment rate. On the other hand, a more rapid decrease in unemployment is stalled by unfavourable tax policies, rigid employment regulations, and increases of the minimum wage. Moreover, the lower unemployment rates should not be seen as a solely positive development, since it is in large part caused by outbound migration, and covers up more fundamental problems of the Lithuanian labour market, such as structural unemployment and a large number of people who are out of work for a prolonged period of time – 2 years or longer. This specific – and not too encouraging – feature of the Lithuanian labour market is partly a result of the serious deficiencies of a national education system that produces a large number of poorly skilled workers that are not valued in the labour market. According to market participants, the tax burden was 35.4 percent of GDP in 2004. They expect the tax burden to grow and constitute 36.3 percent in 2005. The ex poste estimate of the 2003 tax burden was 35 percent and the market participants believed it would not change in the near future. However, in the current survey the market participants raised both the estimates of 2004 and, especially, the prognosis for 2005. . The higher estimates are possibly a result of the government’s unpredictability, both unclear and inefficient tax policy, and the EU membership. And even if the predicted still relatively rapid GDP growth should to some degree countervail the tax increases introduced in 2004 and 2005, market participants project that the increase in the tax burden will be more noticeable this year. In order to ensure the country’s competitiveness in the global market, it is crucial to implement a consistent tax policy and to conduct structural reforms that in the long run would reduce the overall tax burden. In the last couple of surveys market participants have tended to make optimistic forecasts of earnings growth but provide much lower ex poste estimates. This time, too, after (one year ago) having forecast a rapid wage growth, reaching 1,113 litas at the end of 2004, market participants have been reducing their prognoses over the course of the last year. According to their current
78 estimates, the average monthly earnings grew very insignificantly last year. Market participants estimate that average monthly net earnings grew by a mere 11 litas in 2004, to a total of 1,052 litas. Reduced forecasts of earnings growth in 2004 may be directly related to previously high expectations of a rapid leap in earnings after the EU accession on May 1 and subsequent unfulfilled hopes. The slower earning growth might also be influenced by high labour taxation, and non-monetary wage supplements. Market participants think that net earnings will grow by more than 8 percent and amount to 1,138 litas by the end of 2005. The more optimistic forecast could be driven by declining unemployment and increased competition in the labour market (resulting from emigration and gaps in the education system), as well as by growing corporate profits. The increased minimum wage, and the prospects of it being increased again this year, could also have contributed to the higher average monthly earning expectations. The economic growth has had a continuous positive impact on the financial situation of Lithuanian households. The yearly estimates obtained from the survey of market participants show a steady growth of household income over the past five years. However, just like with earning forecasts, the market participants’ ex poste estimates are often much lower than the initial prognoses. According to the ex poste estimates of market participants, average monthly household income amounted to 1,980 litas in 2004 while the average income per household member totalled 776 litas. Even though this estimate is higher than expected in the previous survey (when the market participants were warning about a potential stagnation of the household income growth), it is still far from the optimistic prognosis of 2,058 litas, given at the end of 2003. According to the market participants, unfulfilled hopes related to the membership of the EU had the biggest impact on the reduced estimates. Most market participants had expected a rapid increase of income after accesssion, which explains their considerably higher initial forecasts for 2004. As the first months after EU accession failed to bring any leaps in incomes, the forecasts were consequently reduced. On the other hand, a rapidly falling unemployment and earning growth alone possibly had a positive influence on the estimates of household income. In addition to that, the year 2004 saw another increase of pensions, various social benefits and other budget outlays. Market participants think that the financial situation of the Lithuanian people will improve in 2005 but, just
CONCLUSIONS as before, it will not reach the previously forecasted level. It is predicted that the average household income will increase by almost 7 percent and amount to 2,127 litas per month in 2005, while the average income per household member will total 834 litas per month. Household income is expected to be boosted by declining unemployment, rising incomes, higher social benefits and continuing deposit compensations. At the beginning of 2005, LFMI survey participants raised the ex poste estimates of both household investments and savings as compared with the forecasts from mid-2004. The current survey shows that the year 2004 saw an increase in both household savings and investments. As compared with 2003, household savings grew at a higher rate in 2004, while household investments slumped after an upsurge in 2002 and 2003. Market participants think that average monthly household savings edged up by 7.5 percent (20 litas per month) in 2004, as compared to a 14-percent increase in 2003, to a total of 283 litas per month. Household investments amounted to an average of 265 litas per month, down by 28 litas or 9.6 percent from 2003. Household savings again exceeded household investments after a one-year break. Growing consumption is one of the key factors of lower saving and investment indicators. However, higher income expectations, growing confidence of economic players, intense competition among the banks and lease companies, and a growing interest in life insurance are instead boosting the investment growth. Market participants, having raised the savings estimate somewhat, expect the investments to increase by as much as onefourth. Market participants now predict that household savings will rise by 12.2 percent and household investments will go up by 27.1 percent in 2005. Savings will be smaller than investments, 317 litas per month and 337 litas per month respectively. Savings will account for about 15 percent of household budgets, whereas investments will constitute some 16 percent. To sum up, market participants took into account the recent consumption boom and lowered their 2004 household saving and investment estimates. However, a much higher rate of growth is forecasted for household savings and especially investments in 2005. The expectations of market participants in terms of corporate indicators have been modestly optimistic and have changed very inconsiderably for some time now. In the LFMI survey presented six month ago, market participants forecast that the profit margin and return on equity would improve slightly, by increments of a percentage point. The 2004 ex poste ex poste estimate is virtually unchanged: the profit margin was reduced
CONCLUSIONS by 0.1 percentage point, whereas return on equity was increased by 0.4 percentage point. Market participants reported that the average profit margin was 6.2 percent and that the return on equity stood at 10.6 percent in 2004. The LFMI survey indicates that the profit margin and return on equity will go up in 2005. Market participants predict that the average profit margin will increase to 6.3 percent and return on equity will stand at 10.9 percent in 2005. Such modestly optimistic expectations are very likely related to the continued growth of the Lithuanian economy, rising domestic demand and the membership of the EU. A growing demand for, and costs of, skilled labour and a shortage of qualified workers may have an adverse impact on corporate indicators. The LFMI surveys show that the share of reinvested profits increased steadily from 1997 until 2001, but also that this trend reversed noticeably in 2002. According to market participants, the proportion of reinvested profits averaged 49 percent in 2004, down from 66 percent in 2001. Market participants did not change their forecast from the beginning of 2003 and do not predict any big changes in 2005. They do, however, think that reinvested profits will decrease by one percentage point and stand at 48 percent in 2005. Although the share of reinvested profits, according to the LFMI survey participants, shrank, innovation processes did not slow down. According to the survey, expenses on research and development (R&D) accounted for 5.9 percent of companies’ total expenses in 2004, i.e. approximately as much as in 2003 (5.8 percent), but less than was expected in the previous survey, and much less than in 2001 (7.2 percent). The 2005 forecasts are more optimistic. Market participants think that the share of expenses on research and development will grow to 6.5 percent of total expenses in 2005 (which, despite the increase, is still below the 2001 level). According to the LFMI survey participants, the yield on 3-year government bonds on the central market was 3.75 percent at the end of 2004. This estimate is higher than the average yield on 3-year government bonds in the market, as recorded at the end of 2004: the average yield on three-year government securities issued at the end of 2004 was 3.21 percent. Moreover, if in the previous survey the market participants projected a moderate increase in interest rates, this time the forecasts are more cautious. In fact, the LFMI survey participants lowered their 2005 forecasts and do not expect any sizeable rise in the yield on government
79 securities. They predict that at the end of 2005 the yield on three-year government bonds on the central market will be 3.67 percent. The LFMI survey shows that the cost of borrowing from commercial banks rose slightly at the end of 2004. According to market participants, at the end of 2004 both one- and five-year loans in litas cost on average 5.5 percent. The modest increase in interest rates in Lithuania is a reflection of trends on the world’s financial markets. A high liquidity of the Lithuanian banking system and strong competition among banks are other reasons behind the modest growth of interest rates. According to the survey, the costs of borrowing will tend upwards in 2005. Market participants predict that interest rates on one-year loans in litas will be 5.6 percent, and that the rates for five-year loans in litas will stand at 5.7 percent at the end of 2005, which are still rather modest indicators if compared to the ones predicted in 2004. In addition to bank loans, lease and factoring are getting increasingly popular. The lease and factoring portfolios account for an increasingly bigger proportion of bank loans (including bank loans extended to other banks and financial institutions) and their rate of growth is as high as that of bank loans. LFMI survey experts believe that the share of non-bank loans (including lease and factoring) represented 15.7 percent of the loan market in 2004 and that it will remain at a similar level, 16 percent, in 2005. The participants in the LFMI survey reported that one US dollar was equal to 2.62 litas at the end of 2004. This is practically the same exchange rate as that registered on the market at the end of January 2004. Market participants do not foresee any major changes in the value of the US dollar, and forecast that one US dollar will be equal to 2.7 litas at the end of 2005. Thus although market participants do not expect a further slide of the US dollar in the short run, they do not think that the currency will strengthen either. *** The next survey will be conducted in the middle of 2005 and will show if and how market participants’ expectations for the year 2005 will change and what trends are expected in 2006.
80
CONCLUSIONS
TYRIMO EKSPERTAI/SURVEY PARTICIPANTS Eimantas Viršila (FMĮ „Suprema“); Remigijus Vainius (UAB „Baltijos parkai“); Marek Kovalevski (UAB „Constructus“); Jonas Varkauskas (UAB „If draudimas“); Viktorija Trimbel (UAB „Omnitel“); Kęstutis Kvainauskas (Advokatų kontora Miškinis, Kvainauskas ir partneriai); Nerijus Datkūnas (AB „Utenos trikotažas“); Vitalija Freitakaitė (UAB „Javinė“); Algirdas Kateiva ( KLASCO servisas); Renata Krikščiūnaitė (Barono TŪB „Salda“); Dijana Pėlikienė ( AB „Klaipėdos nafta“); Kastytis Vyšniauskas (UAB „Sulinkiai“); Šarūnas Nedzinskas ( AB „Lietuvos draudimas“); Rimantas Tuskevičius ( UAB „Eko Rivi“); Vytautas Meištas (AB „Ragutis“); Gediminas Garkauskas (UAB „Kuršių linija“); Daiva Rakauskaitė (UAB „Viastrata“); Rimas Varanauskas (UAB „Baltijos baldų grupė“); Virgilijus Paplauskas (UAB „ECG“); Rasa Žvirblienė (AB „Šilutės baldai“); Žilvinas Pakeltis (UAB „Tetra Pak Lietuva“); Valdemaras Vaičekauskas (Lietuvos laivybos maklerių ir agentų asociacija); Sandra Klimienė (UAB „Baltijos baldų grupė“); Vilija Milaševičiūtė (UAB „Vilkyškių pieninė“); Daiva Šlekienė (UAB „Senukų prekybos centras“); Tomas Pauliukonis (UAB „Tegra“); Antonis Balkūnas (UAB „Vokė – III“); Vaclovas Šleinota (UAB „Vilniaus Vingis“); Algimantas Kundrotas ( Bayerishe Hypo- und Vereinsbank AG, Vilniaus skyrius); Rimantas Kraujalis (UAB „EKSMA“); Gintaras Kandroška (UAB „Fauga“); Kęstutis Lipnickas (UAB „Santa Monica Networks“); Dalius Tekorius (Reval Hotel Lietuva); Aleksandras Abišala (TŪB „A. Abišala ir partneriai. Konsultacinė firma“); Sigitas Petraitis (UAB „Žabolis ir partneriai“); Darius Janulevičius (UAB „Hermis Capital“); Vaidas Savukynas (UAB „MG Baltic Trade“); Rolandas Markevičius (UAB „Algoritmų sistemos“); Saulius Bačauskas (APB „Apranga“); Dalijus Skietris (AB „Audimas“); Danutė Žižienė (LPC „Litexpo“).
LIETUVOS LAISVOSIOS RINKOS INSTITUTAS LITHUANIAN FREE MARKET INSTITUTE
LIETUVOS EKONOMIKOS TYRIMAS 2004/2005 (2) A SURVEY OF THE LITHUANIAN ECONOMY 2004/2005 (2) Spaudai paruošė ir spausdino UAB „Petro ofsetas“ Žalgirio g. 90, LT-09303 Vilnius


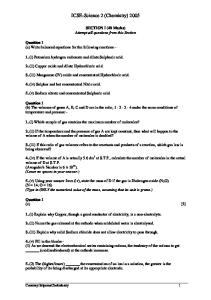

![v1 [cs.os] 2 Nov 2005](https://kipdf.com/img/300x300/v1-csos-2-nov-2005_5b12869c7f8b9a3c688b4610.jpg)


