October 2014
Vintage Report
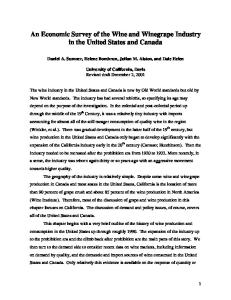
WFA winegrape crush survey and 2015 outlook The 2014 Australian grape crush is estimated at 1.70 million tonnes, a 7% decrease from last year’s crush1. This figure is on par with the 7-year average and 136,000 tonnes lower than last year’s crush estimate. The decrease in overall crush is attributable to generally lower yields per hectare in some of the cooler temperate regions, offset by higher yields in the warm inland regions. Total Winegrape Crush (‘000 tonnes) in Australia 2008-2014 2014 WFA Estimate: 1.7 million tonnes
2,500 7-year average: 1.7million tonnes
The 2015 vintage will continue to present challenges to the industry. Unless the industry takes proactive action to grow the demand opportunity and accelerate the correction in the supply base, the industry will continue to see seasonal pricing fluctuations around an already low base. This should be a further incentive for the industry to pursue the necessary initiatives outlined in WFA’s Actions for Industry Profitability. See discussion on page 6. 165,000
Vineyard 160,000 area
1,500
In 2009, total bearing area of vines in Australia was around 155,000 157,000 hectares according to ABS Vineyard estimates. Since then, it has declined and in 2013 total bearing area was around 150,000 133,000 hectares2. 2014
Sources: Historical crush figures - Levies Revenue Service (LRS), ABS and WFA
135,000
2013
2012
2011
2010
Total area (including non-bearing) Bearing area
130,000
2013
2012
2011
2010
*Some caution must be applied in interpreting 2013 figures due to change of data source
125,000 120,000
2009
140,000
2009
145,000 120,000
2008
150,000 125,000
2008
The 2012 Expert Review analysis on production profitability has been extended to include 2014 data. Accounting for a 3% increase in the cost of production, profitable production across all regions decreased to 7% of total production and unprofitable production increased to 84%. Results are due to factors such as an approximate 11% decrease in the average winegrape purchase price from 2012 to 2014, decrease in average yields for the cooler temperate regions and an increase in yields for the warm inland regions. See page 4 for discussion.
140,000
160,000 135,000 155,000 130,000
Vineyard area (ha)
The 2014 beverage wine production estimate is 1,202 million litres, a decrease of around 2% on last year. An analysis of sales and inventory levels suggests that if 2013-14 inventories remain the same as last year’s, the industry’s stock-to-sales ratio will further increase to 1.48 due to a decrease in the volume of export sales. See page 3 for discussion.
Vineyard area in Australia 2006-2013
2007
2013
2012
2011
Grape Crush
145,000
165,000
2007
Average Crush
2010
2009
2008
0
2006
500
2006
1,000
Vineyard area (ha)
‘000 tonnes
2,000
Complementing the WFA Vintage Survey, the Australian Grape and Wine Authority (AGWA) has completed its annual Winegrape Purchases Price Dispersion Report. It shows that, overall, the national average winegrape purchase price in 2014 was $441 per tonne, down 12% on the 2013 average. See discussion on page 5.
Sources: ABS Vineyard survey and ABS cat no 7121 Agricultural commodities for 2013 figures This is based on Winemakers’ Federation of Australia’s 2013 crush estimate at 1.83 million tonnes. See survey methodology for further details. 1
Total area (including non-bearing) 2013 figures should be interpreted with caution since data was sourced from ABS cat no 7121. 2006-2012 data was from ABS Vineyard estimates. Bearing area
2
www.wfa.org.au
*Some caution must be applied in interpreting 2013 figures due to change of data source
02 Vintage Report Crush by variety The crush of red and white varieties decreased in 2014 compared with 2013 - reds down by 5% and whites down by 9%. The red crush was around 884,000 tonnes or 52% of total crush, while whites accounted for 813,000 tonnes or 48% of total crush. The top three red varieties were Shiraz, Cabernet Sauvignon and Merlot, together accounting for 87% of the total red crush. Shiraz continues to dominate with 48% of the total red crush-a 3% increase from last year. Most varieties decreased in tonnage except for Ruby Cabernet (+1%), Lagrein (+10%), Malbec (+12%), Tempranillo (+22%) and Dolcetto (+43%).The largest decreases, in terms of tonnages, were Cabernet Sauvignon (-15,729 tonnes), Merlot (-13,752 tonnes) and Pinot Noir (-8,514 tonnes). In the whites, Chardonnay still dominates the white crush at 44% despite decreasing 46,521 tonnes from last year. Sauvignon Blanc remains in second place with 12% although tonnage has marginally decreased, followed by Semillon accounting for 9% of total white crush even though tonnage decreased by 4,514 from last year. Most of the white varieties decreased with Viognier (-83%), Sultana (-53%) and Moscato Giallo (-37%) recording the biggest reductions. The biggest relative increases were for Marsanne (+158%), Doradillo (+118%) and Palomino & Pedro Ximenes (50%). There was no change in the composition of the Top 10 varieties form last year, except for Pinot Gris/Pinot Grigio which is now ranked 8th while Colombard dropped to 9th place.
Barbera
Cabernet Franc Cabernet Sauvignon Dolcetto Durif Grenache
-28%
0.02%
1,322
1,142
(180)
-14%
0.07%
246,829
231,100
(15,729)
-6%
13.62%
912
1,300
388
43%
0.08%
5,146
4,630
(516)
-10%
0.27%
15,033
13,317
(1,716)
-11%
0.78%
265
23
10%
0.02%
2,730
284
12%
0.16%
Mataro
6,390
5,110
(1,280)
-20%
0.30%
130,548
116,795
(13,752)
-11%
6.88%
Muscat a Petit Grains Rouge
880
785
(95)
-11%
0.05%
Nero D'Avola
633
421
(212)
-33%
0.02%
Petit Verdot
22,430
19,941
(2,489)
-11%
1.17%
Pinot Noir
39,404
30,890
(8,514)
-22%
1.82%
Ruby Cabernet
16,295
16,461
167
1%
0.97%
4,560
3,054
(1,506)
-33%
0.18%
424,999
423,783
(1,217)
0%
24.97%
Merlot
Sangiovese Shiraz Tarrango Tempranillo Other red
714
491
(223)
-31%
0.03%
4,472
5,476
1,004
22%
0.32%
11,836
6,351
(5,485)
-46%
0.37%
935,464
884,312
(51,152)
-5%
52.10%
192
217
25
13%
0.01%
401,372
354,851
(46,521)
-12%
20.91%
6,177
5,571
(606)
-10%
0.33%
67,240
55,638
(11,602)
-17%
3.28%
535
1,166
630
118%
0.07%
Marsanne
1,580
4,082
2,502
158%
0.24%
Moscato Giallo
6,031
3,785
(2,245)
-37%
0.22%
Total Red Varieties
White Varieties Chardonnay Chenin Blanc
Pinot Noir
Colombard
Pinot Gris & Pinot Grigo
Muscat Gordo Blanco
Semillon
Sauvignon Blanc
Merlot
(105)
% of grape crush
242
446
383
(62)
-14%
0.02%
Muscat a Petit Grains Blanc
13,690
14,979
1,289
9%
0.88%
Muscat Gordo Blanco
68,385
65,385
(3,000)
-4%
3.85%
121
181
60
50%
0.01%
Pinot Gris & Pinot Grigio
63,881
61,559
(2,322)
-4%
3.63%
Riesling
29,388
22,662
(6,727)
-23%
1.34%
Sauvignon Blanc
96,561
95,308
(1,253)
-1%
5.62%
Semillon
75,733
71,219
(4,514)
-6%
4.20%
Sultana
1,516
718
(798)
-53%
0.04%
Traminer
9,994
11,096
1,102
11%
0.65%
408
326
(82)
-20%
0.02%
Verdelho
11,425
8,163
(3,262)
-29%
0.48%
Viognier
13,697
2,356
(11,341)
-83%
0.14%
Palomino & Pedro Ximenes Cabernet Sauvignon
272
% 20132014
2,446
Muscadelle
Chardonnay
377
2014
Malbec
Doradillo
2014
2013
Lagrein
Colombard
500 450 400 350 300 250 200 150 100 50 0 Shiraz
‘000 tonnes
Red Varieties
Arneis
Top 10 Varieties Comparison of 2013 and 2014 Vintages
2013
Variety
Change 20132014 (tonnes)
Trebbiano
Other white Total White grapes Total All Varieties
29,363
33,396
4,032
14%
1.97%
897,735
813,040
(84,694)
-9%
47.90%
1,833,199 1,697,352 (135,846)
-7%
100%
03 Crush by industry structure The Australian wine industry is made up of a small number of very large processors and a large number of small processors. The respondents to the 2014 WFA Vintage Survey resemble this: Size of reported crush
# of respondents
10,000 tonnes +
25
5,000 - 10,000 tonnes
8
1,000 - 5,000 tonnes
37
500 - 1,000 tonnes
18
50 - 500 tonnes
50
Under 50 tonnes
33
Total
171
The estimated 2014 beverage wine production decreased at a lower rate than the crush estimate (-2% vs -7%) suggesting an increase in extraction rates (litres per tonne). The implied 2014 extraction rate of 708 litres per tonne is marginally higher than the 8-year average of 700 litres per tonne. In interpreting production levels, inventory and sales levels need to be considered. Beverage wine inventory for 2012-13 (1,776 million litres) was up 5% from the previous year while sales (domestic sales plus export sales) decreased 2% to 1,151 million litres. Consequently, the stock-to-sales ratio for 2012-13 increased 4% bringing it to 1.44 from 1.38 the previous year. If we (conservatively) assume that inventories remain the same as last year and given this year’s sales decreased 1% (1,142 million litres), then stock-to-sales ratio will increase to an estimate of 1.48.
Production, Inventory and Sales
1.48
1.6
1400
1.4
1200
1.2
1000
1
400
0.4
200
0.2
0
Production
Sales
Inventory
2012-2013
0.6
2011-2012
600
2010-2011
0.8
2009-2010
800
2008-2009
8-year average: 1,167million
1.8
2007-2008
2014 WFA Estimate: 1,202 million litres
1300 1250 1200 1150 1100 1050 1000 950 900 850 800
0
Stock to sales ratio (RHS)
Average
2013-2014
2012-2013
2011-2012
2010-2011
2009-2010
2008-2009
2007-2008
Source: ABS cat no 1329 and 8504, AGWA Wine Export Approval Database and WFA Vintage Survey
2006-2007
‘000,000 litres
Beverage Wine Production (litres)
1800
2006-2007
The 2014 WFA Vintage Survey also collected for the first time beverage wine production data to address the gap in this year’s industry foundation data collection. This year’s beverage wine production estimate is 1,202 million litres, a decrease of around 2% from last year’s beverage wine production3. This is higher than the 8-year average of 1,167 million litres by around 35 million litres.
2
1600
Volume (’000,000 litres)
Beverage wine production
2000
2013-2014
The crush survey results also suggest the largest 10 crush respondents accounted for 70% of the total crush, largest 20 accounted for 85% and largest 30 accounted for 91%. Survey crush results relate to physical processing, not necessarily ownership. There is no differentiation in the survey between wineries and contract processing facilities.
Production
Source: ABS cat no 1329
3 2014 beverage wine production estimate is based on ABS cat no 1329 Australian Wine and Grape Industry’s figure of 1,231 million litres
04 Regional commentaries
Production profitability analysis8
Regional commentaries around the 2014 vintage are generally centered on great fruit quality, despite tough weather conditions during the growing season. For example:
Extending the 2012 Expert Review analysis on production profitability to 2014 data (assuming cost of production remains the same), the level of profitable production were unchanged, breakeven production decreased to 8% and unprofitable production increased to 80%.
Hunter Valley4 - 2014 presented perfect ripening conditions following the heavy November rains, and then lots of sunshine without any 40 degree plus days. Little rain throughout January and February allowed winemakers to harvest the fruits at optimum ripeness, rather than being dictated by the possibility of inclement weather. All Hunter Valley varieties have been praised as some of the region’s best. Tyrrell’s Managing Director, Bruce Tyrrell said, “My father Murray was famous for regularly declaring a ‘vintage of the century,’ well this is possibly the best of both this, and last century.” Yarra Valley5 - After a warm January, the Yarra Valley experienced near perfect conditions for the latter part of ripening. Moderate days and cool nights resulted in fruit which achieved optimum ripeness and flavours at lower sugars. Early varieties such as Pinot Noir and Chardonnay experienced reduced yields but look balanced with great concentration and flavour. Shiraz and Cabernet Sauvignon have benefited from a warm, dry finish to the season. All exhibit the hallmark combination of finesse and elegance that is the Yarra Valley. Riverland6 - Despite tough weather conditions during the lead up to vintage, vines in the Riverland still delivered quality fruit. Riverland Wine executive officer Chris Byrne said if there had been an earthquake this vintage it wouldn’t have surprised Riverland grapegrowers who earlier battled through hailstorms, bushfires, frost, disease, pests and record rains. They overcame it all to produce what winemakers have described as an “above average quality harvest” and early signs are some very good wines are being made. Margaret River7 - Harvest for most producers commenced in late January, rather than the early February that is the norm. There was a run of daytime temperatures in the low 30s, with fresh, cool evenings. Unusually, some varietals ripened out of order, with Semillon beating Sauvignon Blanc to the finish in some cases. By the second week in March, temperatures were perfect for finishing off the reds. In summary, the 2014 vintage was warm and dry with cool evenings enabling the fruit to ripen consistently and retain excellent freshness. Baumés at harvest were generally lower than previous years and, the fruit has retained excellent natural acidity and displays vibrant flavours with great varietal expression.
However, when we account for a 3% increase in the cost of production, profitable production decreased to 7%, low profitability was unchanged, breakeven decreased to 5% and unprofitable production increased to 84%. It is WFA’s view these results are due to factors such as an approximate 11% decrease in the average winegrape purchase price from 2012 to 2014, decrease in average yields for the cooler temperate regions and increase in yields for the warm inland regions. Regions were affected by changes in purchase prices and yields differently—Barossa Valley and Hunter Valley increased profitable production; while Riverland and Margaret River increased unprofitable production. Following are some regional examples from the 2014 production profitability analysis: The production profitability analysis for the Barossa Valley illustrates that the proportion of profitable and breakeven production all increased and the proportion of unprofitable production decreased. This can be explained by several factors such a 33% increase on the average purchase price and a 9% decrease in average yield. The Hunter Valley marginally increased its profitable production, and decreased its unprofitable production. Of the 11,301 tonnes collected, 61 tonnes (purchases above $1,900 per tonne) were profitable, and 543 tonnes (purchases between $1,600-1,900) were low/breakeven. Comparing this to 2012, 345 tonnes (3%) of the sample was breaking even and the 10,090 (97%) was unprofitable. The Riverland’s profitable production increased to 1%, low profitability was unchanged, breakeven decreased to 3% and unprofitable production increased to 94%. This can be attributed to factors such as 11% decrease of average purchase price and 2% increase in average yields. The profitable 1% was purchased between $700-1,025 per tonne. Margaret River decreased its profitable, low and breakeven proportions, and increased its unprofitable production to 46%. Purchases from $600-1,500 per tonne exhibited most changes compared to 2012 – a decrease of 3,134 tonnes of profitable production, decrease of 1,639 tonnes of low profitability, increase of 4,134 tonnes of breakeven, and increase of 4,401 tonnes of unprofitable production. Production Profitability (assuming cost of production increased by 3%)
2012 4%
2014
8%
4%
7%
5%
11%
4
Extracted from Hunter Valley Wine and Tourism Association Media Release 12 March 2014.
5
Extracted from Richard Howden, 2014 Wine Victoria Regional Council Vintage Reports.
6
Extracted from Chris Byrne, “Vintage Promises Quality But Not Quantity”, Grapegrower & Winemaker May 2014 issue.
7
Commentary from Voyager Estate’s Steve James, Manager of Winemaking and Viticulture and Glen Ryan, Vineyard Manager.
77%
8
84%
See section on methodology for detailed discussion.
We have conducted the analysis for 13 regions but similar to the Expert Review, discussed only 4 in this report. Analysis for the remaining regions can be obtained from the WFA website. 9
05
2014 winegrape purchases price dispersion report summary The Australian Grape and Wine Authority (AGWA) recently released the 2014 Australian Winegrape Purchases Price Dispersion report. The report presents tonnages purchased in 2014, as they are distributed across the price spectrum. The data has been collected from a relatively small sample of major winegrape purchasers and others that are significant in key regions but covers an estimated 80% of winegrape purchases. Over 35,000 separate transactions were collected and form the basis of the report. The reporting provides price dispersion read-outs and average purchase prices for varieties-by-region. The winegrapes purchases collected in the 2014 survey totalled 1,067,733 tonnes valued at $471 million equating to an average purchase price of $441 per tonne, down 12% on the average of $499 per tonne recorded in the equivalent survey in 2013. However, the average purchase price was the higher than the low recorded in 2011 (see figure 1).
Overall, red wine grapes recorded a slightly stronger price decline compared to white wine grapes. The price paid for red wine grapes declined by 13% to $541 per tonne while for white wine grapes declined by 11% to $344 per tonne.
Figure 2: National Winegrape Average Purchase Prices by Variety ($ per tonne)
2014
2013
Change
Chardonnay
304
372
-18%
Shiraz
564
637
-11%
Cabernet Sauvignon
563
664
-15%
Merlot
417
473
-12%
Sauvignon Blanc
482
497
-3%
Riesling
611
594
3%
900
Colombard
192
226
-15%
800
Muscat Gordo Blanco
275
371
-26%
700
Grenache
577
583
-1%
600
Semillon
371
337
10%
500
Pinot Noir
696
870
-20%
400
Pinot Gris
518
553
-6%
Figure 1: Winegrape average purchase prices over time
2007
2008
2009
2010
636
817
527
464
2013
2006 604
2014
2005 710
441
2004 796
499
2003 861
2011
2002 846
2012
2001 933
458
2000
413
1999
800
National
881
1000 Average purchase price ($ per tonne)
A summary of the price outcomes for 2014 by key variety are illustrated in figure 2. Of the varieties shown in the table, price increases were recorded only by Riesling and Semillon.
Source: Australian Regional Winegrape Crush Survey, Australian Winegrape Purchases Price Dispersion Report.
The full report is available to download at http://www.agwa.net.au/winefacts
Source: Australian Winegrape Purchases Price Dispersion Report.
06 2015 vintage outlook
This year’s resilient winegrape crush, decrease in average winegrape prices, increase in stock-to-sales ratio, increase in unprofitable production and relatively flat demand projections suggest the 2015 vintage will not see a fundamental change in industry dynamics or profitability unless action is taken. Further, expected above average vintages in Spain, Italy and France will continue to put pressure on global commodity wine prices. Looking at AGWA’s export approvals data, Australian wine (in terms of volume and value) continues to fall short of pre-GFC levels. We are still not regaining volume share in the US market and have lost volume in China (as have most other competitors) due to austerity measures imposed by the Chinese government. Unless the industry takes proactive action to grow the demand opportunity and accelerate the correction in the supply base, the industry will continue to see seasonal pricing fluctuations around an already low base. This should be a further incentive for the industry to pursue the necessary initiatives outlined in WFA’s Actions for Industry Profitability. WFA, together with AGWA believe there are opportunities to build demand. Although we have not reached pre-GFC volumes in the US market, the above A$7.50 per litre fob categories continue to improve. Similarly, the UK and Canadian markets also present growth opportunities. Australia is still under-represented at the higher end of the UK market and in the independent retail sector, but there are some positive signs with growth in exports above A$7.50 per litre fob. Further, Canadian
agents (importers) report recent Australian premium sales success and sense that “things are starting to turn around” at higher price points. Australia is the themed country at the Vancouver International Wine Festival to be held in February 2015 and this event is an example of how category promotion can support the growth strategies of individual companies in specific markets. Austerity measures introduced by the Chinese Government to curb spending by Government officials on luxury goods such as wine have had a negative impact on the growth of imported wines to China. However, there are signs of recovery and Australia is well-placed to resume growth, particularly in the above A$7.50 per litre fob categories. In the Australian domestic market, Australian wine category holds an 85% share while imports continue to gain share particularly through New Zealand Sauvignon Blanc and Champagne. However, Australian wines are continuing to grow at all price points above A$12 per bottle, with the strongest growth coming at above A$25 per bottle, albeit off a relatively small base. The on-premise represents an opportunity as Australia is likely under-represented in this channel. The WFA is currently advocating for an additional $25 million over four years from government to help boost the international promotion and marketing of our wine in key markets. This initiative, along with a number of other recommended industry actions, can be found at www.wfa.org.au.
2014 vintage survey methodology There were two changes for this year’s Vintage Survey. We included questions on beverage wine production (litres) to temporarily address the gap in the industry’s data collection10. We also used an online survey form to improve efficiencies.
• Exclude grapes you owned that were processed by another processing facility
The survey was initially sent to 1,500 wineries in Australian (at least 95% of the total crush). 171 responses were received from wineries with processing facilities. 2014 crush respondents represented 91.4% of WFA’s 2013 crush estimate, while wine beverage production respondents represented 77.3% of ABS’s 2012-13 beverage wine production figure.
The analysis estimated 2014 growing costs by region and by grade, and compared with actual prices paid. Growing costs per tonne by grade were estimated using the following data sources:
The following definitions were used in the survey: Beverage wine production (litres) • Include table, sparkling and fortified wine produced for direct consumption and not for distillation • Include quantities produced by you on a contract or commission basis for another winery/group • Include production from unfermented or concentrated grape juice and must purchased, transferred in or produced by you • Include fortified wine made from wine of the current vintage • Exclude quantities produced for you on a contract or commission basis by another winery/group • Exclude wastage, spoilage and losses incurred after the wine making process is complete Crush - red and white varieties (tonnes) • Include all grapes processed by your winery or winery group • Include grapes contract processed by your winery on behalf of other wineries
Winemakers’ Federation of Australia Adelaide Office: 08 8133 4300 Canberra Office: 02 6239 8300
[email protected] www.wfa.org.au
Production profitability analysis: an update from the Expert Review
• 2014 prices dispersion data from Australian Wine and Grape Authority (note that price dispersion data including bonuses would only be available in Oct/ Nov11). Limitations of the price dispersion data include: 1) Price dispersion data is based on winegrape purchases only and therefore does not account for winery-owned fruit; 2) Tonnages purchased and reported at the aggregate level are estimated to represent an estimated 80% of the total purchases • Average yield by region was based on 2006/08/10/12/14. 2014 yield estimates were from SA Winegrape Crush Survey (PGIBSA) and consultations with WGGA • Estimated cost per hectare figures from consultations with WGGA and CPI movement • Definitions of profitability levels are as follows: o Loss- growing costs (per tonne) are greater than purchase price (per tonne) o Breakeven- profit per tonne is between $0-100 o Low- profit per tonne is between $100-300 o Profitable- profit per tonne is above $300 10 11
Beverage wine inventories and total area were also asked but received low response. An updated production profitability analysis accounting for bonuses will be made available in the WFA website.
WFA thanks all wineries that contributed to the survey without whom this publication would not be possible. For more information about the Vintage Report, please contact Katrina Edillor at WFA on (08) 8133 4308 or
[email protected].
2014 WFA Vintage Report Errata Correction has been made to the white varieties table on page 2 of the Vintage Report, specifically on Viognier and ‘Other white’ varieties. The white varieties table should be: White Varieties
Arneis Chardonnay Chenin Blanc Colombard Doradillo Marsanne Moscato Giallo Muscadelle Muscat a Petit Grains Blanc Muscat Gordo Blanco Palomino & Pedro Ximenes Pinot Gris & Pinot Grigio Riesling Sauvignon Blanc Semillon Sultana Traminer Trebbiano Verdelho Viognier Other white Total
2013
2014
Change 2013-14 (tonnes) 25 (46,521) (606) (11,602) 630 2,502 (2,245) (62) 1,289
% 201314 13% -12% -10% -17% 118% 158% -37% -14% 9%
% of grape crush 0.01% 20.91% 0.33% 3.28% 0.07% 0.24% 0.22% 0.02% 0.88%
192 401,372 6,177 67,240 535 1,580 6,031 446 13,690
217 354,851 5,571 55,638 1,166 4,082 3,785 383 14,979
68,385 121
65,385 181
(3,000) 60
-4% 50%
3.85% 0.01%
63,881 29,388 96,561 75,733 1,516 9,994 408 11,425 13,697 29,363 897,735
61,559 22,662 95,308 71,219 718 11,096 326 8,163 14,575 21,176 813,040
(2,322) (6,727) (1,253) (4,514) (798) 1,102 (82) (3,262) 878 (8,187) (84,694)
-4% -23% -1% -6% -53% 11% -20% -29% 6% -28% -9%
3.63% 1.34% 5.62% 4.20% 0.04% 0.65% 0.02% 0.48% 0.86% 1.25% 47.90%
Correspondingly, the discussion found in page 2, 3rd paragraph, 7th to 9th lines should read: “…most of the white varieties decreased with Sultana (-53%) and Moscato Giallo (-37%) recording the biggest reductions.”