1D
PROGNOSIS Adrienne Randolph, Heiner Bucher, W. Scott Richardson, George Wells, Peter Tugwell, and Gordon Guyatt The following EBM Working Group members also made substantive contributions to this section: Deborah Cook, Jonathan Craig, and Jeremy Wyatt
IN THIS SECTION Finding the Evidence Are the Results Valid? Was the Sample of Patients Representative? Were the Patients Sufficiently Homogeneous With Respect to Prognostic Risk? Was Follow-up Sufficiently Complete? Were Objective and Unbiased Outcome Criteria Used? What Are the Results? How Likely Are the Outcomes Over Time? How Precise Are the Estimates of Likelihood? How Can I Apply the Results to Patient Care? Were the Study Patients and Their Management Similar to Those in My Practice? Copyright © 2002 by the American Medical Association
Was Follow-up Sufficiently Long? Can I Use the Results in the Management of Patients in My Practice? Cinical Resolution
141
USERS ’ G UIDES TO THE M EDICAL L ITERATURE
CLINICAL SCENARIO Age 71, a Prior Stroke: What Is the Prognosis?
You are a Swiss internist seeing a 71-year-old man recovering from a right lower lobe pneumonia. The patient, who suffered a right hemispheric stroke 1 year ago, has little function of his left arm but is able to walk with a crutch. He is in sinus rhythm. For at least 15 years, he had hypertension that probably was poorly controlled. His echocardiogram has revealed left ventricular hypertrophy and mild left ventricular dysfunction. A Doppler examination of his carotid arteries shows nonsignificant stenosis of less than 50% bilaterally. He takes aspirin 300 mg per day, an angiotensin-converting enzyme (ACE) inhibitor, and a thiazide diuretic now control his hypertension. From a lively discussion with the patient, you learn that he is a connoisseur of French wines and that since his early retirement he spends several months each year in Southern France, where he owns a little cottage. The patient grumbles that since the stroke, “things are not going the way they should” and you try to console him. Later on, speaking to the patient’s wife, you find she is concerned about her husband’s difficulty accepting his disability. She feels that owning two residences, with all of the commuting between them, is too much for both of them. The back-and-forth driving and the care for the two houses has completely become her burden, and she states that the pneumonia was the “proof for her husband’s exhaustion.” She feels that information about his risks of a recurrent stroke and death could help him and his family to “settle things.” Because your knowledge about the prognosis of survivors of stroke is vague, you tell the patient’s wife that you will obtain specific information to address her concerns, and you promise to report back to her and to the patient.
Copyright © 2002 by the American Medical Association
142
PART 1: T HE B ASICS
Copyright © 2002 by the American Medical Association
FINDING THE EVIDENCE Your hospital does not offer access to Best Evidence or the Cochrane Library, but at least you have an Internet connection. During a break, you connect to the Internet and to MEDLINE at the US National Library of Medicine Web site via PubMed. You enter the term “stroke” and, using the thesaurus, you find the correct Medical Subject Heading (MeSH) term, “cerebral infarction.” Combining the search with the terms “epidemiology,” “recurrence,” and “prognosis” yields a number of relevant results. You identify one interesting article, “Long-Term Risk of Recurrent Stroke After a First-ever Stroke,” from the Oxfordshire Community Project and obtain a copy from the library.1 Clinicians help patients in three broad ways: by diagnosing what is wrong with them, by administering treatment that does more good than harm, and by giving them an indication of what the future is likely to hold. Clinicians require studies of patient prognosis—those examining the possible outcomes of a disease and the probability with which they can be expected to occur—to achieve the second and third goals. Although they strive to restore health, sometimes clinicians can only offer relief of discomfort and preparation for death or long-term disability by means of presenting the expected future course of the patient’s illness. To estimate a patient’s prognosis, we examine outcomes in groups of patients with a similar clinical presentation—patients in the first year after stroke, for example. We may then refine our prognosis by looking at subgroups and deciding into which subgroup the patient falls. We may define these subgroups by such demographic variables as age (younger patients may fare better than older ones), by disease-specific variables (patients’ outcome may differ depending on whether the stroke was hemorrhagic or thrombotic), or by comorbid factors (those with underlying hypertension, even if treated, may have worse outcomes). When these variables or factors really do predict which patients do better or worse, we call them prognostic factors. Authors often distinguish between prognostic factors and risk factors, which are those patient characteristics associated with the development of the disease in the first place. For example, smoking is an important risk factor for the development of lung cancer, but it is not as important a prognostic factor as tumor stage in someone who has lung cancer. The issues in studies of prognostic factors and risk factors are identical, both for assessing validity and for using the results in patient care. Knowledge of a patient’s prognosis can help clinicians make the right diagnostic and treatment decisions. If a patient will get well anyway, clinicians should not recommend high-risk invasive procedures or waste money on expensive or potentially toxic treatments. If a patient is at low risk of adverse outcomes, even beneficial treatments may not be worthwhile. For example, stress ulcer prophylaxis to prevent gastrointestinal bleeding may not be worthwhile in nonintubated patients without a coagulopathy who are at extremely low risk of clinically important hemorrhage.2 In another example, young nonsmoking patients with mild hypercholesterolemia without hypertension or a family history of coronary disease
143
USERS ’ G UIDES TO THE M EDICAL L ITERATURE
may conclude that their risk of adverse cardiovascular outcomes during the coming decade or two is so low that they will not take lipid-lowering medication. On the other hand, patients may be destined to have poor outcomes despite whatever treatment we offer. Aggressive therapy in such individuals may only prolong suffering and waste resources. Knowledge of prognosis is also useful for resolution of issues broader than the care of the individual patient. Organizations may attempt to compare the quality of care across clinicians, or institutions, by measuring the outcomes of care. However, differences in outcome may be caused by the variability in the underlying severity of illness rather than by the treatments, clinicians, or health care institutions under study. If we know patients’ prognoses, we may be able to compare populations and adjust for differences in prognosis to obtain a more accurate indication of how management is affecting outcome (see Part 2B, “Therapy and Harm, Outcomes of Health Services”). Certain issues are common to all these reasons for determining prognosis— communicating to patients their likely fate, guiding our treatment decisions, and comparing outcomes in populations to make inferences about quality of care— and some differ. In this section of the book, we focus on how to use articles that may contain valid prognostic information that will be useful in counseling patients (Table 1D-1). TABLE 1D-1
Users’ Guides to an Article About Prognosis Are the results valid?
• Was the sample of patients representative? • Were the patients sufficiently homogeneous with respect to prognostic risk? • Was follow-up sufficiently complete? • Were objective and unbiased outcome criteria used? What are the results?
• How likely are the outcomes over time? • How precise are the estimates of likelihood? How can I apply the results to patient care?
• Were the study patients and their management similar to those in my practice? • Was the follow-up sufficiently long? • Can I use the results in the management of patients in my practice?
Using the same methodology as investigators addressing issues of harm (see Part 1B2, “Harm”), investigators addressing issues of prognosis use cohort and case-control designs in their studies to explore the determinants of outcome. Implicitly, randomized controlled trials also address issues of prognosis. The results reported for both the treatment group and the control group provide prognostic information: the control group results tell us about the prognosis in
Copyright © 2002 by the American Medical Association
144
PART 1: T HE B ASICS
patients who did not receive treatment, and the treatment group results tell us about the prognosis in patients receiving the intervention. In this sense, each arm of a randomized trial represents a cohort study. If the randomized trial meets criteria we will describe later in this section, it can provide extremely useful information about patients’ likely fate. For issues of harm, the choice of appropriate treatment and control groups is crucial. For issues of prognosis, if there is a control group at all (and for populations in which patients all have more or less the same prognosis, this need not be the case), the controls are patients with different prognostic factors. In the same way that articles addressing issues of diagnosis evaluate tests that distinguish between those with and without a target condition or disease, prognostic studies may suggest factors that differentiate between those at low and high risk for a target outcome or adverse event. Issues in evaluating prognostic studies, however, are sufficiently different from those related to harm or diagnosis that clinicians may find the following guides helpful.
ARE THE RESULTS VALID?
Copyright © 2002 by the American Medical Association
Was the Sample of Patients Representative? Bias has to do with systematic differences from the truth. A prognostic study is biased if it yields a systematic overestimate or underestimate of the likelihood of adverse outcomes in the patients under study. When a sample is systematically different from the underlying population—and is therefore likely to be biased because patients will have a better or worse prognosis than those in that population—that sample as “unrepresentative.” How can you recognize an unrepresentative sample? First, look to see if patients pass through some sort of filter before entering the study. If they do, the result is likely to be from a sample that is systematically different from the underlying population of interest (such as patients who have suffered a myocardial infarction or stroke, or with new-onset diabetes). One such filter is the sequence of referrals that leads patients from primary to tertiary centers. Tertiary centers often care for patients with rare and unusual disorders or increased illness severity. Research describing the outcomes of patients in tertiary centers may not be applicable to the general patient suffering from the disorder in the community. For example, when children are admitted to the hospital with febrile seizures, parents want to know the risk that their child will have more seizures in the future. This risk is much lower in population-based studies (reported risks range from 1.5% to 4.6%) than in clinic-based studies (reported risks are 2.6% to 76.9%).3 Those in clinic-based studies may have other neurologic problems predisposing them to have higher rates of recurrence. For you to adequately counsel parents, you need to know how similar your patient is to the patients in the various samples. Failure to clearly define the patients who entered the study increases the risk that the sample is unrepresentative. To help you decide about the representativeness of
145
USERS ’ G UIDES TO THE M EDICAL L ITERATURE
the sample, look for a clear description of which patients were included and excluded from a study. The way the sample was selected should be clearly specified, along with the objective criteria used to diagnose the patients with the disorder.
Were the Patients Sufficiently Homogeneous With Respect to Prognostic Risk? Prognostic studies are most useful if individual members of the entire group of patients being considered are similar enough that the outcome of the group is applicable to each group member. This will be true only if patients are at a similar well-described point in their disease process. The point in the clinical course need not be early, but it does need to be consistent. For instance, in a study of the prognosis of children with acquired brain injury, researchers looked not at the entire population, but at a subpopulation who remained unconscious after 90 days.4 After ensuring that the stage of the disease process is not a variable influencing outcome (because investigators held it constant), it is important to consider other factors that might influence patient outcome. For instance, consider the example of acquired brain injury. A study examining neurologic outcome that pooled patients with and without head trauma without distinguishing between them may not be very useful if these two groups have different prognoses. If the overall mortality rate reported in a study is 50% but the patient population is made up of identifiable subgroups, one of which has a mortality rate near zero and the other of which has a mortality rate near 100%, the 50% estimate will be valid for the whole group but not valid for any individual in that group. If the patients are heterogeneous with respect to risk of adverse outcome, the study will be much more useful if the investigators define subgroups that are at lower and higher risk than the overall group. For example, Pincus and colleagues followed a cohort of patients with rheumatoid arthritis for 15 years.5 They separated the patients into a number of cohorts depending on their demographic characteristics, disease variables, and functional status. They found that older patients and those with greater impairment of functional status (eg, modified walking time and activities of daily living) died earlier than others. In another example, the authors of the study of children with acquired brain injury found that patients with posttraumatic injuries did much better than those with anoxic injuries. Of 36 patients with closed head trauma, 23 (64%) regained enough social function to be able to express their wants and needs and nine (25%) eventually regained the capacity to walk independently. Of 13 children with anoxic injuries, none regained important social or cognitive function.4 Not only must investigators consider all important prognostic factors, but they must also consider them in relation to one another. Consider the Framingham study, in which investigators examined (among many other things) risk factors for stroke.6 They reported that the rate of stroke in patients with atrial fibrillation and rheumatic heart disease was 41 per 1000 person-years, which was very similar to the rate for patients with atrial fibrillation but without rheumatic heart disease. However, patients with rheumatic heart disease were, on average, much younger
Copyright © 2002 by the American Medical Association
146
PART 1: T HE B ASICS
than those who did not have rheumatic heart disease. To properly understand the impact of rheumatic heart disease, investigators in these circumstances must consider separately (1) the relative risk of stroke in young people with and without rheumatic disease, and (2) the risk of stroke in elderly people with and without rheumatic disease. We call this separate consideration an adjusted analysis. Once adjustments were made for age (and also for gender and hypertensive status of the patients), the investigators found that the rate of stroke was sixfold greater in patients with rheumatic heart disease and atrial fibrillation than in patients with atrial fibrillation who did not have rheumatic heart disease. If a large number of variables have a major impact on prognosis, investigators should use sophisticated statistical techniques to determine the most powerful predictors (see Part 2D, “Prognosis, Regression and Correlation”). Such an analysis may lead to a clinical decision rule that guides clinicians in simultaneously considering all the important prognostic factors (see Part 2C, “Diagnosis, Clinical Prediction Rules”). How can you decide if the groups are sufficiently homogeneous with respect to their risk? On the basis of your clinical experience—and your understanding of the biology of the condition being studied—can you think of factors that the investigators have neglected that are likely to define subgroups with very different prognoses? To the extent that the answer is “yes,” the validity of the study is compromised.
Copyright © 2002 by the American Medical Association
Was Follow-up Sufficiently Complete? A high patient dropout rate threatens the validity of a study of prognosis. As the number of patients who do not return for follow-up increases, the likelihood of bias also increases (eg, those who are followed may be at systematically higher or lower risk than those not being followed). How many patients lost to follow-up is too many? The answer depends on the relationship between the proportion of patients who are lost and the proportion of patients who have suffered the adverse outcome of interest. The larger the number of patients whose fate is unknown relative to the number who have suffered an event, the greater is the threat to the study’s validity. For instance, let us assume that 30% of a particularly high-risk group (such as elderly patients with diabetes) have suffered an adverse outcome (such as cardiovascular death) during long-term follow-up. If 10% of the patients have been lost to follow up, the true rate of patients who had died may be as low as approximately 27% or as high as 40%. Across this range, the clinical implications would not change appreciably, and the loss to follow-up does not threaten the validity of the study. However, in a much lower-risk patient sample (otherwise healthy middle-aged men, for instance) the observed event rate may be 1%. In this case, if we assumed that all 10% of the patients lost to follow up had died, the event rate of 11% might have very different implications. A large loss to follow-up constitutes a more serious threat to validity when the patients who are lost may be different from those who are easier to find. In one study, for example, after much effort, 180 of 186 patients treated for neurosis were
147
USERS ’ G UIDES TO THE M EDICAL L ITERATURE
followed.7 The death rate was 3% among the 60% who were easily traced. Among those who were more difficult to find, however, the death rate was 27%. If a differential fate for those followed and those lost is plausible (and in most prognostic studies, it will be), loss to follow-up that is large in relation to the proportion of patients suffering the adverse outcome of interest constitutes an important threat to validity.
Were Objective and Unbiased Outcome Criteria Used? Outcome events can vary from those that are objective and easily measured (eg, death), to those requiring some judgment (eg, myocardial infarction), to those that may require considerable judgment and are challenging to measure (eg, disability or quality of life). Investigators should clearly specify and define their target outcomes before the study and, whenever possible, they should base their criteria on objective measures. In addition, they should specify the intensity and frequency of monitoring. As the subjectivity of the outcome definition increases, it becomes more important that individuals determining the outcomes are blinded to the presence of prognostic factors. The study of children with acquired brain injury mentioned earlier in this section provides a good example of the issues involved in measuring outcome.4 The examiners found that patients’ families frequently optimistically interpreted interactions with the patients. The investigators therefore required that development of a social response in the affected children needed verification by study personnel, and they made the date that consciousness returned dependent on the date of the next outpatient visit. For instance, for a child who remained unconscious 1 year after injury and who was conscious on the next clinic visit 16 months after the original injury, the duration of unconsciousness would be recorded as being 1 year. Returning to the patient scenerio, and the article describing the prognosis of stroke patients, the Oxfordshire Community Stroke Project prospectively registered all 675 patients with a first-ever stroke at the time they entered one of the participating hospitals.1 Thus, patients were recruited at a common, early starting point. Since the study was community based, the population may be representative for a unselected cohort of British first-ever stroke patients. Their mean age was 72 years and 47% were male. In 81% of the patients, cerebral infarction was the cause of stroke; 10% had primary intracerebral hemorrhage; and 5% had subarachnoid hemorrhage—a pattern common to other stroke natural history studies. One might speculate that a number of risk factors could influence the risk of subsequent stroke, including initial stroke severity, the patient’s age, type of stroke, and presence of diabetes, heart failure, or blood pressure. The investigators analyzed all but the first of these factors and found no difference in prognosis across subgroups. The investigators succeeded in achieving 100% follow-up by a study nurse who evaluated patients at 1 month, 6 months, 1 year after their event, and annually thereafter. The authors provided a detailed definition of what they meant by a
Copyright © 2002 by the American Medical Association
148
PART 1: T HE B ASICS
stroke (for instance, they excluded asymptomatic new lesions on CT scans). However, they made no attempt to blind the nurse to possible prognostic factors.
WHAT ARE THE RESULTS?
Copyright © 2002 by the American Medical Association
How Likely Are the Outcomes Over Time? The quantitative results from studies of prognosis or risk are the number of events that occur over time. We will use the example of a man asking a physician about the prognosis of his elderly mother who has dementia to illustrate common expressions of this relationship that provide complementary information about prognosis. The patient’s son asks, “What are the chances that my mother will still be alive in 5 years?” A high-validity study of the prognosis of patients with dementia provides a simple and direct answer in absolute terms.8 Five years after presentation to the clinic, about one half of the patients (50%) had died. Thus, there is about a 50:50 chance that his mother will be alive in 5 years. The patient’s son might then indicate that the only person he knows with Alzheimer disease is a 65-year-old uncle who was diagnosed 10 years ago and is still living. He is surprised that his mother’s chance of dying in the next 5 years is so high. This gives the clinician the opportunity to discuss some of the prognostic factors for death in patients with Alzheimer disease. The high-validity study examining the prognosis of demented patients suggested that older patients, those with more severe dementia, those with behavioral problems, and those with hearing loss died earlier. The son might then ask whether his mother’s chance of survival is expected to change over time. That is, although she may be at low risk for the next 2 years, will the risk jump sharply after that? Neither the absolute nor relative expressions of results address this question. For this answer we should turn to a survival curve, a graph of the number of events over time (or conversely, the chance of being free of these events over time) (see Part 2B2, “Therapy and Understanding the Results, Measures of Association”). The events must be discrete (eg, death, stroke, or recurrence of cancer) and the time at which they occur must be precisely known. Figure 1D-1 shows two survival curves—one of survival after a myocardial infarction9 and the other depicting the results of hip replacement surgery in terms of when patients needed a revision because something had gone wrong after the initial surgery.10 Note that the chance of dying after a myocardial infarction is highest shortly after the event (reflected by an initially steep downward slope of the curve, which then becomes flat), whereas very few hip replacements require revision until much later (this curve, by contrast, starts out flat and then steepens). The study of patients with dementia provided a survival curve that suggests that the chance of dying is more or less constant during the first 7 years after referral to the clinic for dementia (Figure ID-2)8.
149
150
USERS ’ G UIDES TO THE M EDICAL L ITERATURE
FIGURE 1D–1
Survival Curves
95 % Not Revised
Estimated Survival
100
Streptokinase and Asprin
90 85 80
Placebo Infusion and Tablets
0
12
24
100 90 80 70 60 50 40 30 20 10
0
1
Time From Randomization (mo)
2
3
4
5
6
7
8
9
Years
Left, survival after myocardial infarction. Right, results of hip replacement surgery, proportion of patients who survived without needing a new procedure (revision) after their initial hip replacement. Reproduced with permission from The Lancet Publishing Group (left) and The Journal of Bone and Joint Surgery (right).
The more precise the estimate of prognosis a study provides, the less we need be uncertain around the estimated prognosis and the more useful it is to us. Usually, risks of adverse outcomes are reported with their associated 95% confidence intervals (CIs). If the study is valid, the 95% CI defines the range of risks within which it is highly likely that the true risk lies (see Part 2B2, “Therapy and Understanding the Results, Confidence Intervals”). For example, the study of the prognosis of patients with dementia provides the 95% CI around the 49% estimate of survival at 5 years after presentation, ie, 39% to 58%. Note that in most survival curves, the earlier follow-up periods usually include results from more patients than do the later periods (owing to losses to follow-up and because patients are not enrolled in the study at the same time). This means that the survival curves are more precise in the earlier periods, which should be indicated by narrower confidence bands around the left-hand parts of the curve.
Copyright © 2002 by the American Medical Association
How Precise Are the Estimates of Likelihood?
PART 1: T HE B ASICS
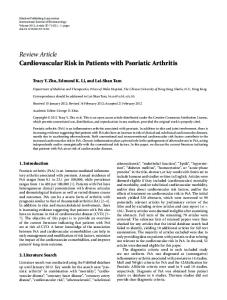
FIGURE 1D–2
Kaplan-Meier Graph of Overall Survival 120
Percent Surviving
100 80 60 40 20
0 At risk: 0 (157)
1
2
3
1 (149)
2 (130)
3 (91)
4 Years 4 (72)
5
6
7
8
5 (55)
6 (39)
7 (19)
8 (7)
Note standard errors of the entire cohort and the number of patients at risk each year. Reproduced with permission from Wiley-Liss, Inc, a subsidiary of John Wiley & Sons, Inc.
Copyright © 2002 by the American Medical Association
USING THE GUIDE The Oxfordshire study found that the absolute risk of death during the first year after a stroke was 31% (95% CI, 27%-34%) and the absolute risk of dying over the next 4 years averaged approximately 4% per year. For patients who survived, the risk of a recurrent stroke was 8.6% (95% CI, 6.5%-10.7%) in the first 6 months, 4.6% (95% CI, 2.6%-6.6%) in the next 6 months, and 6.7% (95% CI, 2.7%-7.3%), 5.0% (95% CI, 1.0%-5.6%), 3.3%, and 1.3%, respectively, in the second, third, fourth, and fifth years (the authors do not accurately report the confidence intervals for the fourth and fifth years). In patients with recurrent strokes, 61% were sufficiently severe that they led to disability in activities of daily living that continued for more than 7 days while 24% led to symptoms that resolved within a week. The investigators examined whether certain factors—sex, age, smoking, or the presence of diabetes, atrial fibrillation, cardiac failure, a transient ischemic attack, angina or myocardial infarction, intermittent claudication, or hypertension—influenced the risk of recurrent stroke. Of these factors, only smoking influenced the risk—smokers had an increased risk (OR, 1.66; 95% CI, 1.10 -2.51).
151
USERS ’ G UIDES TO THE M EDICAL L ITERATURE
HOW CAN I APPLY THE RESULTS TO PATIENT CARE? Were the Study Patients and Their Management Similar to Those in My Practice? The authors should describe the study patients in enough detail that you can make a comparison with patients in your practice. The patients’ characteristics and the way they are defined should be described explicitly. One factor rarely reported in prognostic studies that could strongly influence outcome is therapy. Therapeutic strategies often vary markedly among institutions and change over time as new treatments become available or old treatments regain popularity. To the extent that our interventions are therapeutic or detrimental, overall patient outcome could improve or become worse.
Was Follow-up Sufficiently Long? Since the presence of illness often precedes the development of an outcome event by a long period, investigators must follow patients for long enough to detect the outcomes of interest. For example, recurrence in some women with early breast cancer can occur many years after initial diagnosis and treatment.11 A prognostic study may provide an unbiased assessment of outcome over a short period of time if it meets the validity criteria in Table 1D-1, but it may be of little use if a patient is interested in prognosis over a long period of time.
Can I Use the Results in the Management of Patients in My Practice? Prognostic data often provide the basis for sensible decisions about therapy (see Part 2B3, “Therapy and Applying the Results, Applying Results to Individual Patients”). Knowing the expected clinical course of a patient’s condition can help you judge whether treatment should be offered at all. For example, warfarin markedly decreases the risk of stroke, in patients with nonrheumatic atrial fibrillation and is indicated for many patients with this disorder.12 However, in one study, the frequency of stroke in patients with “lone” atrial fibrillation (patients 60 years of age or younger with no associated cardiopulmonary disorders) was 1.3% over a 15-year period.13 Most patients with a prognosis this good are likely to feel that, for them, the risks of anticoagulant therapy outweight the benefits. Even if the prognostic result does not help with selection of appropriate therapy, it can help you in counseling a concerned patient or relative. Some conditions, such as asymptomatic hiatal hernia or asymptomatic colonic diverticulae, have such a good overall prognosis that they have been termed “nondisease.”14 On the other hand, a prognostic result of uniformly bad prognosis provides the clinician with a starting place for a discussion with the patient and family, leading to counseling about end-of-life concerns.
Copyright © 2002 by the American Medical Association
152
PART 1: T HE B ASICS
CLINICAL RESOLUTION Returning to the opening scenario, our review of the validity criteria suggests that the investigators obtained an unbiased assessment of recurrent stroke risk in their cohort study.1 The 71-year-old patient introduced at the beginning of this section resembles the majority of those in the cohort study in terms of age and type of stroke, and we can readily generalize the results to his care. The minimum follow-up in the study was 2 years and certain patients were followed up to 6.5 years, allowing investigators to provide estimates for patients up to 5 years. Given that he has survived the first year after his stoke, the patient’s risk of dying within the next 4 years is approximately 16%, and there is another 16% risk of recurrent stroke. Given their relatively narrow confidence intervals, we can be reasonably secure using these estimates. Since aspirin administration likely reduces the risk of recurrent stroke by approximately 25%, we would need to treat 25 patients like the man under consideration for 4 years to prevent a single stroke; the number needed to treat (NNT) = 100 / (16% – 12%). Given the low toxicity of low-dose daily aspirin, we can confidently recommend that therapy to our patient. Despite his complaints about his state of health, the patient tends to take an optimistic view of life. He is pleased to know that in 4 years his chance of being alive and no more disabled than he is at present is almost 70%. He uses this fact to help persuade his wife to maintain the dual residences, at least for the time being.
References 1. Burn J, Dennis M, Bamford J, Sandercock P, Wade D, Warlow C. Long-term risk of recurrent stroke after a first-ever stroke: the Oxfordshire Community Project. Stroke. 1994;25:333-337. 2. Cook DJ, Fuller HD, Guyatt GH, et al. Risk factors for gastrointestinal bleeding in critically ill patients. N Engl J Med. 1994;330:377-381.
Copyright © 2002 by the American Medical Association
3. Ellenberg JH, Nelson KB. Sample selection and the natural history of disease: studies of febrile seizures. JAMA. 1980;243:1337-1340. 4. Kriel RL, Krach LE, Jones-Saete C. Outcome of children with prolonged unconsciousness and vegetative states. Pediatr Neurol. 1993;9:362-368. 5. Pincus T, Brooks RH, Callahan LF. Prediction of long-term mortality in patients with rheumatoid arthritis according to simple questionnaire and joint count measures. Ann Intern Med. 1994;120:26-34. 6. Dawber TR, Kannel WB, Lyell LP. An approach to longitudinal studies in a community: The Framingham study. Ann NY Acad Sci. 1963;107:539. 7. Sims AC. Importance of high tracing-rate in long-term medical follow up studies. Lancet. 1973;2:433.
153
USERS ’ G UIDES TO THE M EDICAL L ITERATURE
8. Walsh JS, Welch G, Larson EB. Survival of outpatients with Alzheimer-type dementia. Ann Intern Med. 1990;113:429-434. 9. ISIS-2 (Second International Study of Infarct Survival) Collaborative Group. Randomised trial of intravenous streptokinase, oral aspirin, both, or neither among 17,187 cases of suspected acute myocardial infarction: ISIS-2. Lancet. 1988;2:349-360. 10. Dorey F, Amstutz H. The validity of survivorship analysis in total joint arthroplasty. J Bone J Surg AM. 1989;71A(4):544-548. 11. Early Breast Cancer Trialists’ Collaborative Group. Systemic treatment of early breast cancer by hormonal, cytotoxic, or immune therapy: 133 randomised trials involving 31000 recurrences and 24000 deaths among 75000 women. Lancet. 1992;339:1-15. 12. Segal JB, McNamara RL, Miller MR, et al. Prevention of thromboembolism in atrial fibrillation: a meta-analysis of trials of anticoagulants and antiplatelet drugs. J Gen Intern Med. 2000;15:56-67. 13. Kopecky SL. The natural history of lone atrial fibrillation: a population-based study over three decades. N Engl J Med. 1987;317:669-674. 14. Meador CK. The art and science of nondisease. N Engl J Med. 1965;272:92.
Copyright © 2002 by the American Medical Association
154