Environmental Engineering and Management Journal
December 2014, Vol.13, No. 12, 3105-3114
http://omicron.ch.tuiasi.ro/EEMJ/
“Gheorghe Asachi” Technical University of Iasi, Romania
SCREENING THE WEEKDAYS/WEEKEND PATTERNS OF AIR POLLUTANT CONCENTRATIONS RECORDED IN SOUTHEASTERN ROMANIA Daniel Dunea1, Ştefania Iordache1, Daniela-Cristiana Alexandrescu1, Niculae Dincă2 1
Valahia University of Târgovişte, Faculty of Environmental Engineering and Food Science, 18-24 Unirii Blvd. Târgovişte, 130082, Romania 2 University of Agronomic Sciences and Veterinary Medicine Bucharest, Faculty of Agriculture, 59 Mărăşti Blvd., Sector 1, Bucharest, 011464, Romania
Abstract Some of the major stressors of air quality in the urban areas are nitrogen oxides, ozone and suspended particles. The effect of air pollution on respiratory diseases can increase considerably at high levels of pollution and might trigger asthma symptoms. Longterm exposure can increase the rate of respiratory infections and symptoms at population level, but particularly in children. The goal was to analyze with statistical techniques the pollutant concentrations (NO, NO2, and SO2) recorded by 15 automated monitoring stations, to establish weekdays-weekend trends in various towns of the South Muntenia Region during cold months when residential heating contributes to the overall emissions. Raw data of the monitored parameters were acquired from 7 stations for NO and NO2, and 14 stations for SO2. Data acquisition and processing were performed between November 15, 2013 and February 28, 2014 and hourly-recorded time series were characterized for central tendency, dispersion and distribution. The statistical analysis determined the degree of differentiation between different sites and time intervals of the monitored pollutants using the screening of air quality trends based on hourly concentrations of each weekday using a specific grouping of data. The results support the characterization of weekday/weekend patterns in air pollutant concentrations in several urban areas of Southern Romania, where air pollution data were available: 4 cities (NO, NO2) i.e., Ploiesti, Slobozia, Turnu Magurele, and Giurgiu, respectively 6 cities (SO2), i.e., Ploiesti, Pitesti, Cimpulung, Giurgiu, Alexandria and Turnu Magurele. Key words: automated monitoring station, nitrogen oxides, sulfur dioxide, time series analysis Received: July, 2014; Revised final: October, 2014; Accepted: November, 2014
1. Introduction In the last decades, air pollution became one of the most important environmental issues, having negative effects on the human health and surrounding ecosystems (Budianu et al., 2010; Iordache and Dunea, 2013; Sandu et al., 2012). The latest predictions related to the air pollution trends (OECD, 2014) state that in the following decades, improper
air quality due to high concentrations of airborne contaminants and population increasing in urban areas would be the main environmentally-driven factors of morbidity and mortality. The air pollution issue is expected to have higher social and environmental impacts than other factors such as improper drinking water or natural hazards, e.g., floods, earthquakes, fires etc. Many epidemiological studies have demonstrated a clear association
Author to whom all correspondence should be addressed: e-mail:
[email protected]; Phone:+40 245 206108; Fax:+40 245 206108
Dunea et al./Environmental Engineering and Management Journal 13 (2014), 12, 3105-3114
between air pollution and adverse health effects (Briggs, 2003; Henschel et al., 2012; Schwartz, 1994). Long-term exposure can increase the rate of respiratory infections and symptoms at population level, but particularly in children (Neuberger et al., 2004). The effect of air pollution on respiratory disease can increase considerably at high levels of pollution and might trigger asthma symptoms (Landrigan and Etzel, 2013). Some of the major stressors of air quality in the urban areas are nitrogen oxides, ozone and suspended particles originating from industrial sources, heavy traffic and domestic heating being significantly influenced by the local weather conditions (Dunea, 2014). In the last years, the authorities’ interest in finding new approaches to diminish the impact of air pollution on the health of inner-city residents by limiting the exposure through early warnings during high concentrations episodes has increased considerably. Many research projects, e.g., MESSAGE, Citi-Sense-MOB, OpenSense (Castell et al., 2014; Liu et al., 2013) were developed or are currently underway in Europe by implying public participation and by using new emerged monitoring technologies and forecasting algorithms. The outcomes are supplementing already existing monitoring networks and official infrastructures of air pollution surveillance (e.g., Airbase EIONET EEA, 2014; national monitoring networks, and local urban infrastructures). In this context, the ROKIDAIR project has started recently in Romania funded by Economic European Area grants, aiming to improve the urban air quality monitoring and forecasting activities, focusing on the critical areas spatial delimitation based on the receptors’ vulnerability, and their detailed characterization in terms of PM2.5 effects on children’s health, in two towns of Romania, i.e., Targoviste and Ploiesti. These urban agglomerations will serve as pilot areas in order to develop and deploy a monitoring network system and adjacent information-decisional structure, which will provide synthesized data concerning PM2.5 levels obtained from reliable monitoring micro-stations and artificial intelligence forecasting algorithms developed within the project. The present paper shows a part of the preliminary analyses and tests required to establish trends and patterns of air pollutants in the urban areas of Southeastern Romania during cold months when residential heating has a major contribution to the total emissions. Previous studies (Blanchard et al., 2008; Motallebi et al., 2003) pointed out the importance of the weekdays – weekend patterns characterization in urban agglomerations, as well as the observation of seasonal influence on daily evolution of various airborne pollutant species. The goal of the experiments was to analyze the trend of pollutant concentrations (NO, NO2 and SO2) with statistical techniques, regarding the finding of potential differences between weekdays and weekend levels recorded at 15 automated monitoring stations in various urban areas of South Muntenia
3106
Region between November, 2013 and February, 2014. The results will support the selection and configuring of the data analysis algorithms to be used within the ROKIDAIR project, e.g., wavelet-neural network (Dunea et al., 2014), fuzzy logic (Dunea et al., 2011), predictive data mining (Oprea and Iliadis, 2011), statistical or mathematical models (Iordache and Dunea, 2013; Smaranda and Gavrilescu, 2008) etc. 2. Experimental In this experiment, the recorded raw values of pollutant concentrations were extracted from November 15, 2013 to February 28, 2014, at onehour sampling rate from 15 fixed stations of the National Air Quality Monitoring Network (RNMCA) using the collected historical database. The selection of hourly time series for analysis was performed based on the data availability that depended mainly on the pollutant analyzer functioning. The main criteria were the consistency and continuity of time series. Consequently, only 15 stations provided useful data for the analysis from 24 stations that are located in the South Muntenia Region (Fig.1). Seven automatic stations situated in four towns i.e., Giurgiu, Slobozia, Ploiesti, and Turnu Magurele, provided complete data records for NO and NO2 (GR-1, GR-2, GR-3, IL-1, PH-1, PH-6, and TR-2). There were also 14 stations, which have recorded sulfur dioxide concentrations (AG-2, AG-6, GR-1, GR-2, GR-3, GR-4, PH-1, PH-2, PH-3, PH-4, PH-5, PH-6, TR-1, and TR-2). These stations are located in six cities i.e., Pitesti, Cimpulung, Giurgiu, Ploiesti, Alexandria, and Turnu Magurele. Overall, there were 4 traffic, 4 industrial and 7 urban/ suburban stations having various areas of representativity (± 20 % of the recorded concentration at station location). The dataset for weekdays/weekend analysis contained 71,232 hourly values i.e., 7 2544 for NO, 7 2544 for NO2, and 14 2544 for SO2. The statistical indicators that explain central tendency and dispersion were computed for weekdays (Monday to Friday), as well as for weekends (Saturday and Sunday) for each month of the monitored interval i.e., November 2013 to February 2014. Median and quartiles values were preferred for presentation, being indicators that are more robust in evaluating pollution trends. Minimum and maximum showed the amplitude of the hourly time series, and maximum values pointed out the critical thresholds recorded in a specific area of the analyzed cities, which were useful for ranking the pollutant concentrations by site. In the first step, the daily median of each weekday (Sunday to Monday) was computed using continuous hourly values recorded during a day. Then, the median of subsequent weekday medians was calculated to describe the general pattern of each day of the week during a month. For example, in January 2014 there were 5 Mondays resulting 5 daily
Screening the weekdays/weekend patterns of air pollutant concentrations recorded in Southeastern Romania
medians for computing the median of Monday for January. Later on, the monthly median values of each weekday were grouped in two: Monday-Friday and Saturday-Sunday to compute the weekday, respectively weekend synthetic medians for each month (Table 1 to 4). 3. Results and discussion The quantitative knowledge about emission sources, emission levels, and the trends in emissions of primary particles and precursor compounds detains an important role in finding the most appropriate control strategy for reducing risks at population level in various urban areas (Dunea, 2014). It is helpful to know the pollutant loads during “working” days as well as for “free” days to assess exposure.
The current approach took into account all the days of the week as follows: Monday to Friday to characterize weekdays, and Saturday and Sunday to characterize weekends by using medians. Blanchard et al. (2008) considered a different approach using comparisons for the differences between Wednesday mean concentrations and Sunday mean concentrations, and for the differences between Wednesday and Saturday mean concentrations. They elected to use Wednesdays because they are equally separated in time from both Saturdays and Sundays, to diminish the carryover effect from other days of the week. In the present study, the focus was to separate the week into conventional working/free periods analyzing the time series in a continuous manner, without considering the interday carryover influence.
Air pollutant, instrumentation and analysis method Nitrogen oxides (NOX), ML9841B analyzer (SR EN 14211/2005chemiluminiscence)
Sulfur dioxide (SO2), ML9850B analyzer (SR EN 14212 / 2005- UV fluorescence) Type of station
Traffic
Monitoring Stations
GR-1, PH-1, PH-5, and TR-2
Area of representativity (± 20%)
10-100 m
Industrial AG-6, GR-3, PH-4, and PH6 100 m-1 km
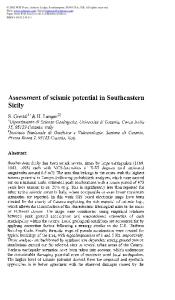
Monitoring stations GR-1 GR-2 GR-3 IL-1 PH-1 PH-6 TR-2 AG-2 AG-6 GR-1 GR-2 GR-3 GR-4 PH-1 PH-2 PH-3 PH-4 PH-5 PH-6 TR-1 TR-2 Urban/Suburban AG-2, GR-2, GR-4, IL-1, PH-2, PH3, and TR-1 1-5 km
Fig. 1. Location and particularities of the 15 automated stations for NO, NO2 and SO2 monitoring in Southeastern Romania considered in the present study
3107
Dunea et al./Environmental Engineering and Management Journal 13 (2014), 12, 3105-3114
The rationale for this separation was to obtain a preliminary outlook of the potential outdoor exposure of children that attend the schools and kindergartens located in the representativity area of the stations during weekdays, as well as for weekends when they play outdoors in playgrounds. Two groups of pollutants presented data available for this type of analysis i.e., nitrogen oxides (NO and NO2) and sulfur dioxides (SO2). Nitrogen oxides (NOx) form ground-level ozone in combination with volatile organic compounds and in the presence of sunlight. They are generated by various combustion processes but especially from vehicles engines and thermal power plants. Nitrogen oxides and sulfur dioxide may react with water vapors, oxygen, and other substances in the atmosphere to form acid rain. Both pollutants categories aggravate directly or as precursors of secondary pollutants, the respiratory illnesses, and can cause adverse effects depending on exposure, such as damage to lung tissue and reduction in lung function mostly in vulnerable category of populations (children, elders, and asthmatics). 3.1. Monthly patterns of nitrogen oxide during cold months The statistical indicators of nitrogen oxide (NO) time series recorded at each monitoring station from 4 cities in Southeastern Romania, showed that the calculated medians of the weekdays was lower than the medians of weekends in many sites and depended on the month of recordings (Table 1). In November, significant differences between weekdays-weekend medians were observed at GR-1, due to the heavy traffic – Giurgiu is a border town with Bulgaria being transited by many heavy trucks and vehicles, and GR-1 is located near the main street to Bucharest, and IL-1 due to residential heating – a station that is located in a residential area near Slobozia Emergency Hospital. The other stations showed almost constant values between weekdays and weekends medians. Maximum values were higher for weekdays at all stations. In December, the medians of weekdays were superior than weekend ones at all stations, but only GR-1, PH-1 and PH-6 showed significant values, the rest of stations showing almost similar values of weekdays-weekend medians. Several significant (p