Advances in Environment, Biotechnology and Biomedicine
Wall Thickness Measurement of Colon Based on Ultrasound Image Segmentation NORAYATI NORDIN, NUR SYAZWANI AB RAHMAN, YIN MON MYINT, MOHD AMINUDIN, HEAMN NOORI ABDULJABBAR, CHRISTINA PAHL, MOHSEN MARVI BAIGI, NUGRAHA PRIYA UTAMA, EKO SUPRIYANTO Advanced Diagnostics and E-Health Research Group Biotechnology Research Alliance Universiti Teknologi Malaysia 81310 Skudai, Johor MALAYSIA
[email protected],
[email protected] Abstract: Ultrasound imaging became a promising way to acquire normal or abnormal condition of most human organ since it provides several advantages compared to other imaging modalities. This study used ultrasound as an alternative imaging technique to acquire a colon image and determine the thickness of the colon wall. The normal or abnormal colon condition can be evaluated from colon wall thickness. Colon image was scanned in three parts; ascending part, transverse part and descending part. In order to obtain clear image and ensure measurement accuracy, several steps of image processing; filtering, cropping, and segmenting were done. The results show that wall thickness measurement between ultrasound machine and processed image having a positive relationship with Pearson correlation coefficients of 0.9. The output from this study can be used for further study in assessment of various colon diseases that based on the colon wall thickness. Key-Words: Colon, Thickness Measurement, Non Invasive, Inflammatory Bowel Disease, Ulcerative Colitis, Crohn’s Disease, Ultrasound Image Processing.
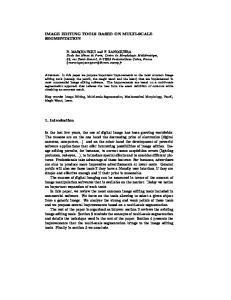
1 Introduction Ultrasound imaging is a non invasive, non ionizing, and less expensive medical diagnostic tool that produces images of internal organs or tissues. It uses echoes concept where the transducer transmits the high frequency sound wave and receives it back as a signal [1]. Measurement of colon wall thickness can be done using ultrasound imaging technique. Analysis on the colon wall thickness is able to detect the abnormalities of the colon. Based on previous studies, normal colon wall thickness is in the range less than 4 mm. Colon wall thicknesses that exceed 4 mm will be diagnosed as abnormal and can be further classified as colon-related diseases [2]. The colon also known as the large intestine which has length of 1.5 to 1.8 m as shown in Fig. 1. The colon structures divided into four parts; the ascending colon that travels up to the right side of the abdomen, the transverse colon that runs across the abdomen, the descending colon that travels down the left abdomen and the sigmoid colon that is a short curving just before the rectum [3]. The colon wall can be divided into five distinct layers which are the mucosa, the submucosa, the muscle, the subserosa, and the serosa.
ISBN: 978-1-61804-122-7
Fig. 1. Anatomical view of the colon.
Major abnormality that occurs in the colon is the inflammatory bowel disease (IBD). IBD is a chronic inflammatory of the intestinal tract which commonly affects the children. Two major phenotypes of IBD are Crohn’s disease (CD) and Ulcerative colitis (UC). These diseases can be easily mistaken because both have similar symptoms and treatments [4-7]. Crohn’s disease is an inflammation of any part of gastrointestinal (GI) tract, where the
324
Advances in Environment, Biotechnology and Biomedicine
data collection, image processing, colon wall thickness measurement, and data analysis.
end part of small intestine is the most affected, whereas ulcerative colitis (UC) is the inflammation and ulcer in the lining of the colon [8]. Abdominal pain, diarrhea, fever, weight loss, vomiting and dehydration may indicate the symptom of Crohn’s disease and also ulcerative colitis [9-10]. Colon wall thickness measurement has important roles in determining the IBD. Table 1 shows the value of colon wall thickness in normal range for ascending colon, transverse colon and descending colon wall [11]. The main differences ultrasound features of Crohn’s disease and Ulcerative colitis are shown in Table 2 [12].
2.1 Data collection Ultrasounds scanning of 5 subjects (22 – 23 years old) were obtained using Ultrasound Machine (TOSHIBA Aplio MX). Transabdominal transducer was used to scan the subject with frequency of 3.5 MHz. All data recorded by registered diagnostic medical sonographer. Ultrasound images of colon were scanned into three different parts; ascending, transverse, and descending parts. The wall thickness from the colon was measured directly using ultrasound. Figure 2 shows the original image of ascending colon wall taken by ultrasound.
Table 1. Normal range value for ascending colon, transverse colon, and descending colon wall within 20 -29 years old.
2.2 Image processing
Parameter Ascending Transverse Descending part part part Thickness
0.9 ± 0.1
1.4 ± 0.2
1.5 ± 0.3
Length
0.9 – 2.0
1.0 – 1.8
0.8 – 2.0
Based on the flow chart shown in figure 3, basic manipulation techniques which are contrast and brightness adjustment have been first applied to the original image. Then, the image was filtered to remove the speckle noise. After the filtration, the image was cropped to specify acquired position based on the original colon wall. The cropped image was tested using several image segmentation methods for better result. Image segmentation was divided into three main types which are threshold/pixel based segmentation, continuity based, and edge based. This study involved Otsu thresholding, Adaptive thresholding, region growing segmentation, level set segmentation, and Canny edge detection.
Table 2. Ultrasound difference features of Crohn’s diseases and Ulcerative colitis Features Crohn’s disease Ulcerative colitis Bowel wall thickening
5-14 mm
5-7 mm
Location and extension
Ileum (70%) colon (60%)
Recto sigmoid tract and colon
2 Methodology The overall processes involved in this study were
Fig. 2. Ultrasound image of colon wall from ascending part ISBN: 978-1-61804-122-7
325
Fig. 3. The proposed algorithm to process the colon ultrasound image
Advances in Environment, Biotechnology and Biomedicine
on the plane with known velocity of the curve along its normal direction [15]. In this study, the implemented level set segmentation based on evolution of the closed curved where a ‘mask’ or initial contour region were inputted manually by user. By assuming a N-1 dimension, the hypersurface Γ(t) will be computed based on the derivation from fundamental equation in (5), (6) and (7) with s is the point in the whole iteration F, and d is the distance between Γ(t) and s.
2.2.1 Otsu thresholding method Otsu’s thresholding segmentation can be measured using variance value based on region homogeneity [13]. This method measured the two types of variances; within class variances, σ2W and between class variances, σ2B. These variances will estimate the best threshold value and applied to the selected image. The equation used to calculate the variances was shown in equation (1) and (2) where W is the pixel weight value.
φ ( s, t = 0 ) = ± d
(5)
σ 2 w = Wbσ b 2 + W f σ f 2
(1)
Initial condition of the contour region;
σ 2 B = WbW f ( µb − µ f ) 2
(2)
Γ(t = 0) = s φ ( s, t = 0 ) = 0
(6)
The embedding function;
2.2.2 Adaptive thresholding method
φt + F ∇φ = 0
Adaptive thresholding segmented the image based on different thresholding value of different regions in the image [14]. The thresholds were calculated for each pixel in the image. If the pixel value below threshold level T, the output set to be background value H2, and otherwise set as foreground value H1. Equation (3) and (4) describe the computation of H1 and H2 with f (i,j) is the pixel value located at ith column and jth row.
H1 = { f ( i , j ) : f ( i , j ) ≥ T
}
2.2.5 Canny-edge detection Before starting the canny-edge detection algorithm, the image was converted into grayscale, but this step was an optional. First, the noise is needed to be reduced and 5x5 Gaussian filter was used with σ=4. The filter will imply some blurring effect to the image. Secondly, the gradient magnitude, D and angle, θ were computed.
(3)
D=
H 2 = { f (i , j ) : f (i , j ) ≤ T }
(7)
D 2 x(x, y) + D 2 y(x, y)
Dx(x, y)
(4)
θ = arctan Dy(x, y)
2.2.3 Region growing segmentation
(8) (9)
The “non-maximal suppression” step keeps only those pixels on an edge with the highest gradient magnitude. These maximal magnitudes should occur right at the edge boundary, and the gradient magnitude should fall off with distance from the edge.
Region growing segmentation applies concept of examining the neighbouring pixels in the image and added to a region class when there is no edges detected. This process used multi iteration steps which find the difference in pixel value at the boundary region. During the iteration steps, if the adjacent regions were found to be overlapped with each other, a region-merging algorithm would be used in which weak edges were dissolved and strong edges were left intact.
2.2.4 Level set segmentation
Hysteresis thresholding step prevent this algorithm to choose a noise as selected edge. Instead of choosing a single threshold, two thresholds thigh and tlow have been selected. Pixels with a gradient magnitude D < tlow were discarded immediately.
Level set segmentation was applied specifically in location where a clear distinction between an `outside' and an `inside' region exist. Basically those regions were separated by the evolving contour. Framework concept was provided by the level set theory to evaluate any evolution of a closed curve
The colon wall thickness measurement was obtained from two different methods. The first measurement was taken during data collection step. The
ISBN: 978-1-61804-122-7
2.3 Colon wall thickness measurement
326
Advances in Environment, Biotechnology and Biomedicine
measurement was taken five times at particular colon wall segment. The overall data was divided into three main colon. Secondly, the measurement was obtained using MATLAB application.
2.4. Data analysis The data analysis was performed using SPSS analysis tool software. The mean and standard deviation of each set data were calculated. Pearson correlation coefficients (r) were computed in order to compare the measurement data before and after the image processing. The positive output obtained indicated that there was a positive relationship between the variables, whereas the negative output indicated no relationship or inverse association between variables.
r=
(
)(
Σin=1 X i − X Yi − Y
)
Fig. 5. Image after cropping After cropping, the images went through several segmentation techniques to select the best technique to extract the colon ultrasound image. Differences of the output from each segmentation technique are explained in table 3.
(10)
( n − 1) S X SY
3.2 Colon wall thickness measurement
X= standard deviation for X Y= standard deviation for Y
The aim of this study was to observe the colon abnormalities based on the colon wall thickness. Table 4 shows the measurement data for colon wall thickness obtained from both methods based on three parts of the colon; ascending, transverse and descending colons.
3 Result and Discussion The suitable segmentation method will be chosen by comparing the output image quality. The measurement data will be compared based on mean and standard deviation values. The measurement differences of colon wall thickness before and after processing will be discussed.
Based on the colon wall thickness measured, the average value for the subject in this study lay in between 1.5 mm to 3.1mm. The data indicate that there is no presence of abnormalities in the colon based on the colon wall thickness analysis. The data obtained from the processed image provide two significant figures which provide better results. These data are presented in table 4.
3.1 Image processing
Pearson correlation coefficients (r) results were computed in order to compare the measurement data before and after the image processing. The results are presented in table 5. The result show a positive correlation between the two measurements which indicate that both measurements are significantly true. Hence, both measurement methods can be implemented during analysis study on the colon abnormalities based on colon wall thickness.
The colon ultrasound images went through several basic image manipulation technique and image cropping. Original image of colon can be seen in figure 4, whereas the very same image after processing and cropping can be seen in figure 5.
Fig. 4. Original image ISBN: 978-1-61804-122-7
327
Advances in Environment, Biotechnology and Biomedicine
Table 3: The comparison based on the output image between all the segmentation processes applied to the image
Segmentation
Original image
Image after segmentation
Remarks -
The boundary of colon wall lining was clearly defined. However this technique required user to manually define the boundary by creating a mask.
-
The boundary of colon wall lining was not clearly defined.
-
The boundary of the colon wall was clearly defined and automatically generated.
-
The colon wall edge not clearly defined due to white dot present around edge.
-
The colon wall edge can be observed but hard to distinguish in between the white line.
Level Set segmentation
Region growing segmentation
Canny edge detection
Otsu thresholding method
Adaptive threshoding method
ISBN: 978-1-61804-122-7
328
Advances in Environment, Biotechnology and Biomedicine
[1] http://www.radiologyinfo.org/en/info.cfm?pg=g enus [2] James K.Fisher, M.D, ‘Normal colon wall thickness on CT’, 1982 [3] Drawing of the colon. 2011 http://www.catalog.niddk.nih.gov/imagelibrary/ [4] Christos D. Zois, Konstantinos H. Katsanos, Maria Kosmidou, Epameinondas V. Tsianos, ‘Neurologic manifestations in inflammatory bowel diseases: Current knowledge and novel insights’, 2009 [5] Matteo Cornaggiaa, Monica Leutner, Claudia Mescolic, Giacomo Carlo Sturniolo, Renzo Gullotta, ‘Chronic idiopathic inflammatory bowel diseases: The histology report’, 2011 [6] Vibeke Andersena, Anja Olsenc, Franck Carbonneld, Anne Tjønnelandc, Ulla Vogele, ‘Diet and risk of inflammatory bowel disease’, 2011 [7] Deike Strobel, Ruediger S Goertz, Thomas Bernatik, ‘Diagnostics in inflammatory bowel disease: Ultrasound’, 2011 [8] http://www.med.umich.edu/ibd/info.htm [9] John J. Murray, ‘Controversies in Crohn’s disease’, 1998 [10] Hans P Haber, Andreas Busch, Rita Ziebach, Martin Stern, ‘Bowel wall thickness measured by ultrasound as a marker of Crohn’s disease activity in children’, 2000 [11] Hans P. Haber, Martin Stern, ‘Intestinal Ultrasonography in Children and Young Adults: Bowel Wall Thickness Is Age Dependent’, 2000 [12] Giovanni Maconi, Elisa Radice, Salvatore Greco , Gabriele Bianchi Porro, ‘Bowel ultrasound in Crohn’s disease’, 2006 [13] M. Cheriet, J. N. Said, C. Y. Suen, ‘A Recursive Thresholding Technique for Image Segmentation’, 1998 [14] Tian, H., S.K. Lam, and T. Srikanthan. Implementing Otsu's thresholding process using area-time efficient logarithmic approximation unit. in Circuits and Systems, 2003. ISCAS '03. Proceedings of the 2003 International Symposium on. 2003. [15] S. Osher and J. Sethian. Fronts Propagation with Curvature Dependent Speed: Algorithms based on Hamilton-Jacobi Formulations. Journal of Computational Physics, 79:12{49, 1988. [16] Eftichis Sifakis, Christophe Garcia and Georgios Tziritas. ‘Bayesian Level Sets for Image Segmentation’, 2002.
Table 4: The colon wall thickness values for ultrasound measurement and processed image measurement based on ascending colon, transverse colon and descending colon. The result was the mean data with standard deviation. N=5.
Colon part
Colon wall thickness (mm) Ultrasound measurement
Ascending
3.1± 0.2 1.9± 0.2 2.9± 0.2 2.2± 0.2 2.0± 0.2
Image processed measurement 2.97± 0.2 1.84± 0.1 2.78± 0.2 2.15± 0.1 1.98± 0.1
Transverse
2.3± 0.2 2.5± 0.2 1.9± 0.2 2.7± 0.2 2.5± 0.2
2.27± 0.2 2.46± 0.2 1.86± 0.2 2.71± 0.2 2.44± 0.2
Descending
2.0± 0.2 1.6± 0.2 1.9± 0.2 1.9± 0.2 1.4± 0.2
2.02± 0.1 1.51± 0.2 1.88± 0.1 1.92± 0.2 1.37± 0.2
Table 5: The Pearson correlation coefficients value for ascending, transverse, and descending Colon part Pearson correlation coefficients, r Ascending 0.999374 Transverse 0.997176 Descending 0.992746
4 Conclusion From the results this study, we can verify that ultrasound imaging can accurately measure the colon wall thickness to be used for detection of colon abnormality. Image processing technique helps the appearance of the image without any distortion and it is supported by the strong correlation between data before and after image processing. References:
ISBN: 978-1-61804-122-7
329